 Open Access Article
Study of the thermal decomposition mechanism of FOX-7 by molecular dynamics simulation and online photoionization mass spectrometry†
Liping Jiang a,
Xiaolong Fu*a,
Zhongyue Zhou*b,
Chongmin Zhang
 a,
Jizhen Lia,
Fei Qib,
Xuezhong Fana and
Guofang Zhang
 c
c
aXi'an Modern Chemistry Research Institute, Xi'an, 710065, PR China. E-mail: fuxiaolong204@163.com
bKey Laboratory for Power Machinery and Engineering of Ministry of Education (MOE), Shanghai Jiao Tong University, Shanghai, 200240, PR China. E-mail: zhongyue.zhou@sjtu.edu.cn.
cKey Laboratory of Applied Surface and Colloid Chemistry, MOE, School of Chemistry and Chemical Engineering, Shaanxi Normal University, Xi'an 710062, PR China
First published on 3rd June 2020
Abstract
The thermal decomposition mechanism of energetic materials is important for analyzing the combustion mechanisms of propellants and evaluating the safety of propellants during transport and storage. 1,1-Diamino-2,2-dinitroethylene (FOX-7) is an important insensitive energetic material that can be used as an oxidizer in propellants. However, the initial decomposition mechanism of FOX-7 is not clear to date. The ReaxFF molecular dynamics method is widely used in the investigation of the thermal decomposition mechanisms of energetic materials. Meanwhile, the combination of thermogravimetry with online photoionization time-of-flight mass spectrometry (TG-PI-TOF-MS) and online single-photon ionization time-of-flight mass spectrometry (SPI-TOF-MS) can reveal the decomposition products, which may be integrated with the results of the simulation. In this study, the primary thermal decomposition mechanism of 1,1-diamino-2,2-dinitroethylene (FOX-7) was studied by the ReaxFF molecular dynamics simulations and online photoionization mass spectrometry. The results of the molecular dynamics simulations showed that the primary decomposition step of FOX-7 is C–NO2 cleavage; after this, C![[double bond, length as m-dash]](https://www.rsc.org/images/entities/char_e001.gif) O formation occurs via a three-membered ring transition state, followed by NO elimination. The remaining structure loses NH2 and H, resulting in the formation of the NHC
O formation occurs via a three-membered ring transition state, followed by NO elimination. The remaining structure loses NH2 and H, resulting in the formation of the NHC![[double bond, length as m-dash]](https://www.rsc.org/images/entities/char_e001.gif) C
C![[double bond, length as m-dash]](https://www.rsc.org/images/entities/char_e001.gif) O structure, which finally breaks down into HNC and CO. NH2 reacts with an H atom to produce NH3. A reversible intramolecular hydrogen transfer was also observed at 2500 K; however, it failed to dominate the decomposition reaction. During the decomposition of FOX-7, the major products are N2, NH3, CO2, and H2N2 and the minor products are H2O, HN2, and H2. The TG-PI-TOF-MS spectrum shows three signals, i.e., m/z = 18, 28, and 30, which can be assigned to H2O, CO, and NO, respectively. Moreover, four signals at m/z = 72.72, 55.81, 45.79, and 29.88 corresponding to the products (NH2)2C
O structure, which finally breaks down into HNC and CO. NH2 reacts with an H atom to produce NH3. A reversible intramolecular hydrogen transfer was also observed at 2500 K; however, it failed to dominate the decomposition reaction. During the decomposition of FOX-7, the major products are N2, NH3, CO2, and H2N2 and the minor products are H2O, HN2, and H2. The TG-PI-TOF-MS spectrum shows three signals, i.e., m/z = 18, 28, and 30, which can be assigned to H2O, CO, and NO, respectively. Moreover, four signals at m/z = 72.72, 55.81, 45.79, and 29.88 corresponding to the products (NH2)2C![[double bond, length as m-dash]](https://www.rsc.org/images/entities/char_e001.gif) C
C![[double bond, length as m-dash]](https://www.rsc.org/images/entities/char_e001.gif) O, (NH2)C
O, (NH2)C![[double bond, length as m-dash]](https://www.rsc.org/images/entities/char_e001.gif) C
C![[double bond, length as m-dash]](https://www.rsc.org/images/entities/char_e001.gif) O, NO2, and NO have been obtained in the SPI-TOF-MS spectrum. The experimental data obtained via online photoionization mass spectrometry further validated the results of the molecular dynamics simulations.
O, NO2, and NO have been obtained in the SPI-TOF-MS spectrum. The experimental data obtained via online photoionization mass spectrometry further validated the results of the molecular dynamics simulations.
1. Introduction
With the development of high-value weapon systems such as aircraft carriers, capital ships, strategic systems, and helicopters, new requirements have been placed on solid propellants, especially for improving their energy characteristics. The combustion and explosion of energetic materials during their transport and storage may lead to personal injury and property damage. Therefore, the exploration of insensitive energetic materials for weapons is essential to improve the performance of weapons. To date, the well-known insensitive compounds mainly include 2,4-dinitroanisole (DNAN), 3-nitro-1,2,4-triazol-5-one (NTO), nitroguanidine (NQ),1 1,1-diamino-2,2-dinitroethylene (FOX-7), and N-guanylurea-dinitramide (FOX-12).2 As one of the representative insensitive compounds, FOX-7 was first synthesized in 1998 and subsequently, its crystal structure was determined.3–5 Due to its low sensitivity,6 high explosive performance,7 and excellent compatibility,8 FOX-7 is expected to be one of the promising insensitive energetic materials and may partially substitute conventional high-energy explosives in propellants.9By studying the thermal decomposition behavior of energetic compounds, their possible performance changes during use and storage can be predicted. The thermal decomposition behavior of FOX-7 has attracted wide attention. Gindulyté et al.10 calculated the energy barrier of the possible primary step of nitro-to-nitrite rearrangement of FOX-7 via two methods: 59.1 kcal mol−1 via B3LYP and 59.7 kcal mol−1 via B3P86. The nitro-to-nitrite rearrangement was regarded as the most likely initial step. Kimmel11 used density functional theory (DFT) to investigate the electronic structure and dissociation pathways of FOX-7 in the gas phase. They found two competing initial decomposition mechanisms: C–NO2 bond breakage and C–NO2 to CONO isomerization. Zheng et al.12 simulated the thermolysis behavior of FOX-7 via the first-principles molecular dynamics approach. The results showed that N2 and H2O were the dominant products of thermal decomposition, and NO2+, OH−, and NO+ served as intermediate products. Taylor et al.13 adopted a highly accurate SAPT(DFT) approach to develop a potential energy function for the 1,1-diamino-2,2-dinitroethylene (FOX-7) energetic crystal. The intermolecular potential results in a crystal structure, and the thermal/pressure responses are in very good agreement with the experimental results. Based on the experimental results of nanosecond- and energy-resolved spectroscopy and CASSCF calculations, Yuan et al.14 concluded that the first step of FOX-7 ground-state decomposition is nitro-nitrite isomerization. Although a HONO product was energetically feasible, it was not the main initial decomposition product. Kiselev and Gritsan15 revealed the primary reactions of FOX-7 in the gas phase by CCSD(T)-F12/aVTZ calculations. Moreover, two unexpected initial reactions (enamino-imino isomerization and intramolecular cyclization) were found, and their activation energies were 48.4 and 28.8 kcal mol−1, respectively. Liu et al.16 conducted ab initio molecular dynamics simulations to study the decomposition reactions of solid FOX-7. The calculations revealed that the C–NO2 bond fission is the most general route. Moreover, the inter- and intramolecular H transfers are possible. The major products were found to be H2O, CO2, and N2. Booth and Butler17 explored the primary and subsequent steps by theoretical calculations at the G4//B3LYP/6-311++g(3df,2p) level. The results showed that the intramolecular H transfer from NH2 to C2 has the lowest energy barrier in isolated FOX-7 molecules. Jiang and co-workers18 studied the early reactions of FOX-7 via self-consistent charge DFT tight-binding molecular dynamics simulations. The simulations suggested that the C–NO2 rupture is indeed the dominant step that triggers the decomposition of FOX-7. The decomposition behavior of FOX-7 is related to the heating method. Zhu et al.19 performed DFTB-MD simulations to study the primary decomposition and combustion reaction mechanisms of isolated FOX-7 molecules. The results indicated that the initial step in the decomposition of isolated FOX-7 is N–O bond breaking. After efforts for many years, numerous experiments have been conducted to investigate the decomposition mechanism of FOX-7 by theoretical calculation methods, which provide a basis for the in-depth understanding of the decomposition mechanism of FOX-7. However, the initial decomposition reaction mechanism is not clear to date, and there are very few studies whose results can be used to verify or integrated with the experimental results.
The ReaxFF molecular dynamics simulation not only can provide atomistic information but can also simulate the thermal decomposition mechanisms and shock sensitivity of energetic materials (EMs) including hexahydro-1,3,5-trinitro-1,3,5-s-triazine (RDX),20–22 octahydro-1,3,5,7-tetranitro-1,3,5,7-tetrazocine (HMX),23–25 triacetone triperoxide (TATP),26 pentaerythritol tetranitrate (PETN),27 trinitrotoluene (TNT),28 and hexanitrohexaazaisowurtzitane (CL-20).29,30 The ReaxFF method was also applied to investigate the decomposition processes of energetic composite nanomaterials.31,32 The ReaxFF molecular dynamics simulations show significant advantages in studying the decomposition mechanisms of energetic compounds since using these simulations, the thermal decomposition processes of energetic compounds can be comprehensively investigated.
Recently, mass spectrometry combined with soft ionization technology has been proved to achieve the real-time and online analysis of coal and biomass pyrolysis,33,34 and it has high sensitivity and ultrahigh resolution and does not require sample preparation. Thermogravimetry (TG) coupled with online photoionization time-of-flight mass spectrometry (PI-TOF-MS) has been successfully used to evaluate the co-pyrolysis of kraft lignin (KL) and lignite (LI).35 Additionally, Wang's group has conducted the thermal and catalytic pyrolysis of polypropylene (PP) and PP/50% HZSM-5 at various temperatures by an online single-photon ionization time-of-flight mass spectrometry (SPI-TOF-MS).36,37 Most of the usual energetic compounds have relatively simple structures, and it is expected that future studies related to the thermal decomposition of energetic compounds can be performed using on-line photoionization mass spectrometry techniques.
In this study, we focused on the investigation of the initial thermal decomposition mechanisms of FOX-7 by two methods: online photoionization mass spectrometry and ReaxFF molecular dynamics simulations. The evolution of product distribution and the pathway of the unimolecular thermolysis of FOX-7 were also discussed in detail. Meanwhile, we determined the pathways for the formation of the final products from the initial products and intermediate products. This work is helpful to obtain insights into the thermal decomposition mechanisms of FOX-7.
2. Methods
2.1 TG-PI-TOF-MS
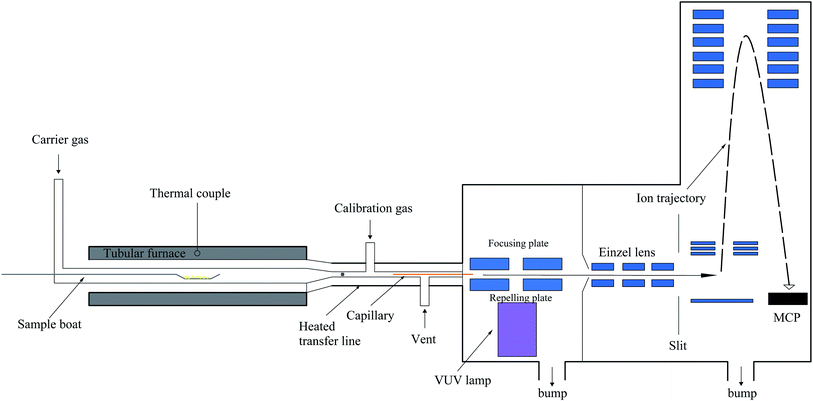
The TG-PI-TOF-MS setup comprises a commercial TG analyzer (Discovery TGA, TA Instruments) and a homemade TOF mass spectrometer. A schematic of the TG analyzer combined with a photoionization time-of-flight mass spectrometer is exhibited in Fig. 1. The TG experiments were conducted using a thermogravimetric analyzer (Discovery TGA, TA Instruments), and the sample mass was about 10 mg. The homemade TOF mass spectrometer was applied to detect the product signals generated during the decomposition experiments. In order to eliminate the interference of nitrogen, we used an argon atmosphere. The temperature program was set as follows: the system was maintained at 50 °C for 10 min, heated to 400 °C at the rate of 5 °C min−1, and then maintained at 400 °C for 1 min. The flow rate of argon was kept at 50 mL min−1 during the experiment. As shown in Fig. 1, the PI-TOF mass spectrometer consists of a sampling interface, a photoionization chamber, a DC-only einzel lens, and a reflectron TOF mass analyzer with a mass resolution of approximately 3000 (m/Δm). The evolved gases were sampled by a fused silica capillary with an inner diameter of 70 μm, which was then introduced into the photoionization chamber. The temperature of the capillary was kept at 200 °C, and the pressure of the photoionization chamber was maintained at 8.5 × 10⁻² Pa by an 80 L s−1 molecular pump. The pressure of the TOF mass analyzer was kept at 5.0 × 10⁻⁵ Pa by a 600 L s−1 molecular pump. The thermolysis products were ionized by 10.6 eV photons emitted from a vacuum ultraviolet (VUV) lamp (Heraeus, Ltd.) and analyzed by the TOF mass analyzer. The data were obtained every 60 s. Data processing was performed using the MATLAB software.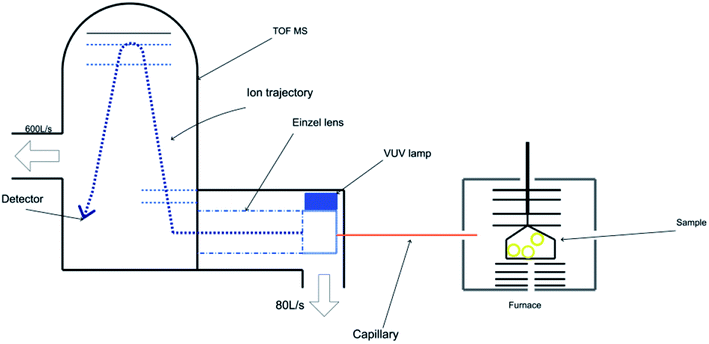 | ||
| Fig. 1 Schematic of the TG analyzer combined with a photoionization time-of-flight mass spectrometer. | ||
2.2 SPI-TOF-MS
The setup of SPI-TOF-MS is composed of a tubular furnace, heated transfer line, and homemade photoionization orthogonal acceleration TOF-MS. Fig. 2 shows a schematic of the SPI-TOF-MS system. The tubular temperature was controlled by a temperature controller (SKY Technology Development Co., Shenyang, China) and measured using a K-type thermocouple. Argon was used as the carrier gas (200 sccm) to provide an inert atmosphere. Ethylene (Nanjing Special Gas Factory Co., Ltd., China) was used for the calibration of the VUV light intensity. Since we wanted to investigate the entire decomposition process, a 10 mg sample was placed on a sample boat and then introduced into the furnace. In the present study, the temperature was increased from 50 °C to 400 °C at the rate of 5 °C min−1. The pyrolysis products were passed through a glass fiber filter with a pore size of 1.2 μm and then introduced into a deactivated fused-silica capillary for extracting partially gaseous products. The gaseous samples introduced into the middle region between the repelling and focusing electrodes were ionized by the crossed VUV light. Subsequently, the produced ions were introduced into the mass spectrometer chamber via a nickel skimmer (1 mm inner diameter, Beam Dynamics, Jacksonville, FL) and focused by a set of einzel lenses. The ions were then transmitted through a slit (2 mm × 10 mm) into the extract region and detected by a reflectron TOF-MS. A VT120C preamplifier (EG&G, ORTEC, Oak Ridge, TN) was used to amplify the ion signals, which were then recorded by the P7888 multiscaler (FAST Comtec, Oberhaching, Germany). The data was acquired every 60 seconds and processed by the MATLAB software.2.3 Simulation details
The ReaxFF method is a molecular force field method based on the bond order; it is often used in molecular dynamics simulations, and its accuracy is similar to or better than that of PM3. The energy terms that constitute the total energy are the bond energy, over-coordination penalty energy, under-coordination correction energy, torsion angle energy, valence angle energy, lone-pair electron energy, coulomb interaction energies, and van der Waals interaction energy, as presented in eqn (1).| EReaxFF = Ebond + Eover + Eunder + Etors + Eval + Elp + Ecoul + EvdW | (1) |
The total energy of the ReaxFF-lg force field and the long-range-correction terms were calculated using the low-gradient model, as presented by eqn (2) and (3), respectively.
| EReaxFF-lg = EReaxFF + Elg | (2) |
 | (3) |
The crystal structure of FOX-7 was obtained from the Cambridge Data Centre (CCDC number: 130779). The unit cell contains four molecules. We first implemented geometry optimization via the ReaxFF-lg method and obtained the lattice parameters; then, we compared the obtained results with the X-ray experimental data, as presented in Table 1. The optimized unit cell parameters are very close to the experimental values; this indicates that the ReaxFF-lg force field method can be a reliable method to describe the crystal structure of FOX-7.
| Method | a (Å) | b (Å) | c (Å) | α (deg) | β (deg) | γ (deg) | Density (g cm−3) | |
|---|---|---|---|---|---|---|---|---|
| CCDC | X-ray | 6.941 | 6.569 | 11.315 | 90.00 | 90.55 | 90.00 | 1.914 |
| This work | ReaxFF-lg | 6.922 | 6.554 | 11.281 | 90.00 | 90.55 | 90.00 | 1.92 |
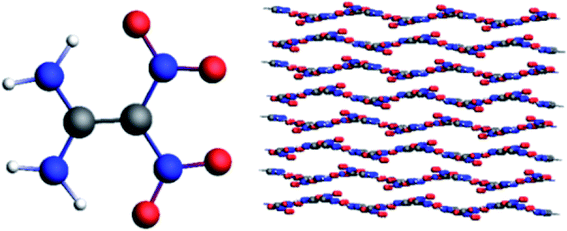
The 4 × 4 × 3 supercell was established by enlarging the unit cell along the a, b, and c axes, which contains 48 unit cells, 192 FOX-7 molecules, and 2688 atoms, as shown in Fig. 3. The reactive molecular dynamics simulations were performed using the ADF software package with the ReaxFF-lg force field. The 50 ps microcanonical (NVE) simulation was carried out, followed by the 50 ps isothermal–isochoric (NVT) and 200 ps isothermal–isobaric (NPT) MD simulations with a time step of 0.25 fs to relax the structure at 298 K under 0.1 MPa. The damping constants of the Nose–Hoover chain thermostat and NHCP anisotropic barostat were 100 fs and 500 fs, respectively. The density obtained by the NPT simulation is 1.92. After the 200 ps NPT simulation, 200 ps NVT Nose–Hoover chain simulations with a time step of 0.25 fs were conducted at 2000, 2500, 3000, 3500, and 4000 K. We estimated chemical bond formation when the bond order was equal to or greater than 0.3.
3. Results and discussion
3.1 TG-PI-TOF-MS and TOF-MS experiments
Nearly all the mass peaks obtained upon the near-threshold “soft” photoionization could be assigned to the parent ions with few or no fragments. The TG-PI-TOF-MS and SPI-TOF-MS techniques were used to detect the pyrolysis products and reaction intermediates. The reaction network could be inferred from these products. The TG-PI-TOF-MS experimental results are shown in Fig. 4. The TG-PI-TOF-MS spectrum shows the signals of three products at m/z = 18, m/z = 28, and m/z = 30. The signals at m/z = 18 and m/z = 30 were assigned to H2O and NO, respectively. The mass-to-charge ratio of 28 may be attributed to CO. In the experiment, FOX-7 was heated starting from 50 °C at the heating rate of 5 °C per minute, a temperature of about 230 °C was reached at the thirty-sixth minute, and these three products were generated in a significant amount by the thermal decomposition of FOX-7. The peak of NO is obviously stronger than those of the other two products. All the minor products were mainly produced in the low-temperature exothermic stage of FOX-7 decomposition.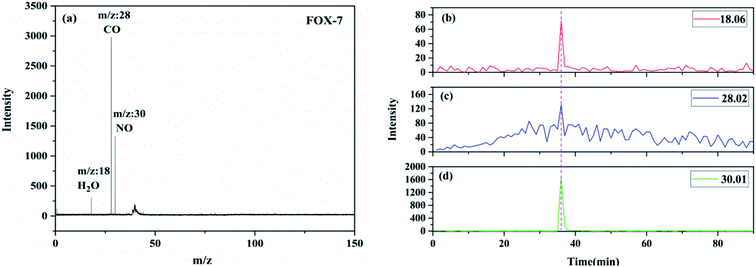 | ||
| Fig. 4 The TG-PI-TOF-MS spectrum of FOX-7 (a); evolutions of the thermolytic products of FOX-7 during the decomposition process: (b) m/z = 18.06, (c) m/z = 28.02, and (d) m/z = 30.01. | ||
Fig. 5 shows the SPI-TOF-MS experimental results of FOX-7. As can be observed from the results, four peaks at m/z = 29.88, 45.79, 55.81, and 72.72 were detected. The peaks at m/z = 29.88 and 45.79 were readily assigned to NO and NO2, respectively. The mass-to-charge ratios of 55.81 and 72.72 may be ascribed to (NH2)C![[double bond, length as m-dash]](https://www.rsc.org/images/entities/char_e001.gif) C
C![[double bond, length as m-dash]](https://www.rsc.org/images/entities/char_e001.gif) O and (NH2)2C
O and (NH2)2C![[double bond, length as m-dash]](https://www.rsc.org/images/entities/char_e001.gif) C
C![[double bond, length as m-dash]](https://www.rsc.org/images/entities/char_e001.gif) O, respectively. The maximum intensity peaks corresponding to nitrogen dioxide and nitric oxide were obtained at 279.87 and 285.51 °C, respectively, which demonstrate that nitrogen dioxide is produced before nitric oxide. Therefore, the primary decomposition reaction of FOX-7 is initiated by the C–NO2 fission. The earliest appeared fragment was (NH2)2C
O, respectively. The maximum intensity peaks corresponding to nitrogen dioxide and nitric oxide were obtained at 279.87 and 285.51 °C, respectively, which demonstrate that nitrogen dioxide is produced before nitric oxide. Therefore, the primary decomposition reaction of FOX-7 is initiated by the C–NO2 fission. The earliest appeared fragment was (NH2)2C![[double bond, length as m-dash]](https://www.rsc.org/images/entities/char_e001.gif) C
C![[double bond, length as m-dash]](https://www.rsc.org/images/entities/char_e001.gif) O, and its maximum intensity peak appeared at 223 °C; thus, this fragment might have originated from the C–NO2 cleavage, followed by the loss of NO. The mass-to-charge ratio of 55.81 with the maximum intensity peak at 235 °C belonged to (NH2)C
O, and its maximum intensity peak appeared at 223 °C; thus, this fragment might have originated from the C–NO2 cleavage, followed by the loss of NO. The mass-to-charge ratio of 55.81 with the maximum intensity peak at 235 °C belonged to (NH2)C![[double bond, length as m-dash]](https://www.rsc.org/images/entities/char_e001.gif) C
C![[double bond, length as m-dash]](https://www.rsc.org/images/entities/char_e001.gif) O, which was generated by the removal of a NH2 species from (NH2)2C
O, which was generated by the removal of a NH2 species from (NH2)2C![[double bond, length as m-dash]](https://www.rsc.org/images/entities/char_e001.gif) C
C![[double bond, length as m-dash]](https://www.rsc.org/images/entities/char_e001.gif) O.
O.
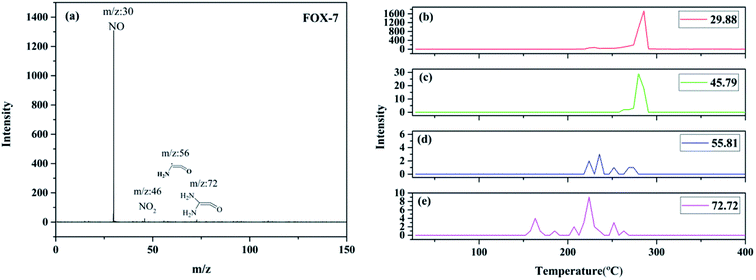 | ||
| Fig. 5 The SPI-TOF-MS spectrum of FOX-7 (a); evolutions of the thermolysis products of FOX-7 during the decomposition process: (b) m/z = 29.88, (c) m/z = 45.79, (d) m/z = 55.81, and (e) m/z = 72.72. | ||
3.2 Evolution of energy release and product distribution
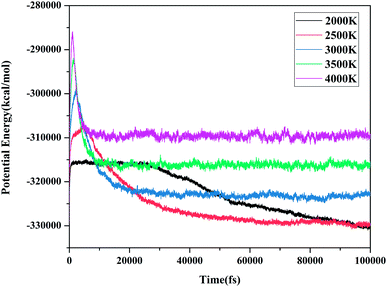
Molecular potential energy (PE) is closely related to molecular interactions and the relative positions of molecules.38 It can intuitively indicate the change in the potential energy with time. Meanwhile, the degree of reaction can also be determined. Fig. 6 shows the evolution of PE with time at various molecular dynamics simulations temperatures. When the PE approached a stable value, we considered that the decomposition reaction was completed. Based on these judgment conditions, it seems that the reaction did not reach equilibrium at 2000 K and 2500 K during the entire simulations. After 20 ps, the potential energy became stable at 3000, 3500, and 4000 K. The PE curves showed similar trends at different temperatures. The decomposition process undergoes three stages: increasing to a maximum, decreasing, and finally balancing, simultaneously, the maximum and equilibrium values of the PE increased with the increasing temperature.The distribution of the products generated by FOX-7 decomposition can also be obtained through the ReaxFF molecular dynamics simulation. The evolution of the major products of FOX-7 decomposition is shown in Fig. 7. Partial products were observed at 2000 and 2500 K; this indicates that the decomposition reaction may not be completely accomplished. The product evolution curves at 3000, 3500, and 4000 K are similar. All the final products start to appear at 2500 K. In Fig. 7, we can observe that after thermal decomposition, N2, NH3, CO2, and H2N2 are the dominant products and H2O, HN2, and H2 are the minor products. The amount of H2O molecules first increases and then gradually decreases with time; this represents the formation and consumption of H2O molecules. The populations of other products increase in the initial stages and then become stable. The cases of the initial/intermediate products (NO2 and NO) have been discussed in the Section 3.3.
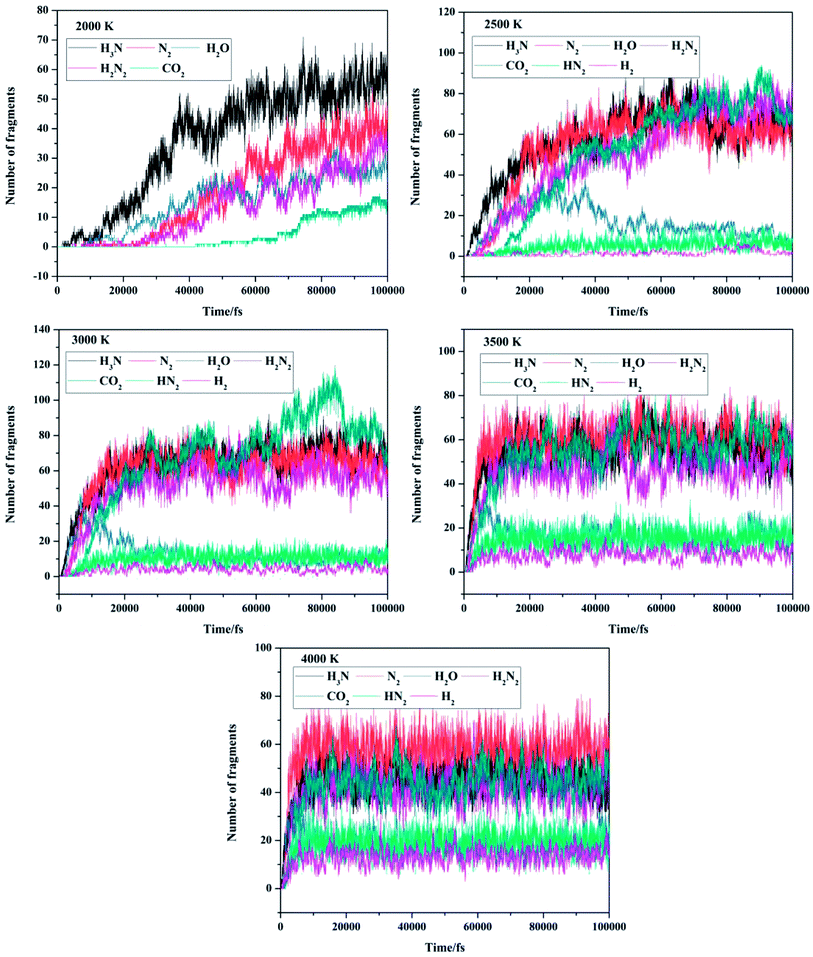 | ||
| Fig. 7 Evolution of the major products of FOX-7 decomposition at various MD simulation temperatures. | ||
3.3 Initial thermal decomposition reactions
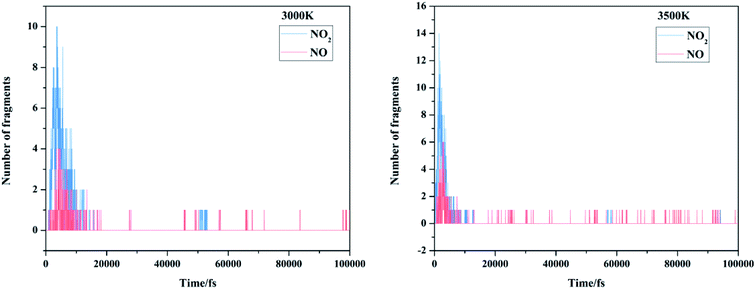
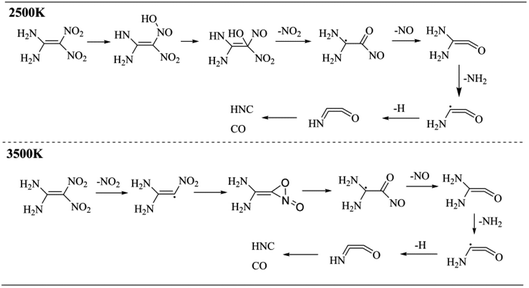
There are mainly three popular views on the initial decomposition step of FOX-7: nitro-to-nitrite rearrangement, direct cleavage of the nitro group on the carbon atom, and intermolecular or intramolecular hydrogen transfer. We first focused on the emergence order of nitro and nitric oxide during the entire MD simulations. The evolution of the initial/intermediate products NO2 and NO is exhibited in Fig. 8. It can be clearly observed from our dynamic calculations that nitrogen dioxide appeared earlier than nitric oxide; this demonstrates that the primary reaction of FOX-7 decomposition is C–NO2 cleavage.The molecular dynamics simulations can generate a series of trajectory images, from which the decomposition pathway can be determined. Therefore, the unimolecular decomposition reactions of FOX-7 via the 37.5 ps NVT Berendsen simulations with a time step of 0.25 fs at 2500 K and bimolecular reactions via the 100 ps NVT Berendsen simulations with the same time step at 3500 K were investigated. Fig. 9 displays two schematics of the decomposition pathways at 2500 K and 3500 K. The corresponding images are presented in Fig. S1† and 10. An obvious conclusion is that the initial decomposition step of FOX-7 is C–NO2 cleavage. The intramolecular H transfer occurs at 2500 K, and then, the structure is converted to (NH2)2C![[double bond, length as m-dash]](https://www.rsc.org/images/entities/char_e001.gif) C
C![[double bond, length as m-dash]](https://www.rsc.org/images/entities/char_e001.gif) O with the loss of nitric oxide. After the cleavage of C–NO2, the remaining structure passes through a three-membered ring transition state to form a C
O with the loss of nitric oxide. After the cleavage of C–NO2, the remaining structure passes through a three-membered ring transition state to form a C![[double bond, length as m-dash]](https://www.rsc.org/images/entities/char_e001.gif) O bond. The third step is C–NO cleavage followed by the elimination of NH2 and H. The HNC
O bond. The third step is C–NO cleavage followed by the elimination of NH2 and H. The HNC![[double bond, length as m-dash]](https://www.rsc.org/images/entities/char_e001.gif) C
C![[double bond, length as m-dash]](https://www.rsc.org/images/entities/char_e001.gif) O structure decomposes into HNC and CO.
O structure decomposes into HNC and CO.
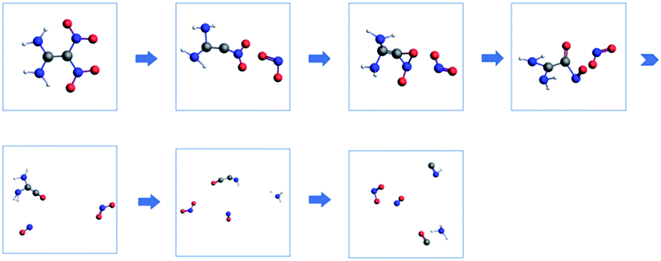 | ||
| Fig. 10 Proposed decomposition pathway of FOX-7 (the C, H, O, and N atoms are represented by gray, white, red and blue, respectively). | ||
3.4 Proposed decomposition pathway
Based on the mass spectrometry results, a decomposition strategy was proposed. The decomposition reaction of FOX-7 is initiated by the C–NO2 fission, and then, the remaining structure passes through a three-membered ring transition state to form the C![[double bond, length as m-dash]](https://www.rsc.org/images/entities/char_e001.gif) O bond followed by the cleavage of C–NO and loss of NH2 and H; this results in formation of the NHC
O bond followed by the cleavage of C–NO and loss of NH2 and H; this results in formation of the NHC![[double bond, length as m-dash]](https://www.rsc.org/images/entities/char_e001.gif) C
C![[double bond, length as m-dash]](https://www.rsc.org/images/entities/char_e001.gif) O structure, which finally breaks down into HNC and CO. NH2 can react with the H atom to produce NH3; this results in an increase in the number of NH3 molecules. The corresponding decomposition pathway is shown in Fig. 10.
O structure, which finally breaks down into HNC and CO. NH2 can react with the H atom to produce NH3; this results in an increase in the number of NH3 molecules. The corresponding decomposition pathway is shown in Fig. 10.
3.5 Formation mechanisms of the final products
In order to investigate the formation mechanism of the final products, the 100 ps NVT Berendsen simulations with a time step of 0.25 fs at 3000 K were performed for six FOX-7 molecules. Starting from these final product molecules, the formation pathways could be found by a reverse mapping strategy from the movie interface of the ADF software. The final decomposition products of FOX-7 are N2, NH3, CO2, H2N2, H2O, HN2, and H2. Table 2 presents the corresponding results.We first focused on the formation of CO2 molecules. The CO molecules interact with each other to generate CO2 and O. The gain and loss of an O atom occurs between CO2 and CO. Another CO2 formation channel is the uptake of O atoms from NO2 or NO by CO to generate CO2 and other products. Water molecule formation occurs via a relatively complex process. The first pathway is the reaction of NH3 with NO to produce H2N2 and OH, which then decompose into HN2 and H2O, respectively. The second pathway is the combination of OH and NO to generate HONO. Subsequently, HONO reacts with H to provide H2O and NO. The last route is the reaction of an H atom with NO2 to form HNO2, and then, HNO2 reacts with HN2 to produce HNOOH and N2. HNOOH eventually decomposes into H2O and NO. Nitrogen is mainly produced by the decomposition of H2N2 and HN2. The NH3 molecules are usually generated from the reaction of NH2 with H. H2N2 is produced by three channels: HN2 can turn into H2N2 by taking an H atom from H2N2; two NH groups can also form H2N2; and H2 can react with N2 to produce H2N2. H2 is mainly produced by the decomposition of NH3, NH4, and the intermediates H2N2 and H3N2. Another scheme is the reaction between HN2 and NH3. The formation of HN2 also occurs via several pathways. The first pathway is the decomposition of H2N2. The addition of an H atom to N2 can generate HN2. The third route is the formation of HNO2 by an H atom and NO2, followed by the reaction of HNO2 with N2. The H atom is detached from H2N2, and then, this detached H atom can react with OH to generate H2O. The last channel is the transfer of an H atom from NH3 to N2 to generate HN2.
3.6 Apparent kinetics of the initial reactions
Understanding the initial reaction kinetics of energetic compounds is of great significance for the theoretical research and practical applications of these compounds. The 10 ps NVT-MD simulations were performed at 2000, 2500, 3000, 3500, and 4000 K for FOX-7. The decomposition reaction can be fitted to the first-order reaction kinetics, as presented in eqn (4).| −d[FOX-7]/dt = k[FOX-7] | (4) |
The eqn (4) can also be written as eqn (5):
| ln[N0/Nt] = kt | (5) |
The relationship between the reaction rate constant and temperature can be fitted to the Arrhenius eqn (6):
k = A![[thin space (1/6-em)]](https://www.rsc.org/images/entities/char_2009.gif) exp(−Ea/RT) exp(−Ea/RT)
| (6) |
The evolution of the pure FOX-7 molecules at various temperatures is exhibited in Fig. 11. According to the data provided in Fig. 11a, Table 3 was created, which presents the relevant parameters of the fitted Arrhenius equation for FOX-7, where T is temperature, N0 is the initial number of FOX-7 molecules, t is time, and k is the reaction rate constant. After this, using the relationship between ln![[thin space (1/6-em)]](https://www.rsc.org/images/entities/char_2009.gif) k and 1/T, an Arrhenius plot of the rate constants of pure FOX-7 molecules at various temperatures was obtained. The intercept and slope obtained from Fig. 11b are 31.71 and −10.59, respectively, which indicate that −Ea/R is −10.59 and ln
k and 1/T, an Arrhenius plot of the rate constants of pure FOX-7 molecules at various temperatures was obtained. The intercept and slope obtained from Fig. 11b are 31.71 and −10.59, respectively, which indicate that −Ea/R is −10.59 and ln![[thin space (1/6-em)]](https://www.rsc.org/images/entities/char_2009.gif) A is 31.71. Consequently, the activation energy of the decomposition reaction for FOX-7 was calculated to be 88.04 kJ mol−1, and the pre-index factor was 5.90 × 10¹³. However, the activation energy measured by differential scanning calorimetry was 58 kcal mol−1,39 which is higher than the calculated activation energy.
A is 31.71. Consequently, the activation energy of the decomposition reaction for FOX-7 was calculated to be 88.04 kJ mol−1, and the pre-index factor was 5.90 × 10¹³. However, the activation energy measured by differential scanning calorimetry was 58 kcal mol−1,39 which is higher than the calculated activation energy.
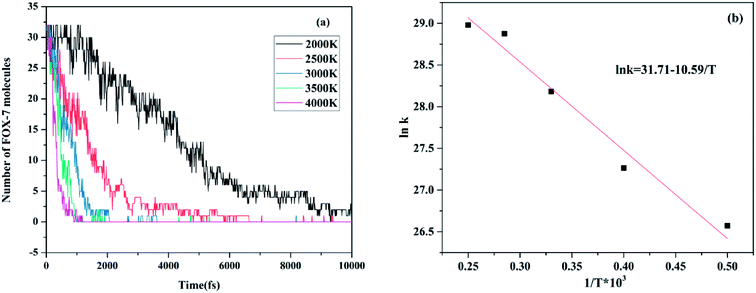 | ||
| Fig. 11 (a) Evolution of pure FOX-7 molecules at various temperatures and (b) Arrhenius plot of the rate constants of pure FOX-7 molecules at various temperatures. | ||
| T/K | 1/T × 103 | N0 | t/ps | K × 1012 | ln![[thin space (1/6-em)]](https://www.rsc.org/images/entities/char_2009.gif) k k |
|---|---|---|---|---|---|
| 2000 | 0.5 | 32 | 10 | 0.3465 | 26.5711 |
| 2500 | 0.4 | 32 | 5 | 0.6931 | 27.2644 |
| 3000 | 0.33 | 32 | 2 | 1.7328 | 28.1807 |
| 3500 | 0.285 | 32 | 1 | 3.4657 | 28.8739 |
| 4000 | 0.25 | 32 | 0.9 | 3.8508 | 28.9793 |
4. Conclusions
Herein, the thermal decomposition behavior of FOX-7 was investigated by molecular dynamics simulations and online photoionization mass spectrometry (TG-PI-TOF-MS and SPI-TOF-MS). The evolution of the energy release and major products and formation mechanisms of the final products were further studied. The conclusions are as follows:(1) The evolution of the major products of FOX-7 decomposition demonstrates that N2, NH3, CO2, and H2N2 are the dominant products of thermal decomposition and H2O, HN2, and H2 are the minor products.
(2) By combining the mass spectrometry data with the molecular dynamics simulation results, we proposed a decomposition pathway for FOX-7: C–NO2 fission is the initial step responsible for the dissociation of FOX-7, and then, the remaining structure undergoes a three-membered ring transition state to form C![[double bond, length as m-dash]](https://www.rsc.org/images/entities/char_e001.gif) O followed by C–NO cleavage and the loss of NH2 and H; this results in the formation of the NHC
O followed by C–NO cleavage and the loss of NH2 and H; this results in the formation of the NHC![[double bond, length as m-dash]](https://www.rsc.org/images/entities/char_e001.gif) C
C![[double bond, length as m-dash]](https://www.rsc.org/images/entities/char_e001.gif) O structure, which finally breaks down into HNC and CO. NH2 can react with an H atom to produce NH3.
O structure, which finally breaks down into HNC and CO. NH2 can react with an H atom to produce NH3.
(3) The formation pathway of the final products was identified from the initial products and intermediate products by a reverse mapping strategy.
These findings are favorable for understanding the mechanisms of FOX-7 thermolysis. Moreover, the TG-PI-TOF-MS and SPI-TOF-MS techniques are effective experimental tools for decomposition mechanism studies and the identification of the products generated by the decomposition of energetic compounds.
Conflicts of interest
There are no conflicts to declare.Acknowledgements
This work was supported by the National Natural Science Foundation of China (21975150) and China Postdoctoral Science Foundation (2019M653532).References
- K. Agamemnon, P. Julius, F. Jacqueline, S. David, S. Benjamin and B. Washington, J. Hazard. Mater., 2012, 219–220, 75–81 Search PubMed.
- N. N. Perreault, A. Halasz, S. Thiboutot, G. Ampleman and J. Hawari, Environ. Sci. Technol., 2013, 47, 5193–5198 CrossRef CAS.
- N. V. latypov, J. Bergman, A. Langlet, U. Wellmar and U. Bemm, Tetrahedron, 1998, 54, 11525 CrossRef CAS.
- U. Bemm and H. Ostmark, Acta Crystallogr., Sect. C: Cryst. Struct. Commun., 1998, 54, 1997–1999 CrossRef.
- R. Gilardi, Crystallographic data (excluding structure factors) for the DADNE structure have been deposited with the Cambridge Crystallographic Data Centre, 12 Union Road, Cambridge CB2 1EZ, UK, 1999.
- Q. Wu, W. H. Zhu and H. M. Xiao, J. Mol. Model., 2013, 19, 4039–4047 CrossRef CAS PubMed.
- W. A. Trzcinski, S. Cudzilo, Z. Chylek and L. Szymanczyk, J. Hazard. Mater., 2008, 157, 605–612 CrossRef CAS.
- B. Janzon, H. Bergman, C. Eldsaeter, C. Lamnevik and H. OestmarkInternational Symposium on Ballistics, Proceedings, 20th, Orlando, FL, United States, 2002, vol. 1, pp. 686–693 Search PubMed.
- W. P. C. de Klerk, C. Popescu and A. E. D. M. van der Heijden, J. Therm. Anal. Calorim., 2003, 72, 955–966 CrossRef CAS.
- A. Gindulyté, L. Massa, L. Huang and J. Karle, J. Phys. Chem. A, 1999, 103, 11045–11051 CrossRef.
- A. V. Kimmel, P. V. Sushko, Â. L. Shluger and M. M. Kuklja, AIP Conf. Proc., 2007, 955, 389 CAS.
- Z. Y. Zheng, J. C. Xu and J. J. Zhao, High Pressure Res., 2010, 30, 301–309 CrossRef CAS.
- D. E. Taylor, F. Rob, B. M. Rice, R. Podeszwac and K. Szalewicz, Phys. Chem. Chem. Phys., 2011, 13, 16629–16636 RSC.
- B. Yuan, Z. J. Yu and E. R. Bernstein, J. Chem. Phys., 2014, 140, 074708 CrossRef PubMed.
- V. G. Kiselev and N. P. Gritsan, J. Phys. Chem. A, 2014, 118, 8002–8008 CrossRef CAS PubMed.
- Y. Liu, F. Li and H. Sun, Theor. Chem. Acc., 2014, 133, 1567 Search PubMed.
- R. S. Booth and L. J. Butler, J. Chem. Phys., 2014, 14, 134315 CrossRef PubMed.
- H. Y. Jiang, Q. J. Jiao and C. Y. Zhang, J. Phys. Chem. C, 2018, 122, 15125–15132 CrossRef CAS.
- D. Xiang and W. H. Zhu, Can. J. Chem., 2019, 97, 795–804 CrossRef CAS.
- A. Strachan, A. C. T. van Duin, D. Chakraborty, S. Dasgupta and W. A. Goddard, Phys. Rev. Lett., 2003, 91, 098301 CrossRef PubMed.
- K. I. Nomura, R. K. Kalia, A. Nakano and P. Vashishta, Phys. Rev. Lett., 2007, 99, 148303 CrossRef PubMed.
- K. Zheng, Y. S. Yu, B. Huang, J. Wang, J. Chen, G. N. Xie, G. Q. Lv, J. Liu, Z. Q. Qiao and G. C. Yang, Phys. Chem. Chem. Phys., 2019, 21, 17240–17252 RSC.
- M. A. Wood, A. C. T. van Duin and A. Strachan, J. Phys. Chem. A, 2014, 118, 885–895 CrossRef CAS PubMed.
- X. N. Huang, Z. Q. Qiao, X. G. Dai, K. L. Zhang, M. Li, G. Pei and Y. S. Wen, J. Appl. Phys., 2019, 125, 195101 CrossRef.
- T. T. Zhou, H. J. Song, Y. Liu and F. L. Huang, Phys. Chem. Chem. Phys., 2014, 16, 13914–13931 RSC.
- A. C. T. van Duin, Y. Zeiri, F. Dubnikova, K. Ronnie and W. A. Goddard, J. Am. Chem. Soc., 2005, 127, 11053–11062 CrossRef CAS PubMed.
- T. R. Shan, R. R. Wixom and A. P. Thompson, Phys. Rev. B, 2016, 94, 054308 CrossRef.
- D. Furman, R. Kosloff, F. Dubnikova, S. V. Zybin, W. A. Goddard, N. Rom, B. Hirshberg and Y. Zeiri, J. Am. Chem. Soc., 2014, 136, 4192–4200 CrossRef CAS PubMed.
- Q. L. Yan, S. Zeman, P. E. Sánchez Jiménez, T. L. Zhang, L. A. Pérez-Maqueda and A. Elbeih, J. Phys. Chem. C, 2014, 118, 22881–22895 CrossRef CAS.
- F. P. Wang, L. Chen, D. S. Geng, J. Y. Wu, J. Y. Lu and C. Wang, J. Phys. Chem. A, 2018, 122, 3971–3979 CrossRef CAS PubMed.
- J. C. Xu, Y. C Bian, Y. Liu and D. Zhai, Comput. Mater. Sci., 2017, 131, 126–131 CrossRef CAS.
- C. M. Zhang, X. L. Fu, Q. L. Yan, J. Z. Li, X. Z. Fan and G. F. Zhang, RSC Adv., 2019, 9, 33268–33281 RSC.
- J. J. Weng, Y. X. Liu, Y. N. Zhu, Y. Pan and Z. Y. Tian, Bioresour. Technol., 2017, 244, 125–131 CrossRef CAS PubMed.
- Y. Wang, Y. N. Zhu, Z. Y. Zhou, J. Z. Yang, Y. Pan and F. Qi, Energy Fuels, 2016, 30, 1534–1543 CrossRef CAS.
- Z. Y. Zhou, C. J. Liu, X. M. Chen, H. Ma, C. C. Zhou, Y. Z. Wang and F. Qi, J. Anal. Appl. Pyrolysis, 2019, 137, 285–292 CrossRef CAS.
- Y. Wang, Q. Huang, Z. Y. Zhou, J. Z. Yang, F. Qi and Y. Pan, Energy Fuels, 2015, 29, 1090–1098 CrossRef CAS.
- Z. X. Zhu, J. Wang, K. Q. Qiu, C. Y. Liu, F. Qi and Y. Pan, Rev. Sci. Instrum., 2014, 85, 046110 CrossRef PubMed.
- F. P. Wang, L. Chen, D. S. Geng, J. Y. Wu, J. Y. Lu and C. Wang, J. Phys. Chem. A, 2018, 122, 3971–3979 CrossRef CAS PubMed.
- O. Henric, B. Helena, B. Ulf, G. Patrick, H. Erik, J. Martin, L. Abraham, L. V. Nikolaj, P. Anna, P. Marja-Liisa, W. Niklas, V. Carin, S. Helen, K. Lars and H. Maija, Int. Annu. Conf. ICT, 2001, 32, 26 Search PubMed.
Footnote |
| † Electronic supplementary information (ESI) available. See DOI: 10.1039/d0ra03443f |
| This journal is © The Royal Society of Chemistry 2020 |

