 Open Access Article
The simultaneous removal of heavy metals and organic contaminants over a Bi2WO6/mesoporous TiO2 nanotube composite photocatalyst†
Lei Chenga,
Sijia Liua,
Guangying Hea and
Yun Hu *abc
*abc
aSchool of Environment and Energy, South China University of Technology, Guangzhou 510006, P. R. China. E-mail: huyun@scut.edu.cn; Tel: +86-020-3938-0573
bGuangdong Provincial Key Laboratory of Atmospheric Environment and Pollution Control, Guangzhou 510006, P. R. China
cThe Key Lab of Pollution Control and Ecosystem Restoration in Industry Clusters, Ministry of Education, Guangzhou 510006, P. R. China
First published on 3rd June 2020
Abstract
In this study, Bi2WO6/mesoporous TiO2 nanotube composites (BWO/TNTs) were successfully synthesized to remove the heavy metal Cr(VI) and refractory organic compound dibutyl phthalate (DBP) from contaminated water under visible light. Coupling TNTs with BWO can greatly improve the photocatalytic activity of the catalyst for treating Cr(VI)–DBP mixed pollutants because of synergetic effects from Cr(VI) and DBP. Specifically, the visible-light photocatalytic activities of 3% BWO/TNTs for removing DBP and Cr(VI) from mixed pollutant solutions were 10.8 and 3.8 times higher than those of BWO. Firstly, this system can take full advantage of charge carriers and can spatially separate reduction sites and oxidation sites in the photocatalyst. Secondly, TNTs has a unique multiscale channel structure that can enhance mass transfer and light utilization. These characteristics lead to very obvious photocatalytic activity improvements. In addition, the BWO/TNTs composite photocatalysts exhibited excellent stability and durability under visible and UV light irradiation. This work demonstrated a feasible method for fabricating composite photocatalysts and applied them to the simultaneous removal of heavy metal and refractory organic pollutants from contaminated water.
1. Introduction
Environmental pollution problems inevitably arise as a result of economic development. For water pollution problems, multi-factor combined pollution rather than single-component pollution is found in contaminated water.1 Both heavy metals (Cr, Cu, Pb, Cd, etc.) and refractory organic compounds (EDC, PAHs, etc.) have been detected in wastewater.2,3 Dibutyl phthalate (DBP) is a common endocrine disrupting chemical (EDC) that is widely present in water bodies. It is one of the main causes of reproductive system diseases, affecting the human metabolic and endocrine systems.4 Moreover, DBP is relatively stable in the natural environment and difficult to remove via traditional water treatment approaches, resulting in low removal efficiencies being shown by general technologies.5 In addition, hexavalent chromium (Cr(VI)), a heavy metal widely found in surface and ground water, exhibits high toxicity, and mutagenic and carcinogenic effects on human beings.6 The reduction of Cr(VI) to Cr(III) is a standard and effective method for treating Cr(VI) polluted water.7 Compared with single-component pollution, multi-component comprehensive pollution consisting of heavy metals and refractory organic compounds has very negative effects on the environment, and on human physiology and biochemistry.8Heavy metals and refractory organic compounds are commonly treated separately,9–11 such as through biological degradation and chemical precipitation approaches. These methods usually have some limitations, like low removal ratios, high operating costs, long duration times, etc., due to the different physicochemical properties of heavy metals and organic compounds.12 Developing an effective method for simultaneously removing heavy metals and organic compounds from wastewater is of great significance. Zhao et al.13 used a photo-electrocatalytic (PEC) system to destroy a complex of Cu-EDTA with a TiO2/Ti electrode. This involved the PEC oxidation of Cu-EDTA at the anode and the electro-deposition of Cu2+ ions at the cathode, indicating that spatially separating the oxidation active sites and reduction active sites could improve the removal efficiency. However, a bias potential had to be applied for the removal of Cu-EDTA in the PEC system, and the efficiency was quite dependent on the current density. Thus, it is important to develop a more cost-effective and high-efficiency strategy that can simultaneously remove a Cr(VI)–DBP mixed pollutant.
Due to its advantages of environmental friendliness and a high mineralization rate,14 photocatalysis is considered a promising form of technology in many areas, such as in solar cells,15 water splitting, and environmental purification.16,17 Among all the used photocatalysts, titanium dioxide (TiO2) has the advantages of high photoactivity, good stability, non-toxicity, and low cost.18 However, it is hard to neglect the photocatalytic activity limitations of TiO2, which arise from low light utilization and quantum yields. The low light utilization is caused by its absorption of a limited light region and the aggregation of particles. Via broadening the light response range, as well as increasing the reflection and refraction of light inside a TiO2 material, the light utilization can be improved. The low quantum yields are due to the rapid recombination of photogenic carriers.19 Promoting charge separation and restraining the recombination of charge carriers can increase the quantum yields of TiO2. Therefore, it is important to improve the reflection of light, broaden the light response range, and restrain the recombination of charges to promote the photocatalytic activity of TiO2.
Morphology control is one of the more effective strategies for improving the photocatalytic performance of TiO2.20 TiO2 nanoparticles are widely used for various applications, but they aggregate easily due to the small particle sizes. Therefore, one-dimensional TiO2 materials (e.g., nanowires, nanorods, nanobelts, and nanotubes) have been studied due to their unique morphologies and properties.21 Podporska-Carroll et al.22 synthesized TiO2 nanotubes via an electrochemical anodization method, and they showed enhanced antimicrobial photocatalytic disinfection properties toward E. coli and S. aureus. Mushtaq et al.23 fabricated coaxial TiO2-noble metal nanotubes filled with nickel nanowires for photocatalytic water remediation with enhanced photocatalytic activity. However, the materials mentioned above have long channels and opaque walls, preventing the diffusion of guest molecules and the reflection of light between the tubes. Weon et al.24 synthesized TiO2 nanotubes with open straight channels for the degradation of volatile organic compounds (VOCs). They demonstrated that an open channel structure is able to promote mass transfer, thereby preventing photocatalyst deactivation. Therefore, constructing mesoporous TiO2 nanotubes with multi-scale channels was put forward as an approach that combines the advantages of nanotubes and mesopores. This unique structure can transform one-dimensional materials into three-dimensional materials. Therefore, it can greatly improve the mass transfer of guest molecules, increase the number of light refraction and reflection channels available in the tubes, and expose more active sites.25
In addition, constructing a heterostructure between two semiconductors is found to be beneficial for promoting quantum yields.26–28 In particular, coupling a wide bandgap semiconductor with a narrow bandgap one could improve the quantum yields and light absorption in the visible region.29 Bismuth tungstate (Bi2WO6), with a narrow bandgap (about 2.8 eV), has attracted considerable attention due to its special physical and chemical properties, such as its unique molecular structure, high photostability and non-toxicity.30,31 Bi2WO6 consists of alternating (Bi2O2)2+ layers and perovskite-like (WO4)2− sheets,32 demonstrating its structural variability. Moreover, the bandgap of Bi2WO6 is adjustable via different synthesis methods. Therefore, Bi2WO6 is a desirable candidate material for coupling with TiO2 to improve the availability of visible light and the separation of electron–hole pairs.
In this work, Bi2WO6/mesoporous TiO2 nanotube composite photocatalysts (BWO/TNTs) were successfully synthesized by coupling BWO with TNTs, and they were prepared through a dual-templated solvothermal method. The composite catalyst showed excellent photocatalytic activity and superior stability for the synergistic removal of heavy metal and refractory organic pollution from Cr(VI)–DBP mixed solution under UV and visible light irradiation. The details and mechanism of the synergistic effect provide new ideas for the further development and application of water treatment methods.
2. Experimental section
2.1. Materials
Multi-walled carbon nanotubes (CNTs) were purchased from Shenzhen Nanotech Port Co. Ltd. Cetyltrimethylammonium bromide (CTAB, AR) was purchased from Tianjin Chemical Reagent Factory. Tetraethyl orthosilicate (TEOS, AR) and titanium butoxide (TBOT, AR) were supplied by Sinopharm Chemical Reagent Co. Ltd, Shanghai. All chemicals used in this work were of analytical grade.2.2. Fabrication of materials
2.3. Characterization
The crystalline structures of the samples were determined via X-ray diffraction (XRD) (X-ray, PANalytical) using Cu Kα emission (λ = 0.15418 nm). The 2θ scan range was from 10 to 80 degrees. The morphologies of the samples were observed via field emission scanning electron microscopy (FE-SEM) (Merlin, Zeiss). The nitrogen adsorption–desorption isotherms were measured using an automatic gas adsorption analyzer (Autosorb-IQ, Quantachrome) at 77 K. X-ray photoelectron spectroscopy (XPS) studies were performed with a Thermo Escalab 250Xi spectrometer (Thermo, USA), using a monochromatic Al Kα source. The XPS peaks were calibrated using the C 1s peak at 284.8 eV of contaminated carbon.2.4. Photoelectrochemical measurements
Photocurrent measurements were performed at room temperature using a CHI 660B electrochemical analyzer (Chengdu, China). All experiments were conducted using a standard three-electrode system consisting of a working electrode (photoelectrode), a platinum counter electrode, and an Ag/AgCl reference electrode. The electrode area is approximately 1 × 1 cm2. The electrolyte was 0.5 M Na2SO4 aqueous solution. The light source was a 300 W xenon lamp (Perfect Light, China) with a UV cut filter. The i–t curves are measured at a bias potential of −0.1 V.2.5. Photocatalytic experiments
To assess the photocatalytic activities of the prepared samples, a 300 W Xe lamp (Perfect Light, China) with a UV cut-off filter was used as a visible light source, and a 125 W high-pressure mercury lamp (Philips, USA) was used as a UV light source. The visible light intensity was 150 mW cm−2 and the ultraviolet intensity was 1.5 mW cm−2; these were measured using a UVA radiometer (Beijing Normal University Optoelectronic Instrument Factory). Cr(VI) and DBP were used as representative pollutants to assess the photocatalytic activities of the prepared samples. The photocatalytic reaction involving Cr(VI) and DBP on the catalyst was carried out in a homemade reactor. 50 mg of photocatalyst was added to a 100 mL solution containing a single contaminant (20 mg L−1 Cr(VI) or 5 mg L−1 DBP) or a contaminant mixture (20 mg L−1 Cr(VI) and 5 mg L−1 DBP). Before irradiation, the suspension was stirred in the dark for 30 min to achieve adsorption–desorption equilibrium. At a given time interval during photodegradation, 2 mL of suspension was collected and then filtered with a 0.45 nm membrane filter for analysis. The concentration of Cr(VI) was determined via a diphenylcarbazide (DPC) method, using the maximum absorption band (540 nm), with a UV-visible spectrophotometer (Thermo, USA). The DBP concentration was determined via HPLC (LC-20 at Shimadzu, Japan) with a C18 (250 × 4.6 mm, Agilent, USA) column. The mobile phase was a mixture of methanol and water (90![[thin space (1/6-em)]](https://www.rsc.org/images/entities/char_2009.gif) :
:![[thin space (1/6-em)]](https://www.rsc.org/images/entities/char_2009.gif) 10 v/v) at a flow rate of 1.0 mL min−1. The removal rate (η) was calculated via: η (%) = (1 − C/C0) × 100%, where C0 and C are the pollutant concentrations before and after the reaction, respectively.
10 v/v) at a flow rate of 1.0 mL min−1. The removal rate (η) was calculated via: η (%) = (1 − C/C0) × 100%, where C0 and C are the pollutant concentrations before and after the reaction, respectively.
3. Results and discussion
3.1. XRD analysis
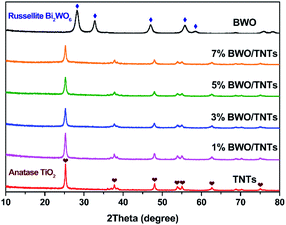
The phases and crystal structures of TNTs, x% BWO/TNTs and BWO were studied via X-ray diffraction (XRD) analysis. As shown in Fig. 1, distinct diffraction peaks of TNTs and x% BWO/TNTs could be found at 25.3°, 37.8°, 48.0°, 53.9°, 55.1° and 62.7°, and the characteristic peaks of anatase TiO2 (JCPDS no. 2-11-1272) can assign these to the (101), (004), (200), (105), (211), and (204) diffraction planes, respectively. The diffraction peaks of BWO located at 28.3°, 32.8°, 47.1°, 56.0°, and 58.5° correspond to the (131), (200), (202), (133), and (262) planes of russellite BWO (JCPDS no. 39-0256), respectively. The characteristic peaks of BWO could not be detected in the x%-BWO/TNTs composites because of the low content and high dispersion of BWO. As the BWO content increased, the intensities of the TiO2 diffraction peaks weakened gradually without obviously shifting due to the decrease of the TiO2 content and the coexistence of BWO. However, the existence of BWO did not affect the orientation of the TiO2 crystals.333.2. Morphologies
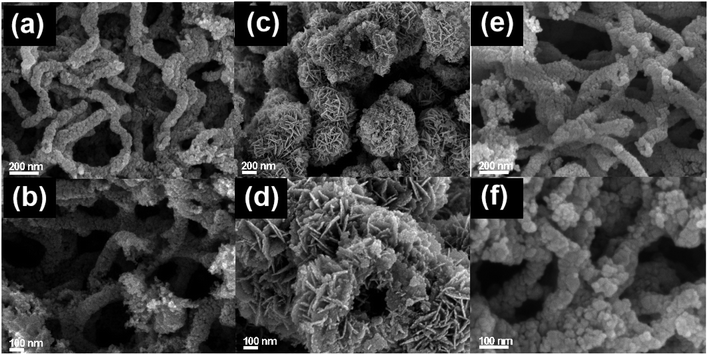
SEM was used to analyze the morphologies of the prepared samples, as shown in Fig. 2. It is observed from Fig. 2a and b that the TNTs sample has a distinct tubular structure with diameters of about 100 nm. TNTs is full of tangles and highly interconnected; this could facilitate the transport of guest molecules between the tubes. The walls of TNTs are rough and porous (Fig. 2b). It can be easily identified as a mesoporous structure formed after the removal of the soft template. As shown in Fig. 2c and d, the hierarchical hollow microspheres are composed of self-assembled BWO nanosheets. The 3% BWO/TNTs composite was composed of TNTs and BWO, which presented as identifiable nanotubes and scattered sphere fragments, respectively (Fig. 2e). This revealed that after the combination of BWO and TNTs, TNTs retained the mesoporous tube structure well (Fig. 2f). However, BWO was fragmented due to the presence of TNTs and its low content, which was consistent with the XRD analysis.3.3. BET analysis
Fig. 3 shows the N2 adsorption–desorption isotherms and corresponding BJH pore size distribution. The isotherm of TNT can be classified as type-IV with a H1-type hysteresis loop, indicating the existence of an ordered mesoporous network with a high specific surface area. The curves of BWO and 3% BWO/TNTs are type-IV isotherms with H3-type hysteresis loops, indicating the existence of fissure-like mesoporous holes.34 This is generally associated with plate-like materials, which agrees well with the existence of the self-assembled BWO nanosheet morphology (Fig. 2c and d).35 TNTs shows a narrow pore size distribution at about 2.5 nm and a wide pore size distribution at 20–60 nm; this is in good agreement with the mesopores of the walls and the openings of the tubes, respectively. However, 3% BWO/TNTs shows a wide distribution, due to the presence of BWO whose distribution is in the range of 2–30 nm. Table 1 also shows the BET specific surface area, average pore volume and pore size data from the photocatalysts. The BET specific surface area of the samples was reduced from 256.68 m2 g−1 (TNTs) to 73.99 m2 g−1 (BWO) because of the presence of BWO; the average pore volume and pore diameter of the composites increased with increasing BWO content. Coupling with TNTs, which possesses a multiple channel structure, can enlarge the surface area, pore volume and pore diameter. As a result, the mass transfer of guest molecules is promoted, the multiple reflection of light increases, and more active sites are exposed. Therefore, the BWO/TNTs composites are expected to have better interfacial reaction properties than BWO.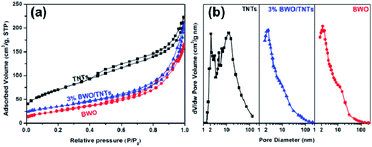 | ||
| Fig. 3 N2 adsorption–desorption isotherms (a) and pore size distributions (b) of TNTs, BWO and 3% BWO/TNTs. | ||
| Sample | SBET (m2 g−1) | Vp (cm3 g−1) | Dp (nm) |
|---|---|---|---|
| a Vp: pore volume; Dp: pore diameter. | |||
| TNTs | 256.68 | 0.34 | 5.36 |
| 1% BWO/TNTs | 97.90 | 0.24 | 12.64 |
| 3% BWO/TNTs | 97.74 | 0.27 | 14.02 |
| 5% BWO/TNTs | 95.66 | 0.34 | 17.25 |
| 7% BWO/TNTs | 92.23 | 0.33 | 18.36 |
| BWO | 73.99 | 0.24 | 10.27 |
3.4. XPS analysis
The surface compositions and chemical states of different photocatalysts were investigated via XPS analysis, as shown in Fig. 4. The binding energy of the C 1s peak at 284.8 eV was used as a reference. As shown in Fig. 4a, the XPS survey spectrum of 3% BWO/TNTs contains the characteristic peaks of Ti, O, Bi, W and C elements. This suggests that the BWO/TNTs composite was successfully synthesized through a solvothermal method. However, the characteristic peaks of the elements Bi and W cannot be clearly observed in the BWO/TNTs spectrum because of their low content. High-resolution XPS spectra of the Ti 2p peaks are shown in Fig. 4b. The XPS peaks at 458.5 and 464.2 eV can be assigned to Ti 2p3/2 and Ti 2p1/2,36 respectively, indicating the presence of Ti4+ in TNTs and BWO/TNTs. In Fig. 4c, the peak at about 529.9 eV can be assigned to O 1s, revealing the presence of O2− in TNTs, BWO and BWO/TNTs.37 The TNTs O 1s peak at 529.6 eV is attributed to Ti–O bonds.38 The BWO O 1s peak can be deconvoluted into two peaks at 530.5 and 530.1 eV, corresponding to W–O and Bi–O bonds, respectively.39 Compared with BWO and TNTs, the BWO/TNTs O 1s peak displays a slight shift toward a lower binding energy, suggesting that the electron density on BWO/TNTs is increased, therefore leading to enhanced photocatalytic activity.40,41 In Fig. 4d, Bi 4f5/2 and Bi 4f7/2 result in two XPS peaks at 164.5 and 159.2 eV, respectively, indicating the existence of Bi3+ in BWO and BWO/TNT.42 The two BWO/TNTs shoulder peaks at 162.6 and 157.3 eV can be ascribed to lower valence state Bi, which could arise from reduction by oxygen vacancies during the solvothermal process.43 The two BWO peaks at 37.5 and 35.41 eV can be assigned to W 4f5/2 and W 4f7/2 from W6+, respectively, as shown in Fig. 4e. The BWO/TNTs W 4f peak overlapped with the Ti 3p peak,44,45 which fully demonstrated the coexistence of BWO and TiO2 in the BWO/TNTs composite. Also, in Fig. 4d and e, both the Bi 4f and W 4f peaks of BWO/TNTs are offset to lower binding energies than those of BWO, which may be due to chemical bonds between BWO and TNTs, indicating that the combination of BWO and TNTs does not simply involve physical contact, but also close combination. Intimate contact between BWO and TNTs with strong chemical bonds, instead of physical contact, facilitates the transfer of charge carriers, greatly improving the photocatalytic activity of the material.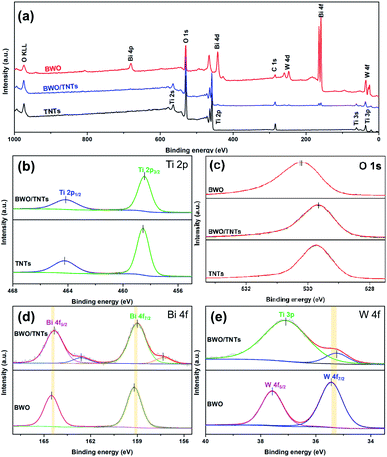 | ||
| Fig. 4 Survey (a) and high-resolution Ti 2p (b), O 1s (c), Bi 4f (d) and W 4f (e) XPS spectra for different photocatalysts. | ||
3.5. Photoelectrochemical properties
The photoelectrochemical properties of the samples were investigated, as shown in Fig. 5. The UV-vis DRS spectra of TNTs, BWO and x% BWO/TNTs are shown in Fig. 5a. The optical absorption band of the TNTs presents a steep absorption edge in the UV region. After coupling with BWO, the absorption edges of the composites show red shifts, indicating that the BWO/TNTs composites achieve a visible light response. Fig. 5b shows the bandgap values of samples, which were determined via Tauc plots from UV-vis DRS spectra data.46 The bandgaps of BWO, TNTs and BWO/TNTs are 2.80, 3.20 and 3.06 eV, respectively. Fig. 5c shows the transient photocurrent curves of TNT, BWO and 3% BWO/TNT for studying the separation efficiencies of photoinduced electron–hole pairs. Compared with TNT and BWO, the photocurrent response of 3% BWO/TNTs is the highest, most stable, and reproducible in the intermittent irradiation switching period, which means the charge carrier separation efficiency is the highest. The expected improved current response is related to the enhanced photocatalytic performance.47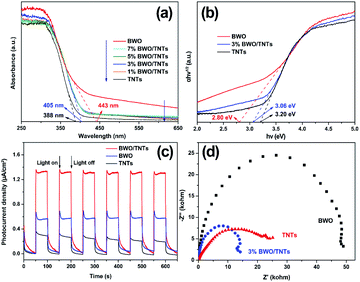 | ||
| Fig. 5 UV-vis DRS spectra (a), Tauc plots (b), transient photocurrent response curves under visible light irradiation (c), and EIS Nyquist plots (d) of the samples. | ||
In order to study the charge transfer properties and interfacial reaction capacities of the samples, EIS Nyquist plots were measured, as shown in Fig. 5d. The arc radius of 3% BWO/TNTs is much smaller than those of TNTs and BWO under dark conditions. This result confirms that the resistance of the composite is much lower than that of the other samples, indicating the high charge transfer and separation efficiency. All these photoelectrochemical properties show that the separation efficiency and interface reaction ability of charges are remarkably improved in the BWO/TNTs composites.
3.6. Photocatalytic performance
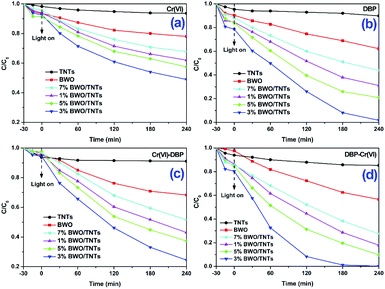
Fig. 6 shows the photocatalytic performances of different photocatalysts under visible light irradiation. Fig. 6a and b shows the visible light photocatalytic activities of TNTs, BWO and x% BWO/TNTs towards Cr(VI) and DBP in single pollutant solutions. TNTs only removed a small amount of Cr(VI) and DBP because it showed no visible light response. BWO removed only 22% Cr(VI) and 38% DBP in 4 h, while the BWO/TNTs composites greatly improved the Cr(VI) and DBP photocatalytic removal efficiencies. The highest photocatalytic activity was achieved using 3% BWO/TNTs, on which 51% Cr(VI) and 98% DBP were removed. These results show that the photocatalytic activities of the BWO/TNTs composites were enhanced, due to charge separation improvements. These results are consistent with the results from studies of the photoelectrochemical properties (Fig. 5).Fig. 6c and d exhibits the visible-light photocatalytic activities of TNTs, BWO and x% BWO/TNTs for the removal of Cr(VI) and DBP from Cr(VI)–DBP mixed pollutants. TNTs removed 9% Cr(VI) and 15% DBP via adsorption, while BWO removed 32% Cr(VI) and 43% DBP. The BWO/TNTs composites displayed enhanced photocatalytic activities for removing Cr(VI)–DBP mixed pollutants. The Cr(VI) removal efficiency increased from 32% to 76% and that of DBP increased from 43% to 100% on 3% BWO/TNTs, which showed the highest photocatalytic activities. Furthermore, the presence of DBP enhanced the removal of Cr(VI) significantly. The Cr(VI) removal rate using 3% BWO/TNTs increased from 51% to 76%. Similarly, the presence of Cr(VI) also improved the removal efficiency of DBP, which was 99% degraded within 3 h. These results indicated that Cr(VI) could be reduced by e−, while DBP could be oxidized by h+. The process can make full use of the advantages of e− and h+, effectively inhibiting recombination and thereby greatly improving the photocatalytic efficiency.48
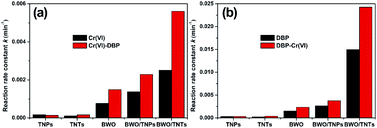
Fig. S1† shows the photocatalytic performances of the different catalysts for treating Cr(VI) and DBP single pollutant solutions and Cr(VI)–DBP mixed pollutants under visible light irradiation. As a reference sample, BWO/TNPs was prepared by coupling BWO with traditional TiO2 nanoparticles (TNPs). The composites, both BWO/TNPs and BWO/TNTs, showed remarkable enhancements in photocatalytic activity compared with TNPs, TNTs and BWO. The photocatalytic reaction rate constants (k) of the photocatalysts are summarized in Fig. 7. For the removal of Cr(VI) from Cr(VI)–DBP pollutant solution, the k values of BWO and BWO/TNTs are 1.47 × 10⁻³ and 5.61 × 10⁻³ min−1, respectively; in the case of DBP removal, the k values are 2.35 × 10⁻³ and 24.26 × 10⁻³ min−1. Accordingly, the photocatalytic activities of BWO/TNTs are 3.8 and 10.8 times higher than those of BWO for the removal of Cr(VI) and DBP, respectively.
All the catalysts showed higher photocatalytic activities in Cr(VI)–DBP mixed solution than in Cr(VI) or DBP single pollutant solutions. For the removal of Cr(VI) from Cr(VI) single pollutant solution, the k value of BWO/TNTs is 2.51 × 10⁻³ min−1, while it is 5.61 × 10⁻³ min−1 from Cr(VI)–DBP mixed solution. In the case of DBP, the values are 14.98 × 10⁻³ and 24.26 × 10⁻³ min−1, respectively. The photocatalytic efficiency of BWO/TNTs for Cr(VI) reduction in the presence of DBP is 2.2 times higher than in its absence. Similarly, the oxidation efficiency of DBP in the presence of Cr(VI) was 1.6 times higher than without Cr(VI). This enhancement demonstrated that Cr(VI) was an efficient scavenger of photogenerated electrons, while DBP was a scavenger of photogenerated holes. Thus a synergistic mechanism in Cr(VI)–DBP mixed pollutant solution can be proposed. In the photocatalytic reaction on the BWO/TNTs composites, Cr(VI) captures e− and then is reduced, and DBP captures h+ and then is oxidized. As a result, the photocatalytic reaction can make full use of the redox process and effectively inhibit the recombination of electron–hole pairs.
BWO/TNPs was used as a reference sample to study the role of the unique mesoporous TiO2 nanotubes. In a Cr(VI)–DBP mixture, the k values for removing Cr(VI) and DBP are 2.29 × 10⁻³ min−1 and 3.78 × 10⁻³ min−1, respectively. Therefore, the photocatalytic activities of BWO/TNTs for the removal of Cr(VI) and DBP were 2.5 and 6.7 times higher than those of BWO/TNPs, respectively. The photocatalytic performance of BWO/TNTs, involving the composite coupling of BWO with TNTs, was significantly enhanced. This can be ascribed to the multi-channel structure of the mesoporous TiO2 nanotubes, which can greatly enhance the mass transfer of pollutants, support the multiple reflection of light, and expose more active sites. In Cr(VI)–DBP mixed solution, under UV irradiation, Cr(VI) was photocatalytically reduced and DBP was oxidized in order to study the UV photocatalytic performance of the catalyst (Fig. S2†). The BWO/TNTs composites also show the highest photocatalytic activities, consistent with the results of visible light experiments.
To evaluate the recyclability and stability of BWO/TNTs, BWO/TNTs and BWO were reused several times in Cr(VI)–DBP mixed solutions. As shown in Fig. 8, the photocatalytic performance of BWO/TNTs showed negligible decay after six cycles. The Cr(VI) and DBP degradation efficiencies were 76% and 100% during the first cycle, and the efficiencies dropped slightly to 68% and 97% after the sixth cycle. In contrast, the photocatalytic activity of BWO greatly decreased after the first cycle, indicating that it is relatively unstable and shows poor photocatalytic activity over multiple cycles. The photocatalytic properties of the BWO/TNTs composites hardly changed, indicating that the optical absorption abilities of the catalysts after long-term photocatalytic durability experiments did not change significantly. These results showed that the BWO/TNTs composites were significantly more stable and durable than BWO.
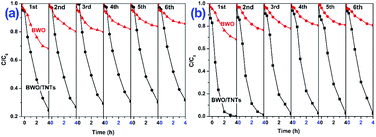 | ||
| Fig. 8 Recyclability of BWO and BWO/TNTs for the removal of (a) Cr(VI) and (b) DBP from Cr(VI)–DBP mixed pollutant solutions under visible light irradiation. | ||
The photocatalytic reduction of Cr(VI) on BWO/TNTs at different pH values from 1 to 13 was investigated, as shown in Fig. S3.† When the pH value was 10 or 13, the removal of Cr(VI) was negligible. When the pH value was lower than 7, the removal efficiency was enhanced significantly, showing that the removal of Cr(VI) is pH-dependent.49
The photocatalytic reduction performance of BWO/TNTs toward different heavy metals was studied. As shown in Fig. S4,† Cr(VI), Cu(II), and Pb(II) could be reduced. The Cr(VI) reduction efficiency was the highest due to the low reduction potential (1.33 V), while the catalyst reduced just 31% Pb(II), whose reduction potential is rather high (−0.126 V).48–50
3.7. Photocatalytic mechanism
DMPO spin-trapping ESR spectra were measured to detect free radicals in the reaction system.51 The hydroxyl radicals (·OH) and superoxide radicals (·O2−) generated by BWO/TNTs were separately detected, as shown in Fig. 9. Fig. 9 shows weak ESR signals in the dark, but significant ·OH and ·O2− response signals are seen after visible light irradiation. The signal intensities become higher as the irradiation time is prolonged, and the intensity of ·OH is much higher than that of ·O2−. This indicates that the BWO/TNTs composites can generate ·OH and ·O2−, and that ·OH makes a greater contribution than ·O2− in the reaction.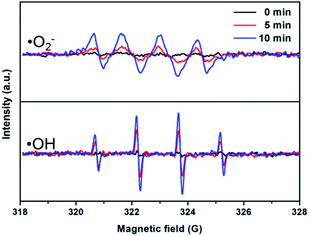 | ||
| Fig. 9 DMPO spin-trapping ESR spectra of 3% BWO/TNTs for the detection of ·OH and ·O2− under visible light irradiation. | ||
As shown in Fig. 10, the effects of free radical scavengers on DBP photocatalytic oxidation were investigated. In this case, triethanolamine (TEOA), isopropanol (IPA), and KBrO3 are used as scavengers for h+, ·OH, and ·O2−.52 The addition of TEOA led to the most obvious decline in the degradation efficiency, which indicates that h+ is the main active species. Compared with KBrO3, the activity loss caused by the addition of IPA is more obvious, indicating that ·OH is more important than ·O2− in the reaction, which is consistent with the ESR results.
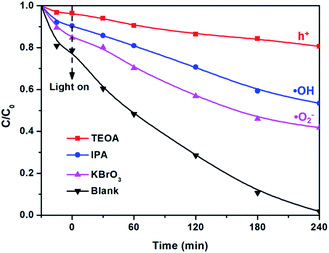 | ||
| Fig. 10 The photocatalytic degradation of DBP on 3% BWO/TNTs with the addition of different scavengers. | ||
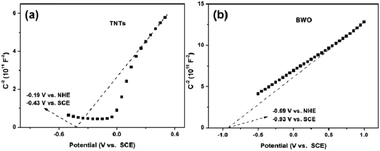
Mott–Schottky plots are used to measure the flat band potential (VFB) of a semiconductor.53 As shown in Fig. 11, the slopes of the TNT and BWO plots are positive, suggesting that they are n-type semiconductors.54 The VFB values of TNT and BWO are −0.19 and −0.69 V vs. NHE, respectively, following correction from a saturated calomel electrode (SCE) potential (0.24 V vs. NHE). The conduction band (CB) edge of an n-type semiconductor is more negative (0.1–0.2 eV) than its VFB, which is equal to the Fermi level generally.55 Therefore, the ECB values of TNT and BWO are −0.29 and −0.79 eV vs. NHE.
The states of Cr(VI) and DBP were studied during long-term photocatalytic experiments. Fig. S5† shows the removal of Cr(VI) and TOC from Cr(VI)–DBP mixed pollutant solution using the BWO/TNTs composite for 24 h under visible light irradiation. The catalyst reduced almost all Cr(VI) within 16 h, and mineralized all DBP within 12 h. It can be seen from Fig. S5a† that after 20 h, Cr(VI) is completely reduced. However, it can still be detected based on the measurements of the proportions of different chemical states present (Fig. 12) and via high-resolution XPS spectra (Fig. S7†); this is due to the presence of a small amount of Cr(VI) on the catalyst that is adsorbed and retained during the recovery of the catalyst. These results indicated that the BWO/TNTs composite is durable and effective for photocatalytic reduction and mineralization.
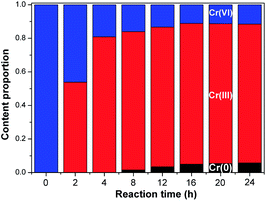 | ||
| Fig. 12 The proportions of the different chemical states of Cr present over 24 h of irradiation when using 3% BWO/TNTs. | ||
The measured XPS spectra of fresh and used BWO/TNTs are shown in Fig. S6.† An obvious Cr 2p peak can be seen in the used BWO/TNTs spectrum due to the deposition of Cr elements after the reaction. In order to study the chemical state changes of Cr elements during the photocatalytic process, catalysts were analyzed after different reaction times via high-resolution XPS spectroscopy, as shown in Fig. S7.† As shown in Fig. S7a,† Cr3+ 2p1/2 and Cr3+ 2p1/2 are assigned to the Cr 2p peaks at 577.3 and 586.8 eV, respectively. The peaks at 580.3 and 589.7 eV correspond to Cr6+ 2p3/2 and Cr6+ 2p1/2, respectively, indicating the presence of Cr(III) and Cr(VI).56,57 After 8 h of reaction, two new peaks at 573.9 and 584.5 eV appeared, belonging to Cr0 2p3/2 and Cr0 2p1/2, respectively.58–60 This indicated that an amount of Cr(III) was reduced to Cr(0) between 4 and 8 h of reaction time.
The relative amounts of different chemical states of Cr were obtained using the peak areas of the Cr 2p peaks. As shown in Fig. 12, the content of Cr(VI) decreased, while those of Cr(III) and Cr(0) increased with reaction time within 16 h. This was attributed to the photocatalytic reduction of Cr(VI) to Cr(III) and then to Cr(0). After 16 h, the relative content values of different chemical states of Cr were basically unchanged. According to the long-term experiment (Fig. S6†) results, there was not enough organic material in the solution to act as an oxidation scavenger. Therefore, the Cr deposited on BWO/TNTs achieved a balance between reduction and oxidation, which resulted in negligible changes between the different chemical states of Cr.
Based on the above results, a synergistic photocatalytic mechanism involving the BWO/TNTs composites was proposed, as shown in Scheme 2. Under visible light irradiation, photogenerated e− was excited to the CB from the VB of BWO, then e− in the CB of BWO was transported to the CB of TNTs due to the conduction band offset. Therefore, the photogenerated e− and h+ were separated spatially by the heterostructure, thus restraining the recombination of charges. Photo-generated e− arriving at TNTs can effectively reduce Cr(VI) to Cr(III), while e− on BWO can further reduce Cr(III) to Cr(0). Meanwhile, positively charged h+ can accumulate in the valence band of BWO and reach the surface, oxidizing DBP to CO2 and H2O. Hence, contaminants could also be spatially separated via using different active sites. Making full use of e− and h+ and spatially separating the reduction and oxidation of different reactants allowed the BWO/TNTs composite to synergistically remove Cr(VI) and DBP from mixed pollutants. Meanwhile, for the as-synthesized materials, hierarchical porosity composed of mesopores connected via macropores (open channels of macroporous size) could be observed from the N2 adsorption–desorption isotherms and SEM observations. In the literature, the presence of mesopores favors the multiple scattering/reflection of light, resulting in the enhanced harvesting of the excitation light and, thus, improved photocatalytic activity.61,62 In addition, hierarchical porosity composed of mesopores connected via macropores (or larger mesopores) facilitates fast mass transport, resulting in improved performance.63–67 The unique mesoporous tubular structure of TNTs could greatly facilitate the mass transfer of guest molecules, significantly improve light utilization in the interior of the tubes, and remarkably promote the exposure of active sites for reactions. Hence, the BWO/TNTs composite achieved excellent photocatalytic performance for the synergistic removal of mixed pollutants.
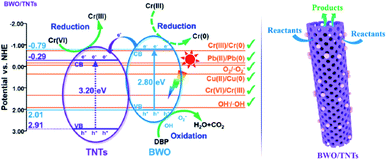 | ||
| Scheme 2 The synergistic photocatalytic mechanism for Cr(VI)–DBP mixed pollutant removal on the BWO/TNTs composite under visible light irradiation. | ||
4. Conclusions
In this work, BWO/TNTs composite photocatalysts were prepared via a one-step solvothermal method through coupling BWO with mesoporous TiO2 nanotubes. The BWO/TNTs composite showed enhanced photoelectrochemical properties, due to the heterostructure inhibiting the recombination of charges. Compared to BWO and TNTs, BWO/TNTs displayed much higher photocatalytic efficiencies for removing both heavy metal (Cr(VI)) and refractory organic (DBP) pollutants under UV and visible light irradiation. In addition, the UV photocatalytic activities of TNTs and BWO/TNTs were significantly higher than those of TiO2 nanoparticles (TNPs) and BWO/TNPs, respectively. The photocatalytic activities of BWO/TNTs for removing Cr(VI) and DBP from mixed pollutant solutions are 3.8 and 10.8 times higher, respectively, than those of BWO under visible light. The notable improvements in the photocatalytic activity can be attributed to the unique multi-channel structure of TNTs, the spatial separation of active sites, and the synergetic effect on the reactions. This work demonstrates that the designed composite photocatalyst supports a powerful strategy for treating wastewater with mixed heavy metal and organic pollutants, and it can be applied to many environmental pollution problems.Conflicts of interest
There are no conflicts to declare.Acknowledgements
This work was supported by the National Natural Science Foundation of China (21577039, 21777047), and Science and Technology Planning Project of Guangzhou City (201804020026).References
- C. Zhang, G. Zeng, D. Huang, L. Cui, C. Huang, N. Li, P. Xu, M. Cheng, Y. Zhou, W. Tang and X. He, RSC Adv., 2014, 4, 55511–55518 RSC.
- Q. Gao, Y. Li, Q. Cheng, M. Yu, B. Hu, Z. Wang and Z. Yu, Water Res., 2016, 92, 262–274 CrossRef CAS PubMed.
- M. Peng, H. Wanga, G. Han, Z. Ning, S. Jia, Y. Maa, J. Xua, L. Ying, H. Alsulamib, M. S. Alhodalyb, T. Hayatb and Y. Sun, Environ. Res., 2020, 182, 109090 CrossRef PubMed.
- X. Dong, X. Qiu, S. Meng, H. Xu, X. Wu and M. Yang, Chemosphere, 2018, 193, 313–320 CrossRef CAS PubMed.
- N. Li, D. Wang, Y. Zhou, M. Ma, J. Li and Z. Wang, Environ. Sci. Technol., 2010, 44, 6863–6868 CrossRef CAS PubMed.
- X. Wang, X. Zhu, L. Lan and H. Zuo, RSC Adv., 2016, 6, 85595–85602 RSC.
- W. Liu, J. Ni and X. Yin, Water Res., 2014, 53, 12–25 CrossRef CAS PubMed.
- J. Zhu, Z. Zhao and Y. Lu, J. Environ. Sci., 2006, 18, 1210–1215 CrossRef CAS.
- S. Zhao, J. Chen, Y. Liu, Y. Jiang, C. Jiang, Z. Yin, Y. Xiao and S. Cao, Chem. Eng. J., 2019, 367, 249–259 CrossRef CAS.
- S. Zhang, J. Yi, J. Chen, Z. Yin, T. Tang, W. Wei, S. Cao and H. Xu, Chem. Eng. J., 2020, 380, 122583 CrossRef CAS.
- E. Regulska, P. Olejnik, H. Zubyk, J. Czyrko-Horczak, M. N. Chaur, M. Tomczykowa, O. Butsyk, K. Brzezinski, L. Echegoyen and M. E. Plonska-Brzezinska, RSC Adv., 2020, 10, 10910–10920 RSC.
- Y. Li, Y. Bian, H. Qin, Y. Zhang and Z. Bian, Appl. Catal., B, 2017, 206, 293–299 CrossRef CAS.
- X. Zhao, L. Guo, B. Zhang, H. Liu and J. Qu, Environ. Sci. Technol., 2013, 47, 4480–4488 CrossRef CAS PubMed.
- Y. Zhang, W. Cui, W. An, L. Liu, Y. Liang and Y. Zhu, Appl. Catal., B, 2018, 221, 36–46 CrossRef CAS.
- J. Zhang, Y. Kusumawati and T. Pauporte, Electrochim. Acta, 2016, 201, 125–133 CrossRef CAS.
- J. Tang, J. R. Durrant and D. R. Klug, J. Am. Chem. Soc., 2008, 130, 13885–13891 CrossRef CAS PubMed.
- X. Song, Y. Hu, M. Zheng and C. Wei, Appl. Catal., B, 2016, 182, 587–597 CrossRef CAS.
- R. Miao, Z. Luo, W. Zhong, S. Chen, T. Jiang, B. Dutta, Y. Nasr, Y. Zhang and S. L. Suib, Appl. Catal., B, 2016, 189, 26–38 CrossRef CAS.
- P. Wang, Q. Zhou, Y. Xia, S. Zhan and Y. Li, Appl. Catal., B, 2018, 225, 433–444 CrossRef CAS.
- C. He, G. Chen, W. Zhang, M. Qiu, Z. Yang, X. Zhu, M. Guo and Y. Fu, RSC Adv., 2015, 5, 43630–43638 RSC.
- K. Lee, A. Mazare and P. Schmuki, Chem. Rev., 2014, 114, 9385–9454 CrossRef CAS PubMed.
- J. Podporska-Carroll, E. Panaitescu, B. Quilty, L. Wang, L. Menon and S. C. Pillai, Appl. Catal., B, 2015, 176, 70–75 CrossRef.
- F. Mushtaq, A. Asani, M. Hoop, X. Chen, D. Ahmed, B. J. Nelson and S. Pane, Adv. Funct. Mater., 2016, 26, 6995–7002 CrossRef CAS.
- S. Weon and W. Choi, Environ. Sci. Technol., 2016, 50, 2556–2563 CrossRef CAS PubMed.
- G. He, J. Zhang, Y. Hu, Z. Bai and C. Wei, Appl. Catal., B, 2019, 250, 301–312 CrossRef CAS.
- K. Qi, B. Cheng, J. Yu and W. Ho, Chin. J. Catal., 2017, 38, 1936–1955 CrossRef CAS.
- W. Shan, Y. Hu, Z. Bai, M. Zheng and C. Wei, Appl. Catal., B, 2016, 188, 1–12 CrossRef CAS.
- P. Cui, Y. Hu, M. Zheng and C. Wei, Environ. Sci. Pollut. Res., 2018, 25, 32466–32477 CrossRef CAS PubMed.
- Y. Xu, Z. Zhang and W. Zhang, Dalton Trans., 2014, 43, 3660–3668 RSC.
- J. Sheng, X. Li and Y. Xu, ACS Catal., 2014, 4, 732–737 CrossRef CAS.
- C. Zhang and Y. Zhu, Chem. Mater., 2005, 17, 3537–3545 CrossRef CAS.
- J. Tian, Y. Sang, G. Yu, H. Jiang, X. Mu and H. Liu, Adv. Mater., 2013, 25, 5075–5080 CrossRef CAS.
- J. Yang, D. Chen, Y. Zhu, Y. Zhang and Y. Zhu, Appl. Catal., B, 2017, 205, 228–237 CrossRef CAS.
- Z. Huang, Z. Wang, K. Lv, Y. Zheng and K. Deng, ACS Appl. Mater. Interfaces, 2013, 5, 8663–8669 CrossRef CAS.
- Z. Wang, K. Lv, G. Wang, K. Deng and D. Tang, Appl. Catal., B, 2010, 100, 378–385 CrossRef CAS.
- J. Yang, Y. Wang, W. Li, L. Wang, Y. Fan, W. Jiang, W. Luo, Y. Wang, B. Kong, C. Selomulya, H. K. Liu, S. X. Dou and D. Zhao, Adv. Mater., 2017, 29, 1700523 CrossRef.
- W. Ouyang, F. Teng and X. Fang, Adv. Funct. Mater., 2018, 28, 1707178 CrossRef.
- Y. Yang, G. Liu, J. T. S. Irvine and H. Cheng, Adv. Mater., 2016, 28, 5850–5856 CrossRef CAS PubMed.
- J. Jia, P. Xue, R. Wang, X. Bai, X. Hu, J. Fan and E. Liu, J. Chem. Technol. Biotechnol., 2018, 93, 2988–2999 CrossRef CAS.
- L. Yuan, B. Weng, J. C. Colmenares, Y. Sun and Y. Xu, Small, 2017, 13, 1702253 CrossRef.
- J. Low, B. Dai, T. Tong, C. Jiang and J. Yu, Adv. Mater., 2018, 1802981 Search PubMed.
- Y. Liu, B. Wei, L. Xu, H. Gao and M. Zhang, Chemcatchem, 2015, 7, 4076–4084 CrossRef CAS.
- H. Li, F. Qin, Z. Yang, X. Cui, J. Wang and L. Zhang, J. Am. Chem. Soc., 2017, 139, 3513–3521 CrossRef CAS.
- M. Vargas, D. M. Lopez, N. R. Murphy, J. T. Grant and C. V. Ramana, Appl. Surf. Sci., 2015, 353, 728–734 CrossRef CAS.
- V. I. Bukhtiyarov, Catal. Today, 2000, 56, 403–413 CrossRef CAS.
- H. Li, T. Hu, J. Liu, S. Song, N. Du, R. Zhang and W. Hou, Appl. Catal., B, 2016, 182, 431–438 CrossRef CAS.
- Y. Jia, S. Zhan, S. Ma and Q. Zhou, ACS Appl. Mater. Interfaces, 2016, 8, 6841–6851 CrossRef CAS PubMed.
- S. You, Y. Hu, X. Liu and C. Wei, Appl. Catal., B, 2018, 232, 288–298 CrossRef CAS.
- H. Ma, Y. Zhang, Q. Hu, D. Yan, Z. Yu and M. Zhai, J. Mater. Chem., 2012, 22, 5914–5916 RSC.
- X. Zhao, L. Guo and J. Qu, Chem. Eng. J., 2014, 239, 53–59 CrossRef CAS.
- Y. Zhang, W. Cui, W. An, L. Liu, Y. Liang and Y. Zhu, Appl. Catal., B, 2018, 221, 36–46 CrossRef CAS.
- H. Zhang, R. Zong, J. Zhao and Y. Zhu, Environ. Sci. Technol., 2008, 42, 3803 CrossRef CAS PubMed.
- L. Yu, X. Zhang, G. Li, Y. Cao, Y. Shao and D. Li, Appl. Catal., B, 2016, 187, 301–309 CrossRef CAS.
- M. Li, L. Zhang, X. Fan, Y. Zhou, M. Wu and J. Shi, J. Mater. Chem. A, 2015, 3, 5189–5196 RSC.
- J. Shang, W. Hao, X. Lv, T. Wang, X. Wang, Y. Du, S. Dou, T. Xie, D. Wang and J. Wang, ACS Catal., 2014, 4, 954–961 CrossRef CAS.
- Y. Bai, Y. Lu, N. Shen, T. Lau and R. J. Zeng, J. Hazard. Mater., 2018, 344, 585–592 CrossRef CAS PubMed.
- D. K. Padhi and K. Parida, J. Mater. Chem. A, 2014, 2, 10300–10312 RSC.
- M. C. Biesinger, B. P. Payne, A. P. Grosvenor, L. W. Lau, A. R. Gerson and R. S. C. Smart, Appl. Surf. Sci., 2011, 257, 2717–2730 CrossRef CAS.
- X. Wang, S. O. Pehkonen and A. K. Ray, Ind. Eng. Chem. Res., 2004, 43, 1665–1672 CrossRef CAS.
- P. Keller and H. Strehblow, Corros. Sci., 2004, 46, 1939–1952 CrossRef CAS.
- B. Fang, A. Bonakdarpour, K. Reilly, Y. Xing, F. Taghipour and D. P. Wilkinson, ACS Appl. Mater. Interfaces, 2014, 6, 15488–15498 CrossRef CAS PubMed.
- B. Fang, Y. Xing, A. Bonakdarpour, S. Zhang and D. P. Wilkinson, ACS Sustainable Chem. Eng., 2015, 3, 2381–2388 CrossRef CAS.
- B. Fang, J. H. Kim, M. S. Kim and J. Yu, Acc. Chem. Res., 2013, 46, 1397–1406 CrossRef CAS PubMed.
- B. Fang, M. S. Kim, S. Fan, J. H. Kim, D. P. Wilkinson, J. Ko and J. Yu, J. Mater. Chem., 2011, 21, 8742–8748 RSC.
- B. Fang, J. H. Kim, C. Lee and J. Yu, J. Phys. Chem. C, 2008, 112, 639–645 CrossRef CAS.
- J. H. Kim, B. Fang, M. Kim and J. Yu, Catal. Today, 2009, 146, 25–30 CrossRef CAS.
- W. Hua, X. Guo, Z. Zheng, Y. Wang, B. Zhong, B. Fang, J. Wang, S. Chou and H. Liu, J. Power Sources, 2015, 275, 200–206 CrossRef CAS.
Footnote |
| † Electronic supplementary information (ESI) available. See DOI: 10.1039/d0ra03430d |
| This journal is © The Royal Society of Chemistry 2020 |


