 Open Access Article
Preparation of activated carbon from Dipterocarpus alatus fruit and its application for methylene blue adsorption†
Chantakorn Patawata,
Ketsara Silakatea,
Somchai Chuan-Udomb,
Nontipa Supanchaiyamat c,
Andrew J. Hunt
 c and
Yuvarat Ngernyen
 *a
*a
aBiomass & Bioenergy Research Laboratory, Department of Chemical Engineering, Faculty of Engineering, Khon Kaen University, Khon Kaen, 40002, Thailand. E-mail: nyuvarat@kku.ac.th
bDepartment of Agricultural Engineering, Faculty of Engineering, Khon Kaen University, Khon Kaen, 40002, Thailand
cMaterials Chemistry Research Center, Department of Chemistry and Center of Excellence for Innovation in Chemistry, Faculty of Science, Khon Kaen University, Khon Kaen, 40002, Thailand
First published on 3rd June 2020
Abstract
Activated carbons were prepared from three parts of Dipterocarpus alatus fruit (wing, endocarp and pericarp), an abundant and renewable waste in Southeast Asia, by chemical activation using ZnCl2, FeCl3, H3PO4 and KOH and physical activation using CO2 and steam. This study indicated that activated carbon prepared from Dipterocarpus alatus fruit could be employed as a promising adsorbent for the removal of methylene blue from aqueous solution. ZnCl2 activation led to an activated carbon with a surface area of 843 m2 g−1 and was able to remove methylene blue from aqueous solution. Adsorption studies were performed and analysed using Langmuir and Freundlich isotherm equations. Adsorption data demonstrated an excellent fit with the Langmuir isotherm model, with the maximum adsorption capacity of 269.3 mg g−1 at equilibrium. Pseudo-first order and pseudo-second order kinetic models were used in this study to describe the adsorption mechanism. The results show that methylene blue adsorption is pseudo-second order, indicating that liquid film diffusion, intra-particle diffusion and surface adsorption coexisted during methylene blue adsorption on the activated carbon. The activated carbon prepared from Dipterocarpus alatus fruit is a low cost and effective adsorbent with a fast rate for the removal of methylene blue from aqueous solutions when compared with a number of activated carbons studied in the literature.
1 Introduction
An increase in the world's population has led to greater demand for various industrial products. Dyes are extensively utilised by many industries such as textiles, leather tanning, paper production, printing, food technology, plastics, hair colourings, etc.1 Up to 15% of the dye is lost in the effluent during the dyeing process, thus causing environmental problems.2 Significant numbers of dyes are considered toxic to aquatic life and stable to light, making them difficult to degrade and persistent in the environment.3 Methylene blue (MB) is a basic or cationic dye with commonly used in various applications such as colouring and dyeing cotton, wool and silk.4 MB has various harmful effects on human beings, including increased heart rate, vomiting, shock, cyanosis, jaundice, quadriplegia and tissue necrosis.5 Therefore, it is importance for dyes to be removed from wastewater to ensure local human populations and also the environment remain healthy.Various treatment methods have been used for the removal of dyes from industrial wastewater, including membrane filtration, electrochemical degradation, bioremediation, biodegradation, coagulation/flocculation, chemical precipitation, chemical oxidation, ozonation and photocatalysis.6–9 However, adsorption process is a well-established and powerful technique for treating industrial wastewater due to high efficiency, flexibility and simplicity of design, convenience of operation and low cost of appropriate adsorbent materials.6,10
Activated carbon have found use in a wide variety of applications including used as an adsorbent, electrodes for supercapacitor,11,12 catalysts,13 additives,14 synthesis of 5-hydroxymethylfurfural,15 or for bitumen modification16 to name but a few. In addition, activated carbon is amongst the most used adsorbent utilised due to its high surface area, pore volumes, fast adsorption rate and high adsorption capacity. In general, preparation of activated carbon is carried out by physical or chemical activation. Physical activation method consists of two steps; carbonisation of raw material and then activation with CO2, steam or air. Chemical activation is a single step that activation of raw material with a chemical activating agent such as ZnCl2, FeCl3, H3PO4, H2SO4, NaOH or KOH. Frequently commercial activated carbons are coal derived and are of higher cost, as such agricultural by-products and waste materials have been used as raw materials in producing activated carbons.7,17
Dipterocarpus alatus is a tropical forest tree that can grow in many countries of Southeast Asia such as Thailand, Laos, Myanmar, Vietnam and Philippines. Fruit is a winged nut of 1.5–2 cm in diameter. The wings develop from the persistent sepals that are 11–14 cm long and 1.5–2 cm wide. The colour of fruit is pink red when young, yellowish when mature and when ripe, the colour change to brown and falls from the tree. The nut compose of seed enclosed with endocarp and has pericarp at outer. Many parts of this tree had benefits such as oil is used as biodiesel, wood used in construction or bark can used as herb.18 However, the falling fruits are lignocellulosic wastes with no current method of utilisation. Importantly, to date no studies have been reported on the preparation of activated carbon from Dipterocarpus alatus fruit (DF). The use of this waste as feedstock not only leads to a range of new activated carbon materials but may also be adventurous in terms of availability and cost.
Herein, activated carbons from DF have been prepared by chemical activation with ZnCl2, FeCl3, H3PO4 and KOH and physical activation with CO2 and steam. The porous properties, chemical functionality surface morphology of the prepared activated carbons were performed by N2 adsorption, FTIR, SEM, and pHpzc. Activated carbons of DF were tested in the removal of methylene blue dye from aqueous solutions. The influence of contact time and initial concentration on the adsorption is investigated, in addition to adsorption isotherms of MB on the prepared activated carbons. The kinetic and equilibrium data of the adsorption were analysed to study mechanisms of adsorption.
2 Materials and methods
2.1 Preparation of the precursor material
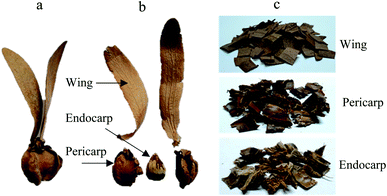
The Dipterocarpus alatus fruits (DF) used in this study were collected on the Khon Kaen University, Thailand. Fruits were separated into wing, endocarp and pericarp and then cutting into small pieces (see Fig. 1). The various parts of the DF were sieved with a 4 mm (mesh no. 5).The thermal behaviour of DF was measured with a thermogravimetric analyser (Shimadzu, TGA-50). 10 mg of sample was heated from 25 to 700 °C at a ramping rate of 10 °C min−1 under N2 atmosphere with the flow rate of 200 mL min−1.
2.2 Synthesis of activated carbons
Biomass (about 10 g) was immersed in an aqueous solution containing 30 wt% of ZnCl2, FeCl3, H3PO4 or KOH for 24 h with the impregnation ratio of biomass:chemical activator of 1![[thin space (1/6-em)]](https://www.rsc.org/images/entities/char_2009.gif) :
:![[thin space (1/6-em)]](https://www.rsc.org/images/entities/char_2009.gif) 2 by weight, followed by carbonized at 500 °C in N2 (200 mL min−1) for 1 h. The resulting activated carbons were then washed with distilled water for several times to remove residual chemical until the pH of the filtrate reaches 7. The samples were then dried at 120 °C for 6 h in an oven to obtain the activated carbons that ready to use.
2 by weight, followed by carbonized at 500 °C in N2 (200 mL min−1) for 1 h. The resulting activated carbons were then washed with distilled water for several times to remove residual chemical until the pH of the filtrate reaches 7. The samples were then dried at 120 °C for 6 h in an oven to obtain the activated carbons that ready to use.
The physically activated carbons were synthesised with a two steps process: the precursor was carbonized at 400 °C in a N2 stream (200 mL min−1) for 1 h, the resulting biochar was then activated at 850 °C in CO2 (200 mL min−1) or steam (12 mL min−1) for 1 h.
The activated carbon production yield was calculated as follows:
 | (1) |
2.3 Characterisation of activated carbon
The specific surface area and pore structure parameters of the prepared activated carbons were evaluated by N2 adsorption–desorption isotherm using a surface area and porosity analyser (ASAP2460, Micromeritics) at 77 K. The BET surface area (SBET) was calculated by the Brunauer–Emmett–Teller equation. The micropore volume (Vmic) was determined by t-plot method. The total pore volume (VT) was determined from the amount of N2 adsorbed at the relative pressure (P/Po) around 0.99. The mesopore volume (Vmeso) was calculated by subtracting Vmic from VT. The average pore diameter (DP) was calculated from the Barrett–Joyner–Halenda (BJH) method.Surface morphology of activated carbon was observed by using a scanning electron microscopy (SEM, Leo 1450 VP). A working voltage of 17 kV and the magnification of ×1000 was utilised. Surface functional groups of the activated carbon sample were detected by Fourier Transform Infrared (FTIR) spectroscopy (TENSOR 27, Bruker) using a potassium bromide (KBr) pellet. The spectrum was recorded between 4000–600 cm−1.
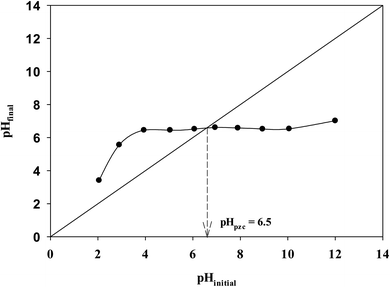
The pH at the point of zero charge (pHpzc) was determined using the pH drift method. A series of 0.01 M NaCl solutions were prepared at different initial pH between 2 to 12. Dilute solutions of 0.1 M HCl and NaOH were used for adjustment of pH values. 0.15 g of activated carbon was added to 50 mL of NaCl solution and then the sample was shaken using an orbital shaker (GALLENKAMP) at 120 rpm for 48 h. The final pH values were measured with pH meter (OHAUS, STARTER3100) and plotted against initial pH of the solution. pHpzc is determined as the point where the curve pHfinal vs. pHinitial intersects the line pHinitial = pHfinal.
2.4 Adsorption experiments
The prepared activated carbon with highest surface area was used in adsorption studies. For the adsorption kinetics experiments, the MB solution of 6.0 mg L−1 was used. MB solution of 50 mL was placed in 250 mL Erlenmeyer flask and approximately 10.0 mg of activated carbon was put into this solution. The sample was shaken with an orbital shaker (GALLENKAMP) at a constant speed of 120 rpm for the allotted contact time (10–300 min). Activated carbon and MB solutions were separated by centrifuging (Hettich ROTOFIX 32 A) at 3500 rpm for 10 min. Dye concentration in the solution was measured at 665 nm using UV-visible spectrophotometer (Analytik-Jena AG). Blank containing no dye was used as controls and a calibration curve of absorbance versus concentration was constructed.Equilibrium adsorption studies were carried out by mixing 10.0 mg of activated carbon samples with 50 mL solutions of various MB concentrations ranging from 6.0 mg L−1 to 450.0 mg L−1 without adjusting pH (between pH 6.0–6.5). Flasks were shaken until equilibrium was reached. Dilutions were made when absorbance from UV-visible spectrophotometer exceeded 1.2.
Adsorption capacity at time t (qt, mg g−1) and equilibrium adsorption capacity (qe, mg g−1) were determined by eqn. (2) and (3), respectively:
 | (2) |
 | (3) |
3 Results and discussion
3.1 Initial characterisation of DF
Table 1 presents the proximate analysis of the each part of DF. It can be observed that DF presents low ash and high volatile matter content, similar to other biomass residuals that have been reported in literature for the production of activated carbon.19–22 The fixed carbon content of DF (16.0–17.3%) is also comparable with other biomass wastes feedstock for production of activated carbon materials such as walnut shell (15.9%),23 almond tree pruning (16.0%),23 sugarcane bagasse (16.4%),24 barley straw (17.3%),19 rice-straw (17.8%),25 peach stone (17.9%),26 and paulownia wood (18.9%).22| Parameter | Method | Dipterocarpus alatus fruit | ||
|---|---|---|---|---|
| Endocarp | Pericarp | Wing | ||
| Moisture | ASTM D2867: 150 °C, 3 h | 8.3 | 8.7 | 8.1 |
| Volatile matter | ASTM D5832-98: 950 °C, 30 min | 73.0 | 72.4 | 72.1 |
| Fixed carbon | By difference | 16.0 | 16.7 | 17.3 |
| Ash | 800 °C for 2 h (ref. 27) | 2.7 | 2.2 | 2.5 |
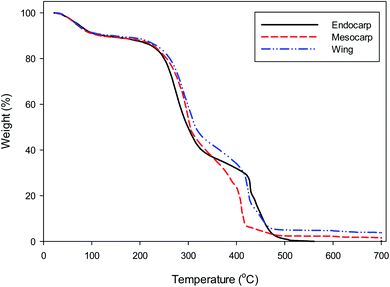
TGA analysis of the DF is presented in Fig. 2. The initial weight loss occurring between 25–200 °C could be attributed to water loss and some organic compounds. The main weight loss in the second stage from 200 to 500 °C may be associated with the thermal decomposition reaction of hemicellulose, cellulose and lignin.28,29 The final weight loss at 500–700 °C was insignificant, implying that the decomposition reactions were almost completed. Therefore, the suitable temperature for preparation of activated carbon should be at least 500 °C.
3.2 Porous properties of activated carbons
The DF activated carbons (AC) were prepared by chemical activation with ZnCl2, FeCl3, H3PO4 and KOH and physical activation with CO2 and steam. The chemically activated carbons were prepared by direct carbonised of the precursors impregnated with chemical agents. Nitrogen gas adsorption–desorption isotherms for the prepared activated carbon are shown in Fig. S1.† The types of the activating agent seem to have a significant influence on the shape of isotherms. The isotherms were of Type I and IV according to IUPAC classification, with a hysteresis loop suggesting a mixed microporous and mesoporous structure.30 The presence of hysteresis loop is associated with the capillary condensation of N2. The sample prepared from DF wings with ZnCl2 presents a maximum uptake of nitrogen.Porous characteristics of activated carbons obtained from the nitrogen gas adsorption–desorption isotherms were summarized in Table S1.† It was observed each part of DF (wing, endocarp and pericarp) and activating agent influenced the porosity of the resulting activated carbon. DF activated carbon contained both micropore and mesopore volume. According to IUPAC classification, adsorbent pores are classified into three groups: microspores (<2 nm), mesoporous (2–50 nm) and macrospores (>50 nm). As seen in the Table S1,† the average pore diameters of prepared carbons are in the range 2.05–2.90 nm. Therefore, there is a mixture of microporous and mesoporous carbon adsorbents. The maximum BET surface area was demonstrated through ZnCl2 activation of DF wing, 843 m2 g−1, micropore volume was 0.256 cm3 g−1 corresponding to 54% of total pore volume and the mesopore volume, calculated by difference, was equal to 0.217 cm3 g−1, which corresponding to 46% of total pore volume. This indicates the presence of a mixture of micropore and mesopore features within the activated carbon. The presence of mesoporous in combination with microspores is expected to play a significant role in the adsorption of large molecules of adsorbates including dye molecules.21 Therefore, this carbon was used in removal performance of MB dye from the aqueous solution. Moreover, this activated carbon demonstrated an average pore diameter of 2.24 nm. The average pore size defines the ability of the adsorbate molecules to penetrate inside the activated carbon. Thus, for the adsorbate molecules to be able to penetrate the adsorbent, the pores must have a diameter larger than the molecular diameter of the adsorbate.30 Since MB has molecular diameter of nearly 1.43 nm,4,31 the average pore size presented by this activated carbon is suitable for MB adsorption.
The yield of activated carbon from a given precursor is an important measure of the feasibility of preparation. The effects of activating agent on the yields are shown in Table S1.† The activation with ZnCl2, FeCl3, H3PO4, CO2 and steam resulted in carbon yields in the range of 30–50 wt%. On the other hand, KOH activation yield activated carbons with very low amount around 15–20 wt%.
Table 2 shows a comparison of the SBET of the highest surface area DF activated carbon with other reported values of carbons from biomass waste in literatures. According to the results, DF has surface areas consistent with other biomass waste carbons,30,32–42 thus making it a suitable candidate for use as precursor in the preparation of activated carbon. Moreover, raw material used in this study can utilise lower carbonization temperatures and short pyrolysis times when compared with the production of other activated carbons from biomass. For example, the carbonization temperature and time for 30 wt% ZnCl2 activation of almond shell, walnut shell, apricot stone and hazelnut shell were 750–850 °C and 2 h,36 respectively, while DF used 500 °C for 1 h. Carbonization of black wattle bark30 and buriti shell37 after ZnCl2 activation used temperature of 700 °C for 1 and 1.5 h, respectively. Coffee residue,34 Posidonia oceanica fibres32 and Catalpa bignonioides41 fruit used carbonization temperature of 700 °C for 1 after ZnCl2 activation. As such, the carbonisation method employed in this work leads to reduction in energy usage and cost for DF activated carbon materials.
| Precursor | Chemical Activating agent | SBET (m2 g−1) |
|---|---|---|
| Dipterocarpus alatus fruit (this study) | ZnCl2 | 843 |
| Black wattle bark30 | ZnCl2 | 415 |
| Posidonia oceanica fibres32 | ZnCl2 | 503 |
| KOH | 763 | |
| H3PO4 | 946 | |
| Coffee residue33 | H3PO4 | 696 |
| Coffee residue34 | ZnCl2 | 890 |
| Corncob35 | H3PO4 | 700 |
| Almond shell36 | ZnCl2 | 736 |
| Walnut shell36 | ZnCl2 | 774 |
| Apricot stone36 | ZnCl2 | 783 |
| Hazelnut shell36 | ZnCl2 | 793 |
| Buriti shell37 | ZnCl2 | 843 |
| Waste tea38 | CH3CO2K | 854 |
| Waste tea39 | H3PO4 | 880 |
| Sugarcane bagasse40 | H3PO4 | 873 |
| Fruit of Catalpa bignonioides41 | ZnCl2 | 896 |
| Pineapple leaf42 | ZnCl2 | 915 |
3.3 Properties of optimum activated carbon
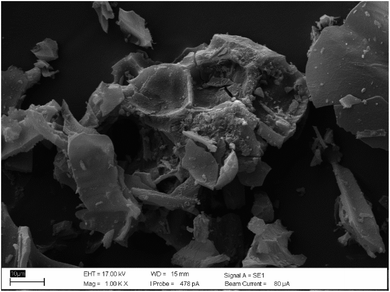
Fig. S2† demonstrates the pore size distribution as calculated by BJH method for DF wing activated carbon with ZnCl2 activation. The pore distribution is defined as the degree of heterogeneity porous within the materials and is directly related to the adsorption equilibrium and kinetics properties of activated carbons.37 It can be observed that the greatest proportion of pores are distributed in the region of 1.9–3.5 nm and fall into the range of micropore and mesopore, which is in agreement with the average pore diameter (2.24 nm). This means that this activated carbon include both micropores and mesopores. Therefore, DF wing activated carbon is suitable for adsorption of molecules smaller than 2.24 nm like methylene blue (1.43 nm).The surface morphology of ZnCl2 activated carbon was characterized by SEM. As shown in Fig. 3, irregular and porous surface activated carbon was observed. It can be deduced that activation with ZnCl2 attacks on DF wing surface caused discontinuous surface with the formation of various sized cavities, which make up distinct micropores and mesopores. On the basis of this fact, it can be suggested that this activated carbon presents an adequate morphology for methylene blue adsorption.
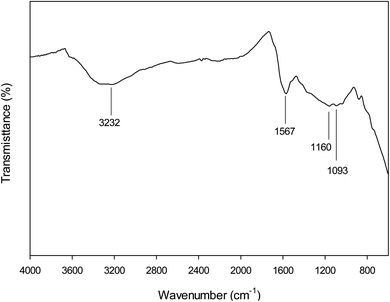
Functionality of the activated carbon surface was identified with FTIR (Fig. 4). The broad band located in the region of 3100–3400 cm−1 related to O–H stretching vibrations existed. The band located at 1567 cm−1 could be attributed to C![[double bond, length as m-dash]](https://www.rsc.org/images/entities/char_e001.gif) C vibration in aromatic rings.30 The bands at 1160 and 1093 cm−1 are attributed to C–O stretching in carboxyl acids, alcohols, phenols and esters.43 The peak observed at 1093 cm−1 can be attributed to aromatic C–H in-plane deformation.44 Importantly, spectra did not exhibit a significant number of absorption peaks, this attributed to black body nature of the carbonization DF.
C vibration in aromatic rings.30 The bands at 1160 and 1093 cm−1 are attributed to C–O stretching in carboxyl acids, alcohols, phenols and esters.43 The peak observed at 1093 cm−1 can be attributed to aromatic C–H in-plane deformation.44 Importantly, spectra did not exhibit a significant number of absorption peaks, this attributed to black body nature of the carbonization DF.
The pHpzc is defined as the pH value at which the net surface charge is zero. The plot to determine the pHpzc for ZnCl2 activated carbon is depicted in Fig. 5. The pHpzc of the optimum activated carbon is 6.5 and pHpzc < 7 shows dominant of acidic groups over basic groups.30 This indicating that this activated carbon is a more efficient adsorbent for the removal of cationic dyes, such as methylene blue. When solution pH < pHpzc, activated carbon adsorbent will act as a positive surface, while it will act as a negative surface when solution pH > pHpzc. Therefore, under low pH conditions, the electrostatic repulsion between the positively charged activated carbon surface and cationic MB dye molecules will inhibit the adsorption of MB and the presence of excess hydrogen ions may compete with MB molecules for adsorption sites. As the pH increase, the surface of activated carbon become negatively charged due to the deprotonation of the surface, which will facilitate the adsorption of MB, thus, the adsorption amount of MB increased. Foo and Hameed45 studied the effect of pH (between pH 2–12) on MB adsorption with orange peel based activated carbon with pHpzc 6.33. They found that the MB removal rose continuously with increasing pH of solution. In this current research study pH of solution was not adjusted to better mimic real applications and pH used was between 6.0–6.5. This is within the permitted pH of wastewater for the Thailand Standard, which must be in the range of 5.5–9.0, the neutral conditions were more suitable for MB removal by DF activated carbon in practical application. However, it is expect that the amount of MB adsorbed will increase when solution pH higher than 6.5. Moreover, the electrostatic interactions was not the only mechanism for MB removal, some other factors such as pore size of adsorbent also play important roles in MB removal.
The results for proximate analysis of the activated carbon sample are tabulated in Table 3. As expected, activated carbon has higher content of fixed carbon and lower content of volatile matter when compare with raw material, as previously demonstrated in Table 1, due to loss of volatiles during the carbonization process. The low volatile matter and ash content of activated carbon is best suited for industrial purpose.46 High ash content can lead to a decrease in adsorptive properties and increase hydrophilicity causing restructuring process during regeneration of used activated carbon.46 DF carbon had low ash content around 7.69 wt%, which suggests that the wing of DF used can be a good source for production of activated carbon. The similar trends of all properties have also been reported in literatures.22,47,48
| Property | Moisture | Volatile matter | Fixed carbon | Ash |
|---|---|---|---|---|
| wt% | 12.12 | 23.08 | 56.39 | 7.69 |
3.4 Methylene blue adsorption
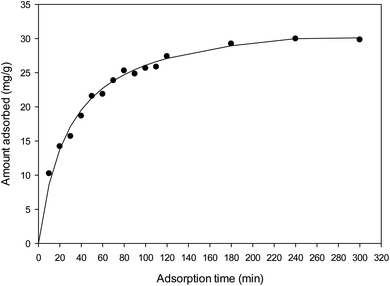
The adsorption kinetics of MB onto ZnCl2 activated carbon was investigated by pseudo-first order and pseudo-second order models. The pseudo-first order kinetic model can be written in the linear form by:
| ln(qe − qt) = lnqe − k1t | (4) |
The linear form of pseudo-second order kinetic model has the form:
 | (5) |
The effect of intra-particle diffusion resistance on adsorption can be determined by the Weber–Morris kinetics equation:
| qt = kintt1/2 + C | (6) |
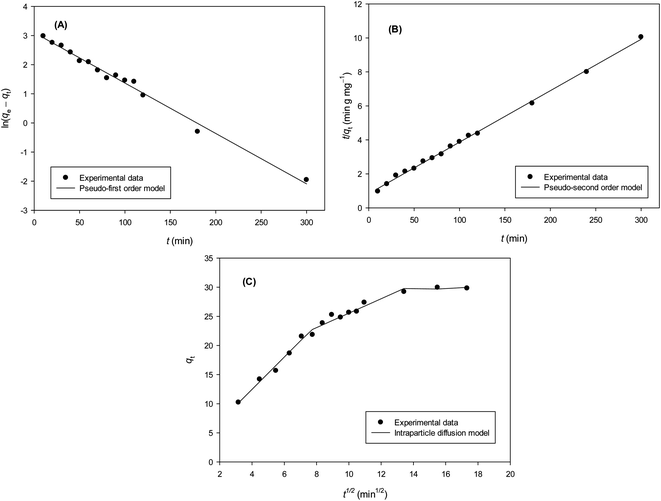 | ||
| Fig. 7 (A) Pseudo-first order, (B) pseudo-second order and (C) intraparticle diffusion kinetic models for MB adsorption onto ZnCl2 activated carbon. | ||
The rate constants and qe values for both kinetic models are given in Table 4. The feasibility of the models is dependent on the closeness of theoretical and experimental qe value and the highness of regression coefficients (R2) to unity. It was shown that high R2 values were obtained for both models but a more closeness of theoretical and experimental qe values were achieved for pseudo-second order. This indicating that MB adsorption process onto activated carbon from wing part of DF activated with ZnCl2 was better explained by pseudo-second order kinetic model. These facts suggest that the overall rate of dye adsorption process appears to be controlled by the chemisorption process involving covalent forces through sharing or exchange of electrons between surface functional groups of adsorbent and the positive charged of MB ions.17,51,52 This model also explains the external liquid film diffusion, surface adsorption and intra-particle diffusion processes coexisted during adsorption.53 This confirm by intraparticle diffusion model (Fig. 7). If the plots of qt versus t1/2 yields a straight line and pass through the origin, intraparticle diffusion is the controlling step. The linear plot in this study exhibit multi-linearity and did not pass through the origin suggesting that intraparticle diffusion was not the only rate controlling step but some other mechanism would be involved in the adsorption process.54 The first sharper linear portion is the instantaneous adsorption or external surface adsorption. The second linear portion is the gradual adsorption stage, where the intraparticle diffusion is the rate limiting. The third plateau linear portion is the final equilibrium stage where intraparticle diffusion starts to slow down due to extremely low adsorbate concentrations left in the solutions.5 Many researches also confirmed that adsorption of methylene blue by using activated carbons from lignocellulosic materials follow the pseudo-second order kinetic model.1,7,17,51,52
| qe,exp (mg g−1) | Pseudo-first order | Pseudo-second order | ||||
|---|---|---|---|---|---|---|
| qe (mg g−1) | k1 (min−1) | R2 | qe (mg g−1) | k2 (g mg−1 min−1) | R2 | |
| 29.968 | 22.151 | 0.0173 | 0.9897 | 33.003 | 1.099 × 10⁻³ | 0.9983 |
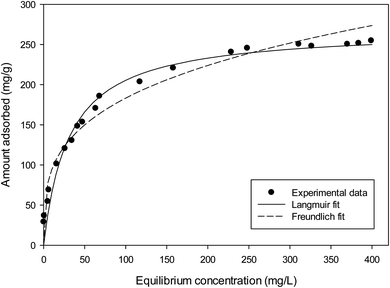
The Langmuir isotherm assumes monolayer coverage of adsorbate over a homogeneous adsorbent surface and expressed as follows:
 | (7) |
 | (8) |
The Langmuir and Freundlich adsorption isotherms are shown in Fig. 8 and the isotherm constants values were given in Table 5. It can be seen that Langmuir isotherm model fitted the experimental data better than that of the Freundlich isotherm with a high correlation coefficient (R2 = 0.991). It has been observed that the maximum adsorption capacity (qm) was found to be 269.3 mg g−1. The 1/n value from Freundlich model is 0.289 or n = 3.46, which n is greater than 1, indicating that the adsorption of MB on this activated carbon is favourable.35,39 Several reports have corroborated that MB adsorption by activated carbons from lignocellulosic materials demonstrate a strong correlation with the Langmuir isotherm equation.1,7,17,29,51
| Langmuir | Freundlich | ||||
|---|---|---|---|---|---|
| qm (mg g−1) | KL (L mg−1) | R2 | 1/n | KF ((mg g−1) (L mg−1)1/n) | R2 |
| 269.3 | 0.032 | 0.991 | 0.289 | 48.380 | 0.974 |
The maximum adsorption capacity of MB onto DF activated carbon along with that of other activated carbons, prepared from diverse biomass precursors are summarized in Table 6. Literature data was used as a basis for comparison of adsorption capacities (although they were obtained under different experimental conditions). The results in this table showed that the DF activated carbon can be effectively used for the removal of cationic dye from aqueous solution, in which its adsorption capacity is higher than many activated carbons derived from biomass waste.
| Precursor | qmax (mg g−1) |
|---|---|
| Dipterocarpus alatus fruit (wing) | 269.3 |
| Rice husk55 | 33.9 |
| Ficus carica bast51 | 47.6 |
| Coconut leaves6 | 66.0 |
| Cashew nut shell56 | 68.7 |
| Black wattle bark30 | 98.6 |
| Euphorbia rigida wood57 | 114.4 |
| Safflower seed press cake21 | 128.2 |
| Paspalum scrobiculatum (millet husk)58 | 166.3 |
| Coffee ground59 | 181.8 |
| Vigna mungo L (black gram husk)58 | 198.8 |
| Hazelnut husk7 | 204.0 |
| Cocoa shell52 | 212.8 |
| Citrullus lanatus rind (watermelon rind)8 | 259.7 |
| Coffee husk60 | 263.0 |
| Buriti shell37 | 274.6 |
| Oil palm fibre1 | 277.8 |
| Rattan sawdust17 | 294.1 |
| Fruit of Catalpa bignonioides41 | 299.4 |
The regeneration ability is also an important factor for an excellent adsorbent. After spent the activated carbon as MB adsorbents, Pathania et al.51 used 1% of HCl, H2SO4 and NaOH to studied desorption and investigated recycling efficiency. They found that NaOH was to be an efficient desorption medium and adsorption efficiency reduced to 45% from 90% after six cycles. Future work will focus on developing methods for regeneration and reuse of the adsorbents in this study.
4 Conclusions
In this work, activated carbons were prepared from three parts of Dipterocarpus alatus fruit: wing, endocarp and pericarp by chemical and physical activation for methylene blue adsorption. The properties of the activated carbons are strongly dependent on the type of activating agents. The optimal activated carbon produced from wing part by chemical activation with ZnCl2 attained maximum value of BET surface area as 843 m2 g−1. The equilibrium data of methylene blue adsorption onto optimal activated carbon followed the Langmuir isotherm model, showing the maximum monolayer adsorption capacity of 269.3 mg g−1. The rate of adsorption was determined to follow pseudo-second order kinetic model and the parameters calculated from this model are close to experimental data. The adsorption of Dipterocarpus alatus fruit activated carbon of methylene blue was better than many other activated carbons made from biomass wastes in the view of adsorption capacity and rate of adsorption. Consequently, Dipterocarpus alatus fruit activated carbon can be used as a low cost adsorbent for solving many environmental pollution problems and other applications.Conflicts of interest
There are no conflicts of interest to declare.Acknowledgements
This study was funded by Research and Academic Services Affairs of Khon Kaen University under Yang Na Scholarship.References
- I. A. W. Tan, B. H. Hameed and A. L. Ahmad, Chem. Eng. J., 2007, 127, 111 CrossRef CAS.
- R. Kant, Nat. Sci., 2012, 4, 22 CAS.
- H. Du, J. Cheng, M. Wang, M. Tian, X. Yang and Q. Wang, Diam. Relat. Mater., 2020, 102, 107646 CrossRef.
- A. M. M. Vargas, A. L. Cazetta, M. H. Kunita, T. L. Silva and V. C. Almeida, Chem. Eng. J., 2011, 168, 722 CrossRef CAS.
- S. K. Theydan and M. J. Ahmed, J. Anal. Appl. Pyrolysis, 2012, 97, 116 CrossRef CAS.
- R. A. Rashid, A. H. Jawad, M. A. B. M. Ishak and N. N. Kasim, Sains Malays., 2018, 47, 603 CrossRef.
- C. Ozer, M. Imamoglu, Y. Turhan and F. Boysan, Toxicol. Environ. Chem., 2012, 94, 1283 CrossRef CAS.
- Y. Lina, S. Wua, X. Li, X. Wu, C. Yang, G. Zenga, Y. Penga, Q. Zhoua and L. Lub, Appl. Catal., B, 2018, 227, 557 CrossRef.
- X. Inthapanya, S. Wu, Z. Han, G. Zeng, M. Wu and C. Yang, Environ. Sci. Pollut. Res. Int., 2019, 26, 5944 CrossRef CAS.
- O. Üner, Ü. Geçgel and Y. Bayrak, Water, Air, Soil Pollut., 2016, 227, 247 CrossRef.
- G. Ma, D. Guo, K. Sun, H. Peng, Q. Yang, X. Zhou, X. Zhao and Z. Lei, RSC Adv., 2015, 5, 64704 RSC.
- Z. Peng, Z. Guo, W. Chu and M. Wei, RSC Adv., 2016, 6, 42019 RSC.
- E. Saputra, S. Muhammad, H. Sun and S. Wang, RSC Adv., 2013, 3, 21905 RSC.
- M. Rasapoor, B. Young, A. Asadov, R. Brar, A. K. Sarmah, W.-Q. Zhuang and S. Baroutian, Energy Convers. Manage., 2020, 203, 112221 CrossRef CAS.
- Y. Nishimura, M. Suda, M. Kuroha, H. Kobayashi, K. Nakajima and A. Fukuoka, Carbohydr. Res., 2019, 486, 107826 CrossRef PubMed.
- E. S. Seyrek, E. Yalçin, M. Yilmaz, B. V. Kök and H. Arslanoglu, Constr. Build. Mater., 2020, 240, 117921 CrossRef.
- B. H. Hameed, A. L. Ahmad and K. N. A. Latiff, Dyes Pigments, 2007, 75, 143 CrossRef CAS.
- C. Suiuay, S. Sudajan, S. Katekaew, K. Senawong and K. Laloon, Energy, 2019, 187, 115967 CrossRef CAS.
- J. Pallarés, A. González-Cencerrado and I. Arauzo, Biomass Bioenergy, 2018, 115, 64 CrossRef.
- H. Demiral and C. Güngör, J. Clean. Prod., 2016, 124, 103 CrossRef CAS.
- D. Angın, E. Altintig and T. E. Köse, Bioresour. Technol., 2013, 148, 542 CrossRef PubMed.
- S. Yorgun and D. Yildiz, J. Taiwan Inst. Chem. Eng., 2015, 53, 122 CrossRef CAS.
- J. F. González, S. Román, J. M. Encinar and G. Martínez, J. Anal. Appl. Pyrolysis, 2009, 85, 134 CrossRef.
- H. Darmstadt, M. Garcia-Perez, A. Chaala, N. Z. Cao and C. Roy, Carbon, 2001, 39, 815 CrossRef CAS.
- G. H. Oh and C. R. Park, Fuel, 2002, 81, 327 CrossRef CAS.
- T. Uysal, G. Duman, Y. Onal, I. Yasa and J. Yanik, J. Anal. Appl. Pyrolysis, 2014, 108, 47 CrossRef CAS.
- A. Aygün, S. Yenisoy-Karakaş and I. Duman, Microporous Mesoporous Mater., 2003, 66, 189 CrossRef.
- A. Heidari and H. Younesi, J. Taiwan Inst. Chem. Eng., 2014, 45, 579 CrossRef CAS.
- K. Fu, Q. Yue, B. Gao, S. Yuanyuan and Z. Liujia, Chem. Eng. J., 2013, 228, 1074 CrossRef CAS.
- S. F. Lütke, A. V. Igansi, L. Pegoraro, G. L. Dotto, L. A. A. Pinto and T. R. S. Cadaval Jr, J. Environ. Chem. Eng., 2019, 7, 103396 CrossRef.
- Water Pollution X, ed. A. M. Marinov and C. A. Brebbia, WIT Press, 2010, p. 345 Search PubMed.
- M. C. Ncibi, R. Ranguin, M. J. Pintor, V. Jeanne-Rose, M. Sillanpää and S. Gaspard, J. Anal. Appl. Pyrolysis, 2014, 109, 205 CrossRef CAS.
- N. F. Tehrani, J. S. Aznar and Y. Kiros, J. Clean. Prod., 2015, 91, 64 CrossRef CAS.
- F. Boudrahem, F. Aissani-Benissad and H. Aït-Amar, J. Environ. Manage., 2009, 90, 3031 CrossRef CAS PubMed.
- G. O. El-Sayed, M. M. Yehia and A. A. Asaad, Water Resour. Data Indiana, 2014, 7–8, 66 CrossRef.
- A. Aygün, S. Yenisoy-Karakaş and I. Duman, Microporous Mesoporous Mater., 2003, 66, 189 CrossRef.
- O. Pezoti Jr, A. L. Cazetta, I. P. A. F. Souza, K. C. Bedin, A. C. Martins, T. L. Silva and V. C. Almeida, J. Ind. Eng. Chem., 2914, 20, 4401 CrossRef.
- M. Auta and B. H. Hameed, Chem. Eng. J., 2011, 175, 233 CrossRef CAS.
- Y. Kan, Q. Yue, D. Li, Y. Wu and B. Gao, J. Taiwan Inst. Chem. Eng., 2017, 71, 494 CrossRef CAS.
- Y. Guo, C. Tan, J. Sun, W. Li, J. Zhang and C. Zhao, Chem. Eng. J., 2020, 381, 122736 CrossRef CAS.
- Ü. Geçel, B. Kocabıyık and O. Üner, Water, Air, Soil Pollut., 2015, 226 Search PubMed.
- M. N. Mahamad, M. A. A. Zaini and Z. A. Zakaria, Int. Biodeterior. Biodegrad., 2015, 102, 274 CrossRef CAS.
- H. Sayğılı and F. Güzel, J. Clean. Prod., 2016, 113, 995 CrossRef.
- E. Yagmur, Y. Gokce, S. Tekin, N. I. Semerci and Z. Aktas, Fuel, 2020, 267, 117232 CrossRef CAS.
- K. Y. Foo and B. H. Hameed, Bioresour. Technol., 2012, 104, 679 CrossRef CAS PubMed.
- D. Kibami, C. Pongener, K. S. Rao and D. Sinha, Chem. Sin., 2014, 5, 46 Search PubMed.
- A. R. Hidayua, N. F. Mohamad, S. Matali and A. S. A. K. Sharifah, Procedia Eng., 2013, 68, 379 CrossRef.
- N. K. E. M. Yahaya, M. F. P. M. Latiff, I. Abustan, O. S. Bello and M. A. Ahmad, Int. J. Comput. Sci. Eng. Technol., 2011, 11, 164 Search PubMed.
- S. Senthilkumaar, P. R. Varadarajan, K. Porkodi and C. V. Subbhuraam, J. Colloid Interface Sci., 2005, 284, 78 CrossRef CAS.
- B. H. Hameed, A. T. M. Din and A. L. Ahmad, J. Hazard. Mater., 2007, 141, 819 CrossRef CAS PubMed.
- D. Pathania, S. Sharma and P. Singh, Arab. J. Chem., 2017, 10, S1445 CrossRef CAS.
- F. Ahmad, W. M. A. W. Daud, M. A. Ahmad and R. Radzi, Chem. Eng. Res. Des., 2012, 90, 1480 CrossRef CAS.
- S. Fan, Y. Wang, Z. Wang, J. Tang and X. Li, J. Environ. Chem. Eng., 2017, 5, 601 CrossRef CAS.
- J. Pang, F. Fu, Z. Ding, J. Lu, N. Li and B. Tang, J. Taiwan Inst. Chem. Eng., 2017, 77, 168 CrossRef CAS.
- A. Dorothy and A. S. Mideen, J. Chem. Pharm. Res., 2015, 7, 761 CAS.
- P. S. Kumar, S. Ramalingam and K. Sathishkumar, Korean J. Chem. Eng., 2011, 28, 149 CrossRef CAS.
- Ö. Gerçel, A. Özcan, A. S. Özcan and H. F. Gerçel, Appl. Surf. Sci., 2007, 253, 4843 CrossRef.
- S. Valliammai, Y. Subbareddy, K. S. Nagaraja and B. Jeyaraj, Indian J. Chem. Technol., 2017, 24, 134 CAS.
- A. Reffas, V. Bernardet, B. David, L. Reinert, M. B. Lehocine, M. Dubois, N. Batisse and L. Duclaux, J. Hazard. Mater., 2010, 175, 779 CrossRef CAS PubMed.
- L. C. A. Oliveira, E. Pereira, I. R. Guimaraes, A. Vallone, M. Pereira, J. P. Mesquita and K. Sapag, J. Hazard. Mater., 2009, 165, 87 CrossRef CAS PubMed.
Footnote |
| † Electronic supplementary information (ESI) available. See DOI: 10.1039/d0ra03427d |
| This journal is © The Royal Society of Chemistry 2020 |

