 Open Access Article
Dispersion stability and tribological properties of additives introduced by ultrasonic and microwave assisted ball milling in oil
Siyuan Wang a,
Ding Chen
 *ab,
Yaotong Chenb and
Kaiji Zhua
aState Key Laboratory of Advanced Design and Manufacturing for Vehicle Body, Hunan University, 410082 Changsha, China. E-mail: chending@hnu.edu.cn
bCollege of Materials Science and Engineering, Hunan University, 410082 Changsha, China
First published on 2nd July 2020
Abstract
Graphene and MoS2 were modified by organic molecules to obtain modified reduced graphene oxide (MRGO) and modified molybdenum disulfide (MMD) powders. MRGO and MMD were uniformly dispersed in base oil (PAO6) by ultrasonic and microwave assisted ball milling (UMBM). This study tested the dispersion stability and tribological properties of additives in the oil, and analyzed the elements of the friction surface. Besides, the mechanism of anti-friction and anti-wear was discussed. The results show that the UMBM method is an effective way to introduce additives in lubricating oil. Compared with direct addition, it can effectively improve the dispersion stability of additives in the oil, so that additives can be better deposited and adsorbed on the friction surface in the friction process, and improve the tribological properties of lubricating oil.
1 Introduction
Lubricants can significantly reduce the wear and prolong the service life of machines. It has been found that the introduction of additives can further improve the performance of lubricating oil and meet the strict requirements, such as high temperature, high speed, high load, and other working conditions.1–3Graphene is a two-dimensional structure with sp2 hybridization, which enjoys exceptional thermal and chemical stability. Besides, due to its extremely thin-layered structure and self-lubricity, researchers are increasingly interested in its application as a lubricant additive.4,5 Zhang et al.6 modified graphene with oleic acid to obtain graphene sheets with great lipophilicity, and confirmed the reduced friction effect of graphene on the lubricating oil by a four-ball friction tester. Eswaraiah et al.7 prepared the graphene-based engine oil nanofluids, and verified that the introduction of graphene can reduce the friction characteristics, anti-wear and extreme pressure of lubricating oil.
MoS2 has a hexagonal layered structure, determines its great lubricating properties.8 As a lubricant, it enjoys many advantages in terms of wear resistance, adhesion, compressive strength, friction factor,9,10 etc. Therefore, MoS2 is widely used as lubricating additives. Hu et al.11 used the ring block friction meter, XPS and SEM to analyze the friction properties of MoS2 lubricating oil. The results showed that the introduction of MoS2 could form an anti-wear film on the friction surface and improved wear resistance. Onodera et al.12 simulated the monolithic MoS2 by computational chemistry, and they proposed that the excellent tribological properties of MoS2 were attributed to the increase in Coulomb repulsive potential between the two sulfur layers that react with the iron surface.
Because of the synergistic effect of many kinds of additives, compound additives enjoys a more excellent lubrication effect. Gong et al.13 deposited nanosized MoS2 on graphene (MoS2/Gr) as an additive in polyalkylene glycol (PAG) for steel/steel contact. Experiment results indicated that MoS2/Gr suspended in PAG exhibited a substantial reduction in friction and wear at elevated temperature.
At present, researchers pay less attention to the introduction method of additives, although researchers have made lots of achievements in the selection of additives, the best additives content, and the friction reduction mechanism of additives. It has been reported that the introduction of graphene and MoS2 can greatly improve the tribological properties of lubricating oil. However, because of the strong π–π interaction between graphene layers, graphene is easy to agglomerate. The same phenomenon also occurs in MoS2, the interaction between ultra-fine MoS2 particles, and MoS2 with poor suspension in oil. Both of these factors make MoS2 is difficult to achieve long-term and stable dispersion in the solvent. While in the actual working process, the adverse dispersion of additives will cause agglomeration and precipitation, which will have an adverse impact on the friction system. In the previous work, the researchers mainly functionalized graphene to change their hydrophilicity and improve its affinity to organic solvents. Lin et al.14 successfully functionalized GO with isocyanate groups, producing hydrophobic, functionalized GO from the highly hydrophilic GO. Similarly, Price et al.15 grafted N-pentyl and t-butyl groups onto GO in a one-pot functionalization. Subsequently, they tested the dispersibility of GO in various solvents. The result showed that functionalized GO had distinct affinities for organic solvents.
However, many of the present methods require long reaction times, extreme conditions, or the use of expensive reagents. It is important to find a new method that can make additives achieve stable dispersion in lubrication oil. Ultrasound has cavitation, thermal and mechanical effects.16–18 Ultrasound can generate energy, which can accelerate the fragmentation and dispersion of particles.19 Besides, under the action of ultrasound, it can promote the occurrence of chemical reactions and accelerate the reaction rate.20 Due to its unique and environmentally friendly characteristics, in recent years, ultrasound has been widely used. Microwave can directly act on the chemical system to promote or change various chemical reactions,21 because the microwave can cause the vibration of molecules, molecules rub against each other to generate high temperature or decrease of activation energy of reactions. In recent years, microwaves have been gradually applied in the fields of chemistry, oil refining, and met allurgy.22 Microwave chemistry has become a very active and innovative branch of chemistry. In recent years, some research results of our group have confirmed that there is a synergistic effect between ultrasound/microwave and mechanical force, which can disperse the nanoparticles, promote and accelerate the occurrence of the reaction.23,24
The stable dispersion resistance of additives in lubricating oil mainly comes from two aspects: lipophilicity and suspensibility of additives. Here, in order to improve the dispersion of additives, starting from these two points, the additives were first modified for lipophilicity, and then the additives were introduced into the lubricating oil by ultrasound and microwave assisted ball milling. At the same time, the effect of this method on the dispersion and tribological properties of additives in lubricating oil was studied.
2 Experiment
2.1 Materials
The lamellar diameter of graphene oxide powder is 0.5–5 μm, and the particle size of MoS2 powder is 3–5 μm; hydrazine hydrate, 1-naphthoic acid, oleic acid, cetyltrimethylammonium bromide, stearic acid, acetone, and anhydrous ethanol are analytically pure. The base oil PAO6 is industrial grade.2.2 Preparation of lubricant oil
Step 1: Graphene oxide (GO) was dispersed in NaOH solution with pH 10–11, after 1 h ultrasound (40 Hz), hydrazine hydrate was added and the reduced graphene oxide mixture was obtained after 2 hours of the water bath. Dispersion by 1 h ultrasonic (40 Hz) and then centrifuged for 10 min (rotate speed R = 7000 rpm). Finally, the reduced graphene oxide (RGO) with hydroxyl and carboxyl groups was obtained by washing and drying the dispersion.Step 2: Oleic acid (OA) was heated to 80 °C in a water bath, stearic acid (SA) and cetyltrimethylammonium bromide (CTAB) were fully dissolved, and treated by ultrasonic for 1 hour. Then the RGO powder obtained in step 1 was added to the mixture. Stir at 80 °C for 1 h, then cool to room temperature. In order to remove the residual organic matter, the sample was centrifuged, washed with anhydrous ethanol and acetone for 3 times, and then dried in vacuum to obtain modified reduced graphene oxide (MRGO).
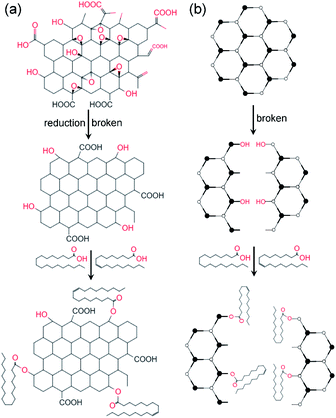
The modified molybdenum disulfide (MMD) was obtained by replacing RGO with MoS2. The modification process is shown in Fig. 1.
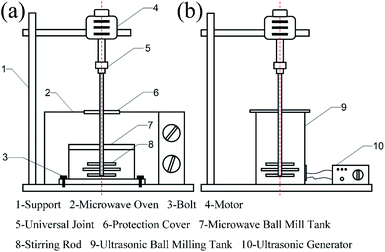
Step 3: The MRGO and MMD powder obtained in step 2, steel ball and base oil (PAO6) were added to the ultrasonic ball milling tank. After 5 h, the mixed liquid was added to the microwave ball milling tank, and the zirconia ball was added. After 3 h, the lubricant oil was obtained. Microwave ball milling and ultrasonic ball milling devices are shown in Fig. 2.
As a contrast, the powder obtained in step 2 was directly mixed with the base oil to obtain the lubricant oil without ultrasonic and microwave ball milling (no UMBM).
2.3 Characterization of lubricating additives and friction surface
The additives were characterized by X-ray diffractometer (XRD), scanning electron microscope (SEM), transmission electron microscope (TEM), Fourier transform infrared spectroscopy (FT-IR) and Raman spectroscopy. After the four-ball friction test, the friction surface was observed and analyzed by SEM, Raman spectrometer, X-ray energy dispersive spectrometer (EDS) and X-ray photoelectron spectrometer (XPS).2.4 Dispersion stability test
The dispersion stability of additives in lubricating oil was measured by ultraviolet-visible spectrophotometer (UV-Vis) and zeta potentiometer.Firstly, the lubricating oil was diluted 50 times, then precipitated by 2000 rpm centrifugation, and the supernatant was taken at the interval of 20 min. The absorbance of the supernatant was evaluated by UV-vis spectrophotometer, according to Lambert–Beer's law, the absorbance is proportional to the concentration. Therefore, according to the ratio of the particle concentration to the initial concentration of the suspension at each time point, the relative concentration can be calculated. A relative concentration of 1.0 indicates that there is no particle deposition in the lubricant solution and the dispersion stability is excellent.
The zeta potential of the sample was measured by the zeta potentiometer. The larger the absolute value of zeta potential is, the better the dispersion is. The threshold defined by colloid sedimentation theory is 30 mV, so when the absolute value of zeta potential exceeds 30 mV, it means that the particles in the dispersion have sufficient mutual repulsion to ensure their stability.
2.5 Tribological properties test
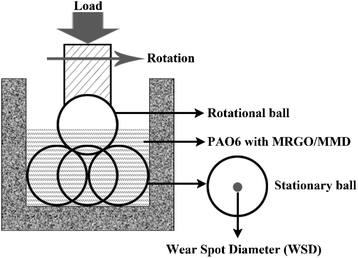
The tribological properties of MRGO/MMD lubricating oil were studied by the four-ball friction tester. The friction tests of PAO6 and the lubricating oil were carried out under 392 N constant load and 1200 rpm, each test was repeated three times. The average friction coefficient (AFC) was collected and calculated automatically by the control system of the equipment. The wear spot diameter (WSD) of the stationary ball was the average of the three specimens. The accuracy of WSD measured by an optical microscope is ±0.01 mm. The detailed diagram of the tribological test is shown in Fig. 3.3 Results and discussion
3.1 Characterization of additives
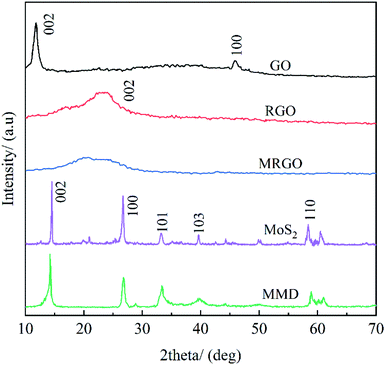
Fig. 4 show the XRD diagram of GO, RGO, MRGO, MoS2, and MMD. After reduced, a mild diffraction peak appears at 2θ ≈ 26.7° in the RGO curve. This shows that GO has been completely reduced.25 Compared with the diffraction peak of the (002) crystal plane of RGO and MRGO, the diffraction peak shifts slightly to the left and the diffraction intensity is weakened, according to the Bragg equation, it indicating that the distance between the crystal planes is reduced, this is because the organic molecules are wrapped in the surface of graphene, and some of the carboxyl groups on the surface are linked by carbon branches, which hinders the aggregation of graphene lamellar due to π–π bond interaction.It can be seen that MoS2 is a relatively pure layered 2H-MoS2.26 After modified by OA, SA, and CTAB, the characteristic peak intensity of MMD decreases and the peak shape tends to be amorphous, which is attributed to the introduction of organic molecules.
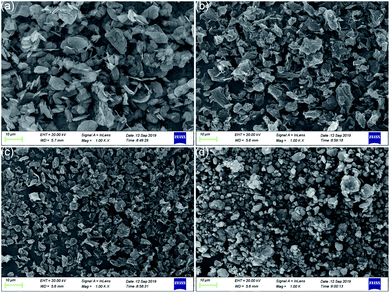
Fig. 5 shows the SEM images of graphene and MoS2. It can be seen that the dispersion of MRGO is better. And compared with the sharp edge of RGO, the edge shape of MRGO is smoother, which is due to the wrapping of organic molecules, indicating that the wettability and dispersion of additives have been greatly improved. Similarly, due to the coating of organic molecules, the surface of MMD particles is rounder and smoother than MoS2. And MMD particles show a better dispersion state.
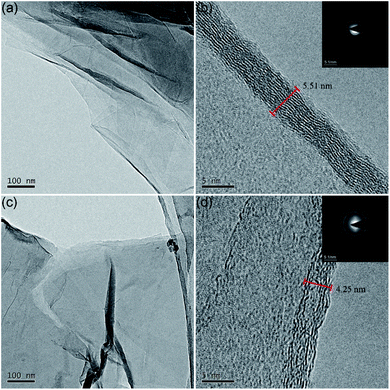
Fig. 6 is the TEM image of RGO and MRGO. It can be seen that there are more layers of RGO stacked together, while the number of layers of MRGO is significantly reduced. This reason is the organic molecules are inserted into the layers of graphene, which increases the interlayer spacing of graphene and effectively improves the dispersibility.
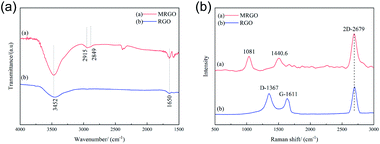
Fig. 7(a) shows the FTIR images of RGO and MRGO. RGO peaked at 1650 and 3452 cm−1, which refers to the C![[double bond, length as m-dash]](https://www.rsc.org/images/entities/char_e001.gif) C bond and the –OH bond, respectively. After modified with organic molecules, both of the peaks are enhanced, which may be due to the adsorption of organic molecules on RGO. And there are two new peaks at 2849 and 2915 cm−1, which is due to the scaling mode of CH3 and CH2. All these indicate that OA, SA, and CTAB have modified the surface of RGO. Similarly, Fig. 7(b) shows the Raman spectra of RGO and MRGO, it can clearly see that the G and G′ (2D) bands of RGO are observed at about 1611 cm−1 and 2679 cm−1, respectively. And the G band of RGO disappeared after modifying with the organic molecules, and two new peaks at 1440.6 cm−1 and 1081 cm−1 corresponding to CH3 and CH2 modes are observed. It is further confirmed that the MRGO was coated by organic molecules.
C bond and the –OH bond, respectively. After modified with organic molecules, both of the peaks are enhanced, which may be due to the adsorption of organic molecules on RGO. And there are two new peaks at 2849 and 2915 cm−1, which is due to the scaling mode of CH3 and CH2. All these indicate that OA, SA, and CTAB have modified the surface of RGO. Similarly, Fig. 7(b) shows the Raman spectra of RGO and MRGO, it can clearly see that the G and G′ (2D) bands of RGO are observed at about 1611 cm−1 and 2679 cm−1, respectively. And the G band of RGO disappeared after modifying with the organic molecules, and two new peaks at 1440.6 cm−1 and 1081 cm−1 corresponding to CH3 and CH2 modes are observed. It is further confirmed that the MRGO was coated by organic molecules.
3.2 Dispersion of additives in oil
The dispersion stability of MRGO and MMD in PAO6 was investigated by UV-vis spectrophotometer and zeta potentiometer. The additives content in lubricating oil is 0.2 wt% (WtMRGO![[thin space (1/6-em)]](https://www.rsc.org/images/entities/char_2009.gif) :
:![[thin space (1/6-em)]](https://www.rsc.org/images/entities/char_2009.gif) WtMMD = 5
WtMMD = 5![[thin space (1/6-em)]](https://www.rsc.org/images/entities/char_2009.gif) :
:![[thin space (1/6-em)]](https://www.rsc.org/images/entities/char_2009.gif) 5).
5).
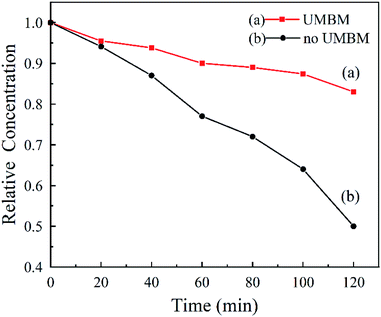
Fig. 8 shows that the dispersion stability of MRGO and MMD in PAO6. It was measured by UV-vis spectrophotometry, and the dispersion stability is evaluated by measuring the settling velocity of additives particles. Under the action of centrifugal force, it can be seen that the MRGO and MMD particles without UMBM treatment settle rapidly, and their relative concentration is only 50% after 120 min. However, the dispersion stability is much better of which additives are introduced in oil by UMBM, and the settling rate is slower, the relative concentration is about 83% after 120 min.
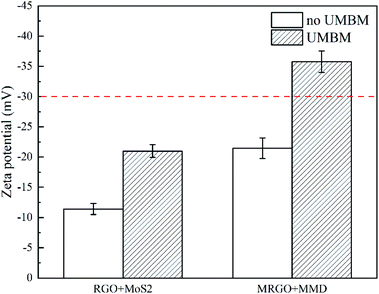
Fig. 9 shows the zeta potential of RGO/MoS2 and MRGO/MMD in PAO6. It can be seen that whether the organic molecular modification or UMBM treatment can improve the dispersion of additives. However, the zeta potential value can not exceed the sedimentation threshold value of −30 mV by one method. Only when the two-act together, it can achieve the best dispersion of additives. The zeta potential of MRGO/MMD additives is −35.78 mV, indicating that the dispersion is extremely stable, and there is sufficient repulsion between the particles to maintain the dispersion.27
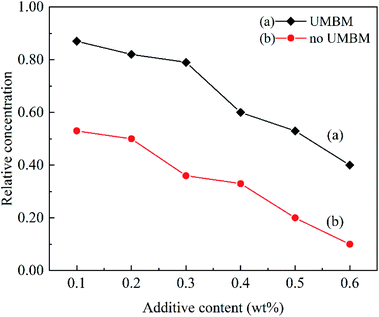
In order to study the effect of additives concentration on dispersion stability. Fig. 10 shows the relative concentration of the supernatant after centrifugation at different additives concentrations. It can be seen that when the additives were introduced in PAO6 by UMBM treatment, and the additives content is less than 0.3 wt%, the relative concentration of the supernatant only decreases slightly with the increasing of additives content. However, when the content of additives continued to increase, the concentration of supernatant decreased sharply. For the additives were introduced in PAO6 without UMBM treatment, the value is 0.2 wt%.
The results show that UMBM treatment could play a beneficial role to improve the dispersion of additives in lubricating oil. When the additives are added to the base oil, the additives powder is affected by ultrasound to further disaggregate and disperse.28 At the same time, it is further refined and crushed by the strong shear force and extrusion force of the grinding ball.19 Microwave can produce energy,23,29 combined with the mechanical force of ball milling,24,30 the surface of the additives is well wetted, to realize the great dispersion of the additives in the oil.
3.3 Tribological performances of the lubricating oil
This part investigated the effects of different contents of additives and UMBM treatment on the tribological properties of lubricating oil.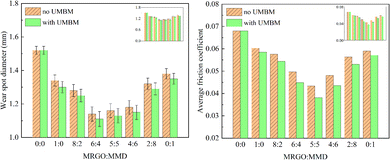 | ||
| Fig. 11 Wear spot diameter and average friction coefficient of lubricating oil with different ratios of additives. | ||
The results show that, first of all, both MRGO and MMD as additives can effectively reduce the WSD and AFC of the base oil and improve the tribological performance. Although there is an overlap of error axes in some cases, it can be concluded that the anti-friction and anti-wear properties of lubricating oil are affected by the ratio of additives. Secondly, it can be seen that the anti-friction property of MMD is better, while MRGO has better wear resistance. When the two additives are mixed, the composite additive has better tribological properties than the single additive, which means that the two additives have a synergistic effect. Thirdly, under the same additive ratio, the WSD of the lubricating oil with UMBM is smaller than that without UMBM. This result shows that UMBM treatment has a positive effect on the anti-wear and anti-friction properties of lubricating oil. At the same time, whether it was treated by UMBM or not, with the change of WtMRGO![[thin space (1/6-em)]](https://www.rsc.org/images/entities/char_2009.gif) :
:![[thin space (1/6-em)]](https://www.rsc.org/images/entities/char_2009.gif) WtMMD from 1
WtMMD from 1![[thin space (1/6-em)]](https://www.rsc.org/images/entities/char_2009.gif) :
:![[thin space (1/6-em)]](https://www.rsc.org/images/entities/char_2009.gif) 0 to 0
0 to 0![[thin space (1/6-em)]](https://www.rsc.org/images/entities/char_2009.gif) :
:![[thin space (1/6-em)]](https://www.rsc.org/images/entities/char_2009.gif) 1, the WSD of lubricating oil decreases at first and then increases, and the same phenomenon also occurs in the change of AFC. Finally, no matter whether it was treated by UMBM or not, when WtMRGO
1, the WSD of lubricating oil decreases at first and then increases, and the same phenomenon also occurs in the change of AFC. Finally, no matter whether it was treated by UMBM or not, when WtMRGO![[thin space (1/6-em)]](https://www.rsc.org/images/entities/char_2009.gif) :
:![[thin space (1/6-em)]](https://www.rsc.org/images/entities/char_2009.gif) WtMMD was 6
WtMMD was 6![[thin space (1/6-em)]](https://www.rsc.org/images/entities/char_2009.gif) :
:![[thin space (1/6-em)]](https://www.rsc.org/images/entities/char_2009.gif) 4, the WSD reached the lowest, which decreased by 25.01% (1.140 mm) and 26.97% (1.110 mm) respectively, which proved that the additives had the best anti-wear effect at this time. When WtMRGO
4, the WSD reached the lowest, which decreased by 25.01% (1.140 mm) and 26.97% (1.110 mm) respectively, which proved that the additives had the best anti-wear effect at this time. When WtMRGO![[thin space (1/6-em)]](https://www.rsc.org/images/entities/char_2009.gif) :
:![[thin space (1/6-em)]](https://www.rsc.org/images/entities/char_2009.gif) WtMMD is 5
WtMMD is 5![[thin space (1/6-em)]](https://www.rsc.org/images/entities/char_2009.gif) :
:![[thin space (1/6-em)]](https://www.rsc.org/images/entities/char_2009.gif) 5, the AFC is the lowest, which decreases by 36.76% (0.043) and 44.00% (0.0381) respectively, which proved that the two additives have the best anti-friction effect at this time. When the additive ratio is 5
5, the AFC is the lowest, which decreases by 36.76% (0.043) and 44.00% (0.0381) respectively, which proved that the two additives have the best anti-friction effect at this time. When the additive ratio is 5![[thin space (1/6-em)]](https://www.rsc.org/images/entities/char_2009.gif) :
:![[thin space (1/6-em)]](https://www.rsc.org/images/entities/char_2009.gif) 5 or 6
5 or 6![[thin space (1/6-em)]](https://www.rsc.org/images/entities/char_2009.gif) :
:![[thin space (1/6-em)]](https://www.rsc.org/images/entities/char_2009.gif) 4, compared with AFC, WSD has little difference. So the optimum composition of MRGO/MMD was 5
4, compared with AFC, WSD has little difference. So the optimum composition of MRGO/MMD was 5![[thin space (1/6-em)]](https://www.rsc.org/images/entities/char_2009.gif) :
:![[thin space (1/6-em)]](https://www.rsc.org/images/entities/char_2009.gif) 5.
5.
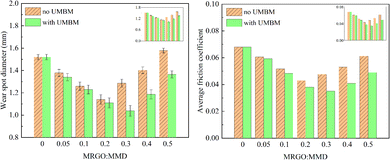 | ||
| Fig. 12 Wear spot diameter and average friction coefficient of lubricating oil with different contents of additives. | ||
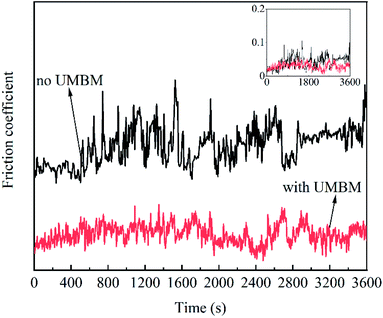
In order to further illustrate the effect of UMBM processing on the friction process, Fig. 13 shows the friction coefficient of lubricating oil changing with time. To facilitate observation, the image is offset by Y-axis. It can be seen that compared with the lubricating oil without UMBM treatment, the friction coefficient of the lubricating oil treated with UMBM changes less and stably, so both the maximum friction coefficient and the average friction coefficient are lower. This is because the additives are more stably dispersed in the oil after UMBM treatment, it is more difficult to agglomerate in the friction process. The additives introduced by UMBM can obtain more stable anti-friction properties in the PAO6.
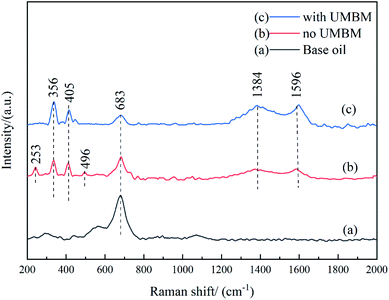
Fig. 14 shows the results of Raman spectra of friction surfaces, the curve (a) corresponds to base oil, (b) corresponds to the lubricating oil without UMBM treatment, (c) corresponds to the lubricating oil with UMBM treatment, and the total amount of additives is 0.3 wt% (WtMRGO![[thin space (1/6-em)]](https://www.rsc.org/images/entities/char_2009.gif) :
:![[thin space (1/6-em)]](https://www.rsc.org/images/entities/char_2009.gif) WtMMD = 5
WtMMD = 5![[thin space (1/6-em)]](https://www.rsc.org/images/entities/char_2009.gif) :
:![[thin space (1/6-em)]](https://www.rsc.org/images/entities/char_2009.gif) 5). It can be seen that, first of all, for the friction surface lubricated by base oil, there is an obvious characteristic peak near 683 cm−1, which corresponds to Fe oxide, indicating that serious oxidation has taken place on the friction surface, and occlusal wear can be judged on the friction surface. When MRGO and MMD are directly added to the lubricating oil, the characteristic peak of graphene appears on the friction surface at 1384 and 1596 cm−1, which corresponds to the D and G peak of graphene, and the characteristic peak of MoS2 is detected at 356 and 405 cm−1, respectively. However, the characteristic peak of Fe oxide is reduced. Combined with the result in tribological experiments, additives can improve the anti-friction and anti-wear, it can be considered that additives deposited or adsorbed on the friction contact surface to form a protective film, which avoids the direct contact of the friction surface, thus playing the beneficial role to anti-friction and anti-wear.32 Besides, the two characteristic peaks of the friction surface at 253 and 496 cm−1 correspond to the chemical reactants of MoS2,33 indicating that some chemical reaction takes place between MMD and the friction surface. When MRGO and MMD are introduced by UMBM treatment, it can be seen that the Raman characteristic peak of MoS2 chemical reactants basically disappears, indicating that the friction surface is better protected, and the reaction between MMD and friction surface is suppressed. At the same time, the characteristic peaks of graphene and MoS2 are enhanced, while the characteristic peaks of Fe oxides are greatly reduced. This information proves that the additives form a more complete protective film on the friction surface. The above results show that the additives were introduced by UMBM in the lubricating oil can be deposited more and better on the friction contact surface, forming a complete and continuous protective film, thus protecting the friction surface.
5). It can be seen that, first of all, for the friction surface lubricated by base oil, there is an obvious characteristic peak near 683 cm−1, which corresponds to Fe oxide, indicating that serious oxidation has taken place on the friction surface, and occlusal wear can be judged on the friction surface. When MRGO and MMD are directly added to the lubricating oil, the characteristic peak of graphene appears on the friction surface at 1384 and 1596 cm−1, which corresponds to the D and G peak of graphene, and the characteristic peak of MoS2 is detected at 356 and 405 cm−1, respectively. However, the characteristic peak of Fe oxide is reduced. Combined with the result in tribological experiments, additives can improve the anti-friction and anti-wear, it can be considered that additives deposited or adsorbed on the friction contact surface to form a protective film, which avoids the direct contact of the friction surface, thus playing the beneficial role to anti-friction and anti-wear.32 Besides, the two characteristic peaks of the friction surface at 253 and 496 cm−1 correspond to the chemical reactants of MoS2,33 indicating that some chemical reaction takes place between MMD and the friction surface. When MRGO and MMD are introduced by UMBM treatment, it can be seen that the Raman characteristic peak of MoS2 chemical reactants basically disappears, indicating that the friction surface is better protected, and the reaction between MMD and friction surface is suppressed. At the same time, the characteristic peaks of graphene and MoS2 are enhanced, while the characteristic peaks of Fe oxides are greatly reduced. This information proves that the additives form a more complete protective film on the friction surface. The above results show that the additives were introduced by UMBM in the lubricating oil can be deposited more and better on the friction contact surface, forming a complete and continuous protective film, thus protecting the friction surface.
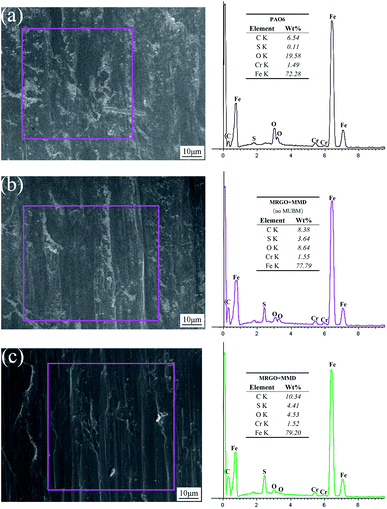
Fig. 15 shows the SEM image of the friction surface and the corresponding EDS analysis results. It can be seen that the friction surface of base oil has a high content of O element, which indicates that the friction surface is oxidized to a great extent, but the content of C element is very low, only 6.54 wt%, which may be related to the matrix composition of steel ball and the carbonization of the oil layer, while the content of S element is very few. The main element components of the additives are C and S, and the O content can reflect the damage degree of the friction surface. Therefore, comparing Fig. 15(b) with Fig. 15(c), it can be concluded that the friction surface lubricated by lubricating oil with UMBM treatment has lower oxygen content and higher total carbon and sulfur content.34 This is consistent with the conclusion of Raman spectroscopy, which proves that more additives are deposited or absorbed on the friction surface of the lubricating oil treated by UMBM, and the friction surface is better protected.
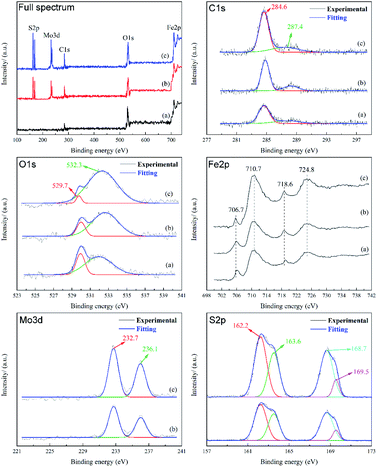
In order to further reveal the mechanism of UMBM improving friction performance, the friction surfaces lubricated by three kinds of lubricants were analyzed by XPS. Fig. 16 shows the results.
From the spectrum of C element, it can be seen that the C element on the friction surface mainly exists as simple substance. The two C1s peaks at 284.6 eV and 287.4 eV, corresponding to sp3C (C–C/O) and sp2C (C![[double bond, length as m-dash]](https://www.rsc.org/images/entities/char_e001.gif) C/O), respectively.35 These two peaks can be observed in three samples. Combined with the results of Raman spectra and EDS, it can be concluded that an adsorption protective film is indeed formed on the friction surface after friction, and the adsorption film is mainly composed of carbon or organic compounds containing esters, which may come from MRGO or base oil (PAO6), and play a protective role in the friction process. The area of these two peaks in C1s is the largest in the curve (c), which proves that the friction surface has the most complete or thicker protective film. The O1s peak points to sulfate at 532.3 eV, indicating that there is a chemical reaction film containing sulfate on the worn surface. The O1s peak is attributed to Fe2O3 at 529.7 eV,36 due to the friction oxidation of the matrix during the friction process, but obviously, the curve (c) has a lower peak area, indicating that the oxidation degree of the friction surface is the lowest. In the Fe2p peak, clear peaks can be observed at 710.7 eV and 724.8 eV, corresponding to Fe2p3/2 and Fe2p1/2 signals, respectively, in which there may be FeS and Fe2O3, which indicates that the oxidation of the friction surface is inevitable. When lubricated with base oil PAO6, no obvious Mo3d and S2p signal peaks can be found on the friction surface. When MRGO and MMD are added, two peaks belonging to Mo3d can be observed at 232.7 and 236.1 eV, corresponding to MoO3,37 which may be the product of the reaction between MoS2 and the friction surface in the friction process. Among the S2p peaks, two obvious peaks can be observed at 168.7 eV and 162.2 eV, of which the peak at 168.7 eV belongs to SO42−, the peak at 162.2 eV may belong to MoS2 or FeS. These prove that MMD not only forms a protective film on the friction surface but also has a tribochemical reaction with the friction surface. Besides, the peak area of the curve (c) is larger than that of the curve (b), which is consistent with the results given in the Mo3d diagram. This shows that UMBM treatment contributes to the formation of sulfate on the friction interface or the deposition of more MMD particles on the friction surface.
C/O), respectively.35 These two peaks can be observed in three samples. Combined with the results of Raman spectra and EDS, it can be concluded that an adsorption protective film is indeed formed on the friction surface after friction, and the adsorption film is mainly composed of carbon or organic compounds containing esters, which may come from MRGO or base oil (PAO6), and play a protective role in the friction process. The area of these two peaks in C1s is the largest in the curve (c), which proves that the friction surface has the most complete or thicker protective film. The O1s peak points to sulfate at 532.3 eV, indicating that there is a chemical reaction film containing sulfate on the worn surface. The O1s peak is attributed to Fe2O3 at 529.7 eV,36 due to the friction oxidation of the matrix during the friction process, but obviously, the curve (c) has a lower peak area, indicating that the oxidation degree of the friction surface is the lowest. In the Fe2p peak, clear peaks can be observed at 710.7 eV and 724.8 eV, corresponding to Fe2p3/2 and Fe2p1/2 signals, respectively, in which there may be FeS and Fe2O3, which indicates that the oxidation of the friction surface is inevitable. When lubricated with base oil PAO6, no obvious Mo3d and S2p signal peaks can be found on the friction surface. When MRGO and MMD are added, two peaks belonging to Mo3d can be observed at 232.7 and 236.1 eV, corresponding to MoO3,37 which may be the product of the reaction between MoS2 and the friction surface in the friction process. Among the S2p peaks, two obvious peaks can be observed at 168.7 eV and 162.2 eV, of which the peak at 168.7 eV belongs to SO42−, the peak at 162.2 eV may belong to MoS2 or FeS. These prove that MMD not only forms a protective film on the friction surface but also has a tribochemical reaction with the friction surface. Besides, the peak area of the curve (c) is larger than that of the curve (b), which is consistent with the results given in the Mo3d diagram. This shows that UMBM treatment contributes to the formation of sulfate on the friction interface or the deposition of more MMD particles on the friction surface.
4 Conclusions
The experimental results show that UMBM treatment is an effective method to introduce additives. It can effectively improve the dispersion degree of additives in lubricating oil. And UMBM treatment can give better play to the tribological properties of additives in lubricating oil from three aspects.(1) UMBM improves the dispersion of additives powder so that additives can be more and better deposited or adsorbed on the friction surface, forming a more complete lubrication protective film.
(2) The additives with great dispersion are more difficult to gather in the friction process, so the lubricating oil can obtain more stable anti-friction performance.
(3) UMBM can increase the aggregation threshold of additives in lubricating oil, thus changing the optimum content of additives in lubricating oil. If the additives are directly introduced into the lubricating oil and the additives content is 0.2 wt%, the wear spot diameter and the average friction coefficient have the minimum, are reduced by 23.68% (1.160 mm) and 36.76% (0.043), respectively. The tribological performance can be further improved by UMBM. Through UMBM treatment, when the additives content is 0.2 wt%, the lubricating oil has the best tribological performance, the wear spot diameter and average friction coefficient are reduced by 31.71% (1.038 mm) and 48.53% (0.035), respectively.
Conflicts of interest
There are no conflicts to declare.Acknowledgements
This work is supported by Hunan Provincial Natural Science Foundation of China (14JJ1013), and State Key Laboratory of Advanced Design and Manufacturing for Vehicle Body (Hunan University).Notes and references
- J. Wang, X. Guo, Y. He, M. Jiang and R. Sun, RSC Adv., 2017, 7, 40249–40254 RSC.
- C. Zhengfeng, Y. Xia and X. Ge, Ind. Lubr. Tribol., 2016, 68, 577–585 CrossRef.
- W. Khalil, A. Mohamed, M. Bayoumi and T. A. Osman, Fullerenes, Nanotubes, Carbon Nanostruct., 2016, 24, 479–485 CrossRef CAS.
- J. Sun and S. Du, RSC Adv., 2019, 9, 40642–40661 RSC.
- G. Paul, H. Hirani, T. Kuila and N. C. Murmu, Nanoscale, 2019, 11, 3458–3483 RSC.
- W. Zhang, M. Zhou, H. Zhu, K. Wang, J. Wei, F. Ji, X. Li, Z. Li, P. Zhang and D. Wu, J. Phys. D: Appl. Phys., 2011, 44, 205–303 Search PubMed.
- E. Varrla, S. Venkataraman and R. Sundara, ACS Appl. Mater. Interfaces, 2011, 3, 4221–4227 CrossRef PubMed.
- S. Ray, J. Mater. Sci. Lett., 2000, 19, 803–804 CrossRef CAS.
- M. Yi and C. Zhang, RSC Adv., 2018, 8, 9564–9573 RSC.
- X. Qin, P.-l. Ke and K. Kim, Surf. Coat. Technol., 2013, 228, 275–281 CrossRef CAS.
- S. Hu and Y. Zhao, Lubr. Sci., 2005, 17, 295–308 CrossRef.
- T. Onodera, Y. Morita, R. Nagumo, R. Miura, A. Suzuki, H. Tsuboi, N. Hatakeyama, A. Endou, H. Takaba, F. Dassenoy, C. Minfray, L. Joly-Pottuz, M. Kubo, J. Martin and A. Miyamoto, J. Phys. Chem. B, 2010, 114, 15832–15838 CrossRef CAS PubMed.
- K. Gong, X. Wu, G. Zhao and X. Wang, Tribol. Int., 2017, 110, 1–7 CrossRef CAS.
- P. Lin, L. Meng, Y. Huang, L. Liu and D. Fan, Appl. Surf. Sci., 2015, 324, 784–790 CrossRef CAS.
- E. K. Price, T. Bansala, T. C. Achee, W. Sun and M. J. Green, J. Colloid Interface Sci., 2019, 552, 771–780 CrossRef CAS PubMed.
- G. Cravotto and P. Cintas, Chem. Soc. Rev., 2006, 35, 180–196 RSC.
- M. Poddar, S. Pradhan and U. Sundararaj, AIChE J., 2018, 64, 673–687 CrossRef CAS.
- G. Cravotto and P. Cintas, Chem. Sci., 2012, 3, 295–307 RSC.
- Z. Yuan, Z.-H. Chen, C. Ding and Z. Kang, Ultrason. Sonochem., 2014, 22, 188–197 CrossRef PubMed.
- G. Cravotto, E. C. Gaudino and P. Cintas, Chem. Soc. Rev., 2013, 42, 7521–7534 RSC.
- H. Fu, C. Ding, Z. Liang, S. Zhao and Y. Luo, Dalton Trans., 2017, 46, 16525–16531 RSC.
- K. Li, J. Chen, G. Chen, J. Peng, R. Ruan and C. Srinivasakannan, Bioresour. Technol., 2019, 286, 121381 CrossRef CAS PubMed.
- D. Chen and H.-y. Liu, Mater. Lett., 2012, 72, 95–97 CrossRef CAS.
- D. Chen, Y. Zhang, B. Chen and Z. Kang, Ind. Eng. Chem. Res., 2013, 52, 14179–14184 CrossRef CAS.
- Y. Guo, X. Sun, Y. Liu, W. Wang, H. Qiu and J. Gao, Carbon, 2012, 50, 2513–2523 CrossRef CAS.
- K. C. Wong, X. Lu, J. Cotter, D. Eadie, P. Wong and K. A. R. Mitchell, Wear, 2008, 264, 526–534 CrossRef CAS.
- D. Li, M. Müller, S. Gilje, R. Kaner and G. Wallace, Nat. Nanotechnol., 2008, 3, 101–105 CrossRef CAS PubMed.
- D. Chen, X. Yi, Z. Chen, Y. Zhang, B. Chen and Z. Kang, Int. J. Appl. Ceram. Technol., 2014, 11, 954–959 CrossRef CAS.
- Y.-z. Zhang, Z.-t. Kang and D. Chen, Mater. Lett., 2014, 133, 259–261 CrossRef CAS.
- D. Chen, S. Ai, Z. Liang and F. Wei, Ceram. Int., 2015, 42, 3692–3696 CrossRef.
- X. Wang, Y. Zhang, Z. Yin, Y. Su, Y. Zhang and J. Cao, Tribol. Int., 2019, 135, 29–37 CrossRef CAS.
- G. Kumar, H. C. Garg and A. Gijawara, Ind. Lubr. Tribol., 2019, 5, 196 Search PubMed.
- G. Li, C. Li, H. Tang, K. Cao, J. Chen, F. Wang and Y. Jin, J. Alloys Compd., 2010, 501, 275–281 CrossRef CAS.
- J. Lin, L. Wang and G. Chen, Tribol. Lett., 2010, 41, 209–215 CrossRef.
- Y. Xu, X. Hu, K. Yuan, G. Zhu and W. Wang, Tribol. Int., 2014, 71, 168–174 CrossRef CAS.
- K. H. Hu, X. G. Hu, Y. F. Xu, F. Huang and J. S. Liu, Tribol. Lett., 2010, 40, 155–165 CrossRef CAS.
- K. H. Hu, J. Wang, S. Schraube, Y. F. Xu, X. G. Hu and R. Stengler, Wear, 2009, 266(11–12), 1198–1207 CrossRef CAS.
| This journal is © The Royal Society of Chemistry 2020 |

