 Open Access Article
Preparation of quercetin–nicotinamide cocrystals and their evaluation under in vivo and in vitro conditions†
Na Wuab,
Yan Zhangb,
Jian Renb,
Aiguo Zengc and
Juntian Liu *a
*a
aSchool of Basic Medical Sciences, Health Science Center, Xi'an Jiaotong University, 76 West Yanta Road, Xi'an, 710061, China. E-mail: ljt@mail.xjtu.edu.cn; Tel: +86-29-82665188
bThe Eighth Hospital of Xi'an, 2 East Zhangba Street, Xi'an, 710061, China
cSchool of Pharmacy, Health Science Center, Xi'an Jiaotong University, 76 West Yanta Road, Xi'an, 710061, China
First published on 9th June 2020
Abstract
Quercetin is a flavonoid abundant in the plant kingdom. Various types of bioactivities of quercetin have been demonstrated in vitro. Although quercetin has been proposed to exhibit numerous pharmacological benefits, it suffers from low bioavailability on account of its obviously poor solubility in water. Cocrystals have generated interest recently as a way of enhancing the dissolution in vitro and creating relative bioavailability of insoluble medicine. In this study, quercetin–nicotinamide cocrystals were obtained via a solvent evaporation technique. Furthermore, quercetin–nicotinamide cocrystals were characterized via Fourier transform infrared (FI-IR) spectroscopy, X-ray powder diffraction (PXRD), and differential scanning calorimetry (DSC) techniques. Quercetin–nicotinamide cocrystals are a new phase material, and the established intermolecular forces such as hydrogen bonds between quercetin and nicotinamide existed in the quercetin–nicotinamide cocrystals, as confirmed from the solid-state analysis. The dissolution of quercetin–nicotinamide cocrystals was found to be significantly higher than that of quercetin crystals. The pharmacokinetic data from the in vivo experiments suggested that quercetin–nicotinamide cocrystals could significantly increase the oral absorption of quercetin by nearly 4-fold. These results demonstrate that the developed quercetin–nicotinamide cocrystals are a promising oral formulation toward improvement in the dissolution and bioavailability of quercetin.
1 Introduction
Flavonoids exist extensively in nature, and some of these compounds possess medicinal value, such as antioxidant, free radical scavenging and antitumor activities.1 Numerous studies have shown protective effects of flavonoids against cardiovascular diseases and senility through antioxidant-free radical activity, and tumor by reducing drug resistance, and so on.2 Quercetin (3,3′,4′,5,7-pentahydroxyflavone), a naturally occurring biological flavonoid, mainly comes from acerola cherries, tea, red onions, raspberries, blueberries and other plants and displays a strong antioxidant activity3 and other bioactivities including anti-inflammatory, anti-tumor, cardioprotective and metal chelating effects.4–7Although quercetin has numerous beneficial effects on humans, its extremely low solubility in water limits its development and applications. It is reported that the oral absorption of quercetin in the gastrointestinal system is very low, only 2%,8–10 due to its high crystallinity that causes the low absorption of quercetin. Therefore, the improvement of quercetin solubility in water is necessary to increase its bioavailability.
For the past few years, some techniques have been applied to increase the dissolution and bioavailability of quercetin, such as amorphous solid dispersion, nanoencapsulation, and co-crystallization.11–13 Cocrystals are multi-component crystalline systems composed of different molecular and/or ionic compounds with some order in the proportion. However, the solid is neither a simple solvent complex nor a salt.14,15 In recent years, scientists have changed the physicochemical properties of solids, such as the dissolution, stability, physicochemical properties, bioavailability and mechanical properties using cocrystals and without affecting the activity of the original insoluble solid medicine.16,17 Cocrystals with active pharmaceutical ingredient (API) and different excipients, or of different stoichiometry with the same cocrystals as that of former, have a different crystal structure and bring about different physicochemical properties.18,19 The cocrystals of quercetin with caffeine or isonicotinamide/theobromine formed by hydrogen bonds can improve the water solubility of quercetin, and increase the bioavailability of quercetin by up to 10 folds.20
In this experiment, nicotinamide was chosen as a cocrystal former, and cocrystals of quercetin–nicotinamide with different stoichiometries were prepared. Furthermore, we characterized the cocrystals by numerous analytic methods and investigated their dissolution and bioavailability.
2 Experiments and methods
Quercetin (98% purity) and nicotinamide (99% purity) were purchased from Xi'an Shuaidi Biotechnology Co., Ltd (Xi'an, Shaanxi, China). Methanol, acetonitrile and all other chemical reagents were obtained from Guangdong Chemical Reagent Engineering Enterprise R&D Centers of Chromatographical Pure (Guangzhou, Guangdong, China). An Agilent C18 column and an AT-130 column oven (150 × 4.6 mm, 5 μm) used in the experiment were purchased from Hangzhou Ruixi Technology Co., Ltd (Hangzhou, Zhejiang, China).Sprague-Dawley (SD) rats, weighing 240 to 290 g, were provided by Laboratory Animal Center of Health Science Center of Xi'an Jiaotong University (Xi'an, Shaanxi, China), and the experiments were approved with the standards of ethical review. All of the experimental protocols involving animals were reviewed and approved by the Medical Ethics Committee of the Xi'an Jiaotong University of Chinese Medicine Animal Care. ‘Principles of Laboratory Animal Care’ (NIH) and Guidelines of the Laboratory Animal Care Committee of Xi'an Jiaotong University were obeyed.
2.1 Preparation of quercetin–nicotinamide cocrystals
Quercetin and nicotinamide in the molar mass ratios of 1![[thin space (1/6-em)]](https://www.rsc.org/images/entities/char_2009.gif) :
:![[thin space (1/6-em)]](https://www.rsc.org/images/entities/char_2009.gif) 1 (302.0 mg quercetin with 122.0 mg nicotinamide) and 1
1 (302.0 mg quercetin with 122.0 mg nicotinamide) and 1![[thin space (1/6-em)]](https://www.rsc.org/images/entities/char_2009.gif) :
:![[thin space (1/6-em)]](https://www.rsc.org/images/entities/char_2009.gif) 2 (302.0 mg quercetin with 244.0 mg nicotinamide) were dissolved in 25 mL absolute ethanol at 80 °C and filtered using a filter paper. The filtrate was slowly evaporated at room temperature to harvest the yellow crystals of the two cocrystals.
2 (302.0 mg quercetin with 244.0 mg nicotinamide) were dissolved in 25 mL absolute ethanol at 80 °C and filtered using a filter paper. The filtrate was slowly evaporated at room temperature to harvest the yellow crystals of the two cocrystals.
2.2 Analysis via powder X-ray diffraction (PXRD)
PXRD measurements were performed using a Bruker D8 ADVANCE instrument with Cu Kα radiation and operating at 2000 W with 30 mA and 40 kV, respectively. All samples were measured in the 2θ range of 5–45° at a step interval of 0.02°. The Jade software (version 6.5) was used to analyze the measurement data in this study.2.3 Differential scanning calorimetry (DSC)
The DSC thermograms were obtained using a DSC 822e (METTLER TOLEDO, Switzerland) instrument. All samples were loaded in aluminum pans, and the instrument was calibrated by an indium standard. An empty pan and samples were sealed and used for comparative testing. Samples were heated from 25 °C to 350 °C at a heating rate of 10 °C min−1 in an inert nitrogen atmosphere. We performed data analysis using STARe software (version 10.00). The STARe software (version 10.00) was employed to analyze the DSC results.2.4 Infrared spectroscopy (FT-IR)
A Shimadzu FT-IR 8400S system (Shimadzu, Japan) was employed to record the FT-IR spectra in the range of 4000 to 400 cm−1 (15 scans per spectrum). Samples were fully ground, followed by the addition of an appropriate amount of KBr powder and continue grinding until the particle size was less than 2 μm. Samples were placed in the mold and pressed into a transparent wafer before recording their IR spectra. The IR solution software was used to analyze the FT-IR results.2.5 Dissolution test
The dissolution test of quercetin (70 mg) and quercetin–nicotinamide cocrystals (equivalent to 70 mg quercetin) was performed using the ZRS-8LD intelligent dissolution tester (Tianjin Tianda Tianfa Technology Co. Ltd, China), using 200 mL water as a dissolution medium at the temperature of 37.5 ± 0.5 °C and at the velocity of rotation of 100 rpm. The in vitro dissolution of quercetin was performed by a slurry method for 6 h at the sampling time of 5, 10, 15, 20, 30, 60, 120, 180, 240, 300 and 360 min, and the samples were passed through a 0.45 μm microporous membrane filter. At a given sampling time, volume and temperature of the fresh dissolution medium were adjusted to correct the cumulative dilution. The sample concentrations were determined via high-performance liquid chromatography (HPLC) after filtration and dilution. All dissolution experiments were performed in triplicates.The chromatographic separation was obtained with a moving phase made up of methanol and 0.1% phosphoric acid (55![[thin space (1/6-em)]](https://www.rsc.org/images/entities/char_2009.gif) :
:![[thin space (1/6-em)]](https://www.rsc.org/images/entities/char_2009.gif) 45, bulk factor). Moreover, the flow rate of the moving phase was controlled at 1.0 mL min−1. The oven used for the chromatographic column was controlled at 30 °C. All the samples were analyzed via HPLC on a UV detector at 254 nm.
45, bulk factor). Moreover, the flow rate of the moving phase was controlled at 1.0 mL min−1. The oven used for the chromatographic column was controlled at 30 °C. All the samples were analyzed via HPLC on a UV detector at 254 nm.
2.6 Pharmacokinetics in rats
SD rats used in this study were fed an absolute diet (water for free) for 12 h continuously before the experiment. 10 male SD rats were stochastically divided into two groups for the oral administration of a bolus dose of quercetin or quercetin–nicotinamide cocrystals (1![[thin space (1/6-em)]](https://www.rsc.org/images/entities/char_2009.gif) :
:![[thin space (1/6-em)]](https://www.rsc.org/images/entities/char_2009.gif) 1), respectively. The suspensions of quercetin (10 mg kg−1) were composed of 2 mL 0.5% CMC-Na and quercetin, and quercetin–nicotinamide cocrystals (1
1), respectively. The suspensions of quercetin (10 mg kg−1) were composed of 2 mL 0.5% CMC-Na and quercetin, and quercetin–nicotinamide cocrystals (1![[thin space (1/6-em)]](https://www.rsc.org/images/entities/char_2009.gif) :
:![[thin space (1/6-em)]](https://www.rsc.org/images/entities/char_2009.gif) 1) equivalent to quercetin level of 10 mg kg−1. The blood samples were collected from the jugular vein at 0, 5, 10, 30, 60, 120, 240, 360, 480 and 720 min in heparinized tubes. Then, the blood samples were centrifuged for ten min (3000 rpm) and the obtained plasma samples were refrigerated at −80 °C for testing.
1) equivalent to quercetin level of 10 mg kg−1. The blood samples were collected from the jugular vein at 0, 5, 10, 30, 60, 120, 240, 360, 480 and 720 min in heparinized tubes. Then, the blood samples were centrifuged for ten min (3000 rpm) and the obtained plasma samples were refrigerated at −80 °C for testing.
The liquid–liquid extraction technique was used in plasma samples. Briefly, for a 0.5 μg mL−1 sample, 50 μL of genistein (internal standard) solution was added into the centrifuge tube and volatilized to dryness. 200 μL of the plasma samples were accurately measured, put into a centrifuge tube with the internal standard for volatile drying, then 0.5 mL of ethyl acetate was added, swirled blended for 1 min, and centrifuged (3500 rpm, 5 min). After standing for a while, the upper layer was transferred into another clean test tube, blow-dried under a nitrogen flow. The remaining obtained residue was redissolved in 50 μL of methanol, swirled for 1 min, and centrifuged (12![[thin space (1/6-em)]](https://www.rsc.org/images/entities/char_2009.gif) 000 rpm, 5 min); after standing for a while, 20 μL of the supernatant liquid was injected into the HPLC system, and the analysis results were recorded.
000 rpm, 5 min); after standing for a while, 20 μL of the supernatant liquid was injected into the HPLC system, and the analysis results were recorded.
The chromatographic separation was obtained with a moving phase, comprising acetonitrile, methanol and 0.1% phosphoric acid (30![[thin space (1/6-em)]](https://www.rsc.org/images/entities/char_2009.gif) :
:![[thin space (1/6-em)]](https://www.rsc.org/images/entities/char_2009.gif) 5
5![[thin space (1/6-em)]](https://www.rsc.org/images/entities/char_2009.gif) :
:![[thin space (1/6-em)]](https://www.rsc.org/images/entities/char_2009.gif) 65, bulk factor), and under a controlled flow velocity of 1.0 mL min−1. The oven was maintained at 30 °C. The ratio of the chromatographic peak area of quercetin to an internal standard by UV absorbency at 254 nm was determined for quantitative analysis.
65, bulk factor), and under a controlled flow velocity of 1.0 mL min−1. The oven was maintained at 30 °C. The ratio of the chromatographic peak area of quercetin to an internal standard by UV absorbency at 254 nm was determined for quantitative analysis.
The WinNolin software (version 5.2) was used to match the non-compartment model of the measured pharmacokinetic data and the Student's t-test was used for the statistical analysis. The SPSS software (version 18) was employed for the statistical analysis (p < 0.05).
3 Results and discussion
3.1 Solid state characterization
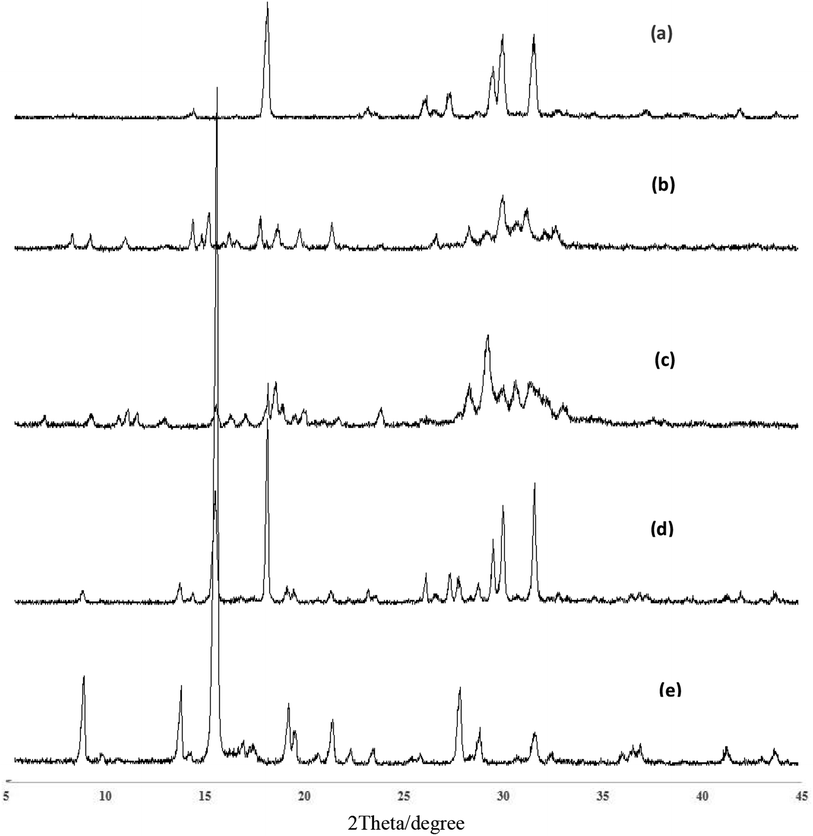
![[thin space (1/6-em)]](https://www.rsc.org/images/entities/char_2009.gif) :
:![[thin space (1/6-em)]](https://www.rsc.org/images/entities/char_2009.gif) 1 and 1
1 and 1![[thin space (1/6-em)]](https://www.rsc.org/images/entities/char_2009.gif) :
:![[thin space (1/6-em)]](https://www.rsc.org/images/entities/char_2009.gif) 2) were different from the physical mixture of quercetin and nicotinamide. A new phase was formed as seen from the patterns.
2) were different from the physical mixture of quercetin and nicotinamide. A new phase was formed as seen from the patterns.
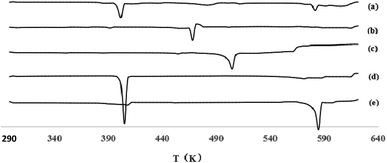
![[thin space (1/6-em)]](https://www.rsc.org/images/entities/char_2009.gif) :
:![[thin space (1/6-em)]](https://www.rsc.org/images/entities/char_2009.gif) 1) and quercetin–nicotinamide cocrystals (1
1) and quercetin–nicotinamide cocrystals (1![[thin space (1/6-em)]](https://www.rsc.org/images/entities/char_2009.gif) :
:![[thin space (1/6-em)]](https://www.rsc.org/images/entities/char_2009.gif) 2) were 231.77 °C and 195.1 °C, respectively. These results were different from the physical mixture of quercetin and nicotinamide. The formation of some new phases was also observed. The same conclusions were reached from the PXRD figures.
2) were 231.77 °C and 195.1 °C, respectively. These results were different from the physical mixture of quercetin and nicotinamide. The formation of some new phases was also observed. The same conclusions were reached from the PXRD figures.
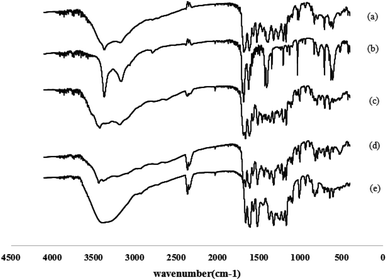
The FT-IR spectra of quercetin, nicotinamide, physical mixture (1![[thin space (1/6-em)]](https://www.rsc.org/images/entities/char_2009.gif) :
:![[thin space (1/6-em)]](https://www.rsc.org/images/entities/char_2009.gif) 1) and quercetin–nicotinamide cocrystals (1
1) and quercetin–nicotinamide cocrystals (1![[thin space (1/6-em)]](https://www.rsc.org/images/entities/char_2009.gif) :
:![[thin space (1/6-em)]](https://www.rsc.org/images/entities/char_2009.gif) 1 and 1
1 and 1![[thin space (1/6-em)]](https://www.rsc.org/images/entities/char_2009.gif) :
:![[thin space (1/6-em)]](https://www.rsc.org/images/entities/char_2009.gif) 2) are shown in Fig. 3. The characteristic peak for quercetin is observed at 3560 cm−1 (O–H stretching vibrations), while the peak for quercetin–nicotinamide cocrystals (1
2) are shown in Fig. 3. The characteristic peak for quercetin is observed at 3560 cm−1 (O–H stretching vibrations), while the peak for quercetin–nicotinamide cocrystals (1![[thin space (1/6-em)]](https://www.rsc.org/images/entities/char_2009.gif) :
:![[thin space (1/6-em)]](https://www.rsc.org/images/entities/char_2009.gif) 1) is at 3230 cm−1. The characteristic peaks for nicotinamide were generally seen at 1690 cm−1 (C
1) is at 3230 cm−1. The characteristic peaks for nicotinamide were generally seen at 1690 cm−1 (C![[double bond, length as m-dash]](https://www.rsc.org/images/entities/char_e001.gif) O stretching vibrations) and 3520 cm−1 (N–H stretching vibrations), but the enhanced characteristic peaks for quercetin–nicotinamide cocrystals (1
O stretching vibrations) and 3520 cm−1 (N–H stretching vibrations), but the enhanced characteristic peaks for quercetin–nicotinamide cocrystals (1![[thin space (1/6-em)]](https://www.rsc.org/images/entities/char_2009.gif) :
:![[thin space (1/6-em)]](https://www.rsc.org/images/entities/char_2009.gif) 1) are observed at 1630 cm−1 and 3350 cm−1. Comparing with quercetin and nicotinamide, the FT-IR spectra of quercetin–nicotinamide cocrystals show peak shifts (3560 → 3230 cm−1 for O–H stretching vibrations, 1690 → 1630 cm−1 for C
1) are observed at 1630 cm−1 and 3350 cm−1. Comparing with quercetin and nicotinamide, the FT-IR spectra of quercetin–nicotinamide cocrystals show peak shifts (3560 → 3230 cm−1 for O–H stretching vibrations, 1690 → 1630 cm−1 for C![[double bond, length as m-dash]](https://www.rsc.org/images/entities/char_e001.gif) O vibrations, and 3520 → 3350 cm−1 for N–H stretching vibrations). This could be due to the formation of hydrogen bonds between quercetin and nicotinamide in quercetin–nicotinamide cocrystals, which might change some peak positions and shapes. The characteristic FT-IR absorption peaks for the physical mixture of quercetin and nicotinamide were the same as those of the superimposed peaks of quercetin and nicotinamide, which proved that the simple mixture of quercetin and nicotinamide had no interaction with each other. The physical mixture of quercetin and nicotinamide did not exhibit any intermolecular forces with each other. The same results are also seen in PXRD and DSC.
O vibrations, and 3520 → 3350 cm−1 for N–H stretching vibrations). This could be due to the formation of hydrogen bonds between quercetin and nicotinamide in quercetin–nicotinamide cocrystals, which might change some peak positions and shapes. The characteristic FT-IR absorption peaks for the physical mixture of quercetin and nicotinamide were the same as those of the superimposed peaks of quercetin and nicotinamide, which proved that the simple mixture of quercetin and nicotinamide had no interaction with each other. The physical mixture of quercetin and nicotinamide did not exhibit any intermolecular forces with each other. The same results are also seen in PXRD and DSC.
3.2 Dissolution
The dissolution curves for quercetin, nicotinamide, physical mixture (1![[thin space (1/6-em)]](https://www.rsc.org/images/entities/char_2009.gif) :
:![[thin space (1/6-em)]](https://www.rsc.org/images/entities/char_2009.gif) 1) and quercetin–nicotinamide cocrystals (1
1) and quercetin–nicotinamide cocrystals (1![[thin space (1/6-em)]](https://www.rsc.org/images/entities/char_2009.gif) :
:![[thin space (1/6-em)]](https://www.rsc.org/images/entities/char_2009.gif) 1 and 1
1 and 1![[thin space (1/6-em)]](https://www.rsc.org/images/entities/char_2009.gif) :
:![[thin space (1/6-em)]](https://www.rsc.org/images/entities/char_2009.gif) 2) in water are shown in Fig. 4. The in vitro dissolution of quercetin was determined by the slurry method, in the same way, it was for quercetin–nicotinamide cocrystals (1
2) in water are shown in Fig. 4. The in vitro dissolution of quercetin was determined by the slurry method, in the same way, it was for quercetin–nicotinamide cocrystals (1![[thin space (1/6-em)]](https://www.rsc.org/images/entities/char_2009.gif) :
:![[thin space (1/6-em)]](https://www.rsc.org/images/entities/char_2009.gif) 1 and 1
1 and 1![[thin space (1/6-em)]](https://www.rsc.org/images/entities/char_2009.gif) :
:![[thin space (1/6-em)]](https://www.rsc.org/images/entities/char_2009.gif) 2) and the physical mixture. In this study, pure water was used as a dissolution medium and the samples were taken for 6 h at 5, 10, 15, 20, 30, 60, 120, 180, 240, 300 and 360 min, respectively. The dissolution tester temperature was maintained at 37.5 ± 0.5 °C. Quercetin had very poor water solubility, and the plateau concentration of quercetin was 1.5 μg mL−1, which agreed with reported by M. et al. (3 μg mL−1).22 The dissolution curve of quercetin was similar to that of the physical mixture of quercetin and nicotinamide. However, quercetin–nicotinamide cocrystals (1
2) and the physical mixture. In this study, pure water was used as a dissolution medium and the samples were taken for 6 h at 5, 10, 15, 20, 30, 60, 120, 180, 240, 300 and 360 min, respectively. The dissolution tester temperature was maintained at 37.5 ± 0.5 °C. Quercetin had very poor water solubility, and the plateau concentration of quercetin was 1.5 μg mL−1, which agreed with reported by M. et al. (3 μg mL−1).22 The dissolution curve of quercetin was similar to that of the physical mixture of quercetin and nicotinamide. However, quercetin–nicotinamide cocrystals (1![[thin space (1/6-em)]](https://www.rsc.org/images/entities/char_2009.gif) :
:![[thin space (1/6-em)]](https://www.rsc.org/images/entities/char_2009.gif) 1 and 1
1 and 1![[thin space (1/6-em)]](https://www.rsc.org/images/entities/char_2009.gif) :
:![[thin space (1/6-em)]](https://www.rsc.org/images/entities/char_2009.gif) 2) had better dissolution than the quercetin crystal in our study. It is important to note that quercetin–nicotinamide cocrystals (1
2) had better dissolution than the quercetin crystal in our study. It is important to note that quercetin–nicotinamide cocrystals (1![[thin space (1/6-em)]](https://www.rsc.org/images/entities/char_2009.gif) :
:![[thin space (1/6-em)]](https://www.rsc.org/images/entities/char_2009.gif) 1 and 1
1 and 1![[thin space (1/6-em)]](https://www.rsc.org/images/entities/char_2009.gif) :
:![[thin space (1/6-em)]](https://www.rsc.org/images/entities/char_2009.gif) 2) showed a significantly faster dissolution rate and supersaturated dissolution curve. Within 15 min, the dissolution rate of quercetin–nicotinamide cocrystals (1
2) showed a significantly faster dissolution rate and supersaturated dissolution curve. Within 15 min, the dissolution rate of quercetin–nicotinamide cocrystals (1![[thin space (1/6-em)]](https://www.rsc.org/images/entities/char_2009.gif) :
:![[thin space (1/6-em)]](https://www.rsc.org/images/entities/char_2009.gif) 1 and 1
1 and 1![[thin space (1/6-em)]](https://www.rsc.org/images/entities/char_2009.gif) :
:![[thin space (1/6-em)]](https://www.rsc.org/images/entities/char_2009.gif) 2) was faster than that of quercetin. The peak concentration of quercetin–nicotinamide cocrystals (1
2) was faster than that of quercetin. The peak concentration of quercetin–nicotinamide cocrystals (1![[thin space (1/6-em)]](https://www.rsc.org/images/entities/char_2009.gif) :
:![[thin space (1/6-em)]](https://www.rsc.org/images/entities/char_2009.gif) 1 and 1
1 and 1![[thin space (1/6-em)]](https://www.rsc.org/images/entities/char_2009.gif) :
:![[thin space (1/6-em)]](https://www.rsc.org/images/entities/char_2009.gif) 2) was 10 and 6 times the quercetin solubility, respectively. It was concluded that the rapid dissolution and higher solubility of quercetin–nicotinamide cocrystals were due to a strong hydrophilic effect. Quercetin was not easily dispersed in water and is highly hydrophobic. After reaching a peak concentration, the concentration of quercetin–nicotinamide cocrystals is gradually decreased and was 4.5 μg mL−1 at 6 h and 3 times the quercetin solubility. The downdrift of concentration was due to the recrystallization of quercetin during the dissolution experiment. The drastic increase in the solubility and faster dissolution rate for quercetin–nicotinamide cocrystals could benefit the oral bioavailability of quercetin and help to develop various applications.
2) was 10 and 6 times the quercetin solubility, respectively. It was concluded that the rapid dissolution and higher solubility of quercetin–nicotinamide cocrystals were due to a strong hydrophilic effect. Quercetin was not easily dispersed in water and is highly hydrophobic. After reaching a peak concentration, the concentration of quercetin–nicotinamide cocrystals is gradually decreased and was 4.5 μg mL−1 at 6 h and 3 times the quercetin solubility. The downdrift of concentration was due to the recrystallization of quercetin during the dissolution experiment. The drastic increase in the solubility and faster dissolution rate for quercetin–nicotinamide cocrystals could benefit the oral bioavailability of quercetin and help to develop various applications.
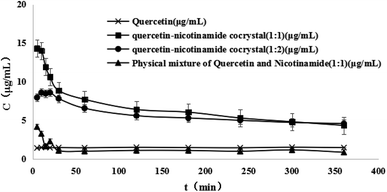 | ||
Fig. 4 Dissolution profiles of quercetin, physical mixture (1![[thin space (1/6-em)]](https://www.rsc.org/images/entities/char_2009.gif) : :![[thin space (1/6-em)]](https://www.rsc.org/images/entities/char_2009.gif) 1) and quercetin–nicotinamide cocrystals (1 1) and quercetin–nicotinamide cocrystals (1![[thin space (1/6-em)]](https://www.rsc.org/images/entities/char_2009.gif) : :![[thin space (1/6-em)]](https://www.rsc.org/images/entities/char_2009.gif) 1 and 1 1 and 1![[thin space (1/6-em)]](https://www.rsc.org/images/entities/char_2009.gif) : :![[thin space (1/6-em)]](https://www.rsc.org/images/entities/char_2009.gif) 2) in water. 2) in water. | ||
3.3 Pharmacokinetics
It is a hypothesis that the increase in dissolution could result in improving the bioavailability of quercetin–nicotinamide cocrystals. The bioavailability of quercetin–nicotinamide cocrystals was evaluated by pharmacokinetic parameters in rats. Quercetin–nicotinamide cocrystals (1![[thin space (1/6-em)]](https://www.rsc.org/images/entities/char_2009.gif) :
:![[thin space (1/6-em)]](https://www.rsc.org/images/entities/char_2009.gif) 1) were chosen to evaluate the bioavailability of quercetin–nicotinamide cocrystals due to their highest supersaturated dissolution.
1) were chosen to evaluate the bioavailability of quercetin–nicotinamide cocrystals due to their highest supersaturated dissolution.
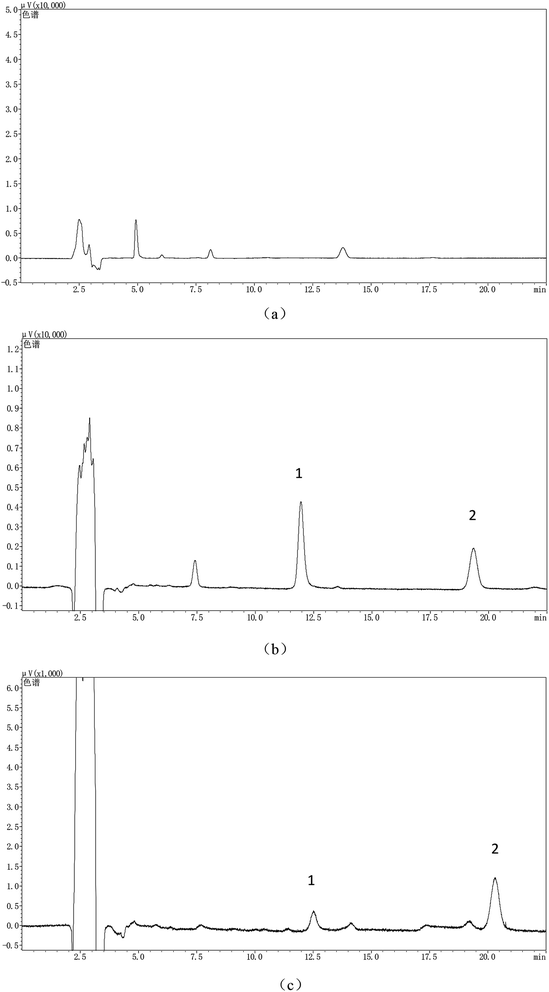
First, the methodology was verified via high performance liquid chromatography in this experiment. The experimental data showed that the peak values of quercetin and genistein (internal standard) were 12.4 min and 19.5 min, respectively, from high-performance liquid chromatography and two peaks were completely separated. The endogenous impurities in the plasma did not interfere with the determination of quercetin and genistein. The standard calibration curve, which consisted of six incremental sample concentrations (n = 3) of quercetin was constructed from the ratio of peak area and indicated a linear relationship between quercetin and genistein as a functional relationship of quercetin in the calculation of the plasma concentrations (Y = 0.55X − 0.2682), and showing favorable linearity relationship (r = 0.9990) at the effective concentration range of 0.4 to 8 μg mL−1. The quantification limit (S/N = 10) (S/N: signal-to-noise) and the detection limit (S/N = 3) for high-performance liquid chromatography were 4 ng and 1 ng, respectively. The extraction recovery and method recovery for blank plasma samples matched the three different concentrations. The scope of the accuracy of quercetin was from 95% to 104%, and the intra-day to inter-day RSD ranged from 1.37% to 5.35%, respectively. In summary, the validation consequences of methodology suggested that the method of HPLC in this study was dependable and acceptable.
The pharmacokinetic curves after the oral administration (10 mg kg−1) of quercetin and quercetin–nicotinamide cocrystals (1![[thin space (1/6-em)]](https://www.rsc.org/images/entities/char_2009.gif) :
:![[thin space (1/6-em)]](https://www.rsc.org/images/entities/char_2009.gif) 1) to rats are exhibited in Fig. 6. The accurate data of pharmacokinetic parameters are exhibited in Table 1. As expected, the oral absorption of quercetin was very poor because of its poor solubility. However, the blood concentration of quercetin was obviously higher than that of the quercetin crystal after the oral administration of quercetin–nicotinamide cocrystals (1
1) to rats are exhibited in Fig. 6. The accurate data of pharmacokinetic parameters are exhibited in Table 1. As expected, the oral absorption of quercetin was very poor because of its poor solubility. However, the blood concentration of quercetin was obviously higher than that of the quercetin crystal after the oral administration of quercetin–nicotinamide cocrystals (1![[thin space (1/6-em)]](https://www.rsc.org/images/entities/char_2009.gif) :
:![[thin space (1/6-em)]](https://www.rsc.org/images/entities/char_2009.gif) 1), containing the equivalent amount of quercetin. The maximum blood concentration (Cmax) was 1.3-fold superior to that of quercetin crystals, indicating that quercetin–nicotinamide cocrystals could enhance the absorption of oral quercetin. The area of quercetin under the curve (AUC0–12) obviously increased, and the relative bioavailability of quercetin was 392% in the quercetin–nicotinamide cocrystals (1
1), containing the equivalent amount of quercetin. The maximum blood concentration (Cmax) was 1.3-fold superior to that of quercetin crystals, indicating that quercetin–nicotinamide cocrystals could enhance the absorption of oral quercetin. The area of quercetin under the curve (AUC0–12) obviously increased, and the relative bioavailability of quercetin was 392% in the quercetin–nicotinamide cocrystals (1![[thin space (1/6-em)]](https://www.rsc.org/images/entities/char_2009.gif) :
:![[thin space (1/6-em)]](https://www.rsc.org/images/entities/char_2009.gif) 1). These results suggest that quercetin–nicotinamide cocrystals effectively enhance the oral bioavailability of quercetin (Fig. 5).
1). These results suggest that quercetin–nicotinamide cocrystals effectively enhance the oral bioavailability of quercetin (Fig. 5).
![[thin space (1/6-em)]](https://www.rsc.org/images/entities/char_2009.gif) :
:![[thin space (1/6-em)]](https://www.rsc.org/images/entities/char_2009.gif) 1) in rats (n = 5)
1) in rats (n = 5)
| Parameters | Unit | Quercetin | Quercetin–nicotinamide cocrystals |
|---|---|---|---|
| t1/2(kα) | min | 1.06 | 1.97 |
| t1/2(ke) | min | 4.96 × 10³ | 1.47 × 10⁴ |
| Tmax | min | 12.87 | 25.31 |
| Cmax | μg mL−1 | 0.54 | 0.71 |
| AUC0–12 | (μg mL−1) × min | 3.88 × 10³ | 1.52 × 10⁴ |
| Ka | min−1 | 0.66 | 0.35 |
| Ke | min−1 | 1.4 × 10⁻⁴ | 4.7 × 10⁻⁵ |
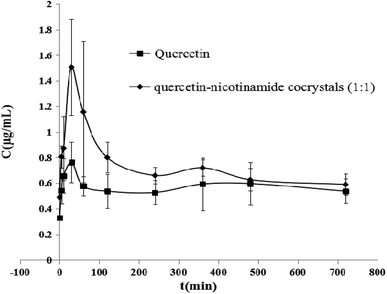 | ||
Fig. 6 Plasma concentration–time curves of quercetin in rats after the oral administration (10 mg kg−1) of quercetin or quercetin–nicotinamide cocrystals (1![[thin space (1/6-em)]](https://www.rsc.org/images/entities/char_2009.gif) : :![[thin space (1/6-em)]](https://www.rsc.org/images/entities/char_2009.gif) 1) (n = 5). 1) (n = 5). | ||
4 Discussion
PXRD, DSC and FT-IR are commonly used techniques for phase identifications. In this experiment, DSC is an analytic method to measure the change of enthalpy between the sample and the reference under the condition of the temperature range in a program, and the area of the curve is proportional to the change of enthalpy. An air atmosphere was used as a reference in this experiment. So, the data obtained are the enthalpy ratios of the samples, such as quercetin, quercetin–nicotinamide cocrystals (1![[thin space (1/6-em)]](https://www.rsc.org/images/entities/char_2009.gif) :
:![[thin space (1/6-em)]](https://www.rsc.org/images/entities/char_2009.gif) 1 and 1
1 and 1![[thin space (1/6-em)]](https://www.rsc.org/images/entities/char_2009.gif) :
:![[thin space (1/6-em)]](https://www.rsc.org/images/entities/char_2009.gif) 2) and the physical mixture of quercetin and nicotinamide. Different changes in enthalpy are corresponding to the different phases. Quercetin–nicotinamide cocrystals (1
2) and the physical mixture of quercetin and nicotinamide. Different changes in enthalpy are corresponding to the different phases. Quercetin–nicotinamide cocrystals (1![[thin space (1/6-em)]](https://www.rsc.org/images/entities/char_2009.gif) :
:![[thin space (1/6-em)]](https://www.rsc.org/images/entities/char_2009.gif) 1 and 1
1 and 1![[thin space (1/6-em)]](https://www.rsc.org/images/entities/char_2009.gif) :
:![[thin space (1/6-em)]](https://www.rsc.org/images/entities/char_2009.gif) 2) is a new phase obviously. Just the DSC is sometimes not able to accurately identify the presence of cocrystals and should be combined with other detection methods. As is known, the specific crystals have characteristic cell parameters and crystal structures. PXRD patterns show that quercetin–nicotinamide cocrystals (1
2) is a new phase obviously. Just the DSC is sometimes not able to accurately identify the presence of cocrystals and should be combined with other detection methods. As is known, the specific crystals have characteristic cell parameters and crystal structures. PXRD patterns show that quercetin–nicotinamide cocrystals (1![[thin space (1/6-em)]](https://www.rsc.org/images/entities/char_2009.gif) :
:![[thin space (1/6-em)]](https://www.rsc.org/images/entities/char_2009.gif) 1 and 1
1 and 1![[thin space (1/6-em)]](https://www.rsc.org/images/entities/char_2009.gif) :
:![[thin space (1/6-em)]](https://www.rsc.org/images/entities/char_2009.gif) 2) are new crystals different from quercetin crystals and their physical mixture. The FT-IR curves show that some hydrogen bonds are formed between quercetin and nicotinamide in quercetin–nicotinamide cocrystals.
2) are new crystals different from quercetin crystals and their physical mixture. The FT-IR curves show that some hydrogen bonds are formed between quercetin and nicotinamide in quercetin–nicotinamide cocrystals.
The slurry method was used in this study to measure the dissolution of samples. Pure water was adopted as the dissolution medium. The dissolution of quercetin–nicotinamide cocrystals (1![[thin space (1/6-em)]](https://www.rsc.org/images/entities/char_2009.gif) :
:![[thin space (1/6-em)]](https://www.rsc.org/images/entities/char_2009.gif) 1 and 1
1 and 1![[thin space (1/6-em)]](https://www.rsc.org/images/entities/char_2009.gif) :
:![[thin space (1/6-em)]](https://www.rsc.org/images/entities/char_2009.gif) 2) was higher than that of quercetin crystals. In the in vivo experiments, HPLC was used to measure the plasma concentration of quercetin. We have initially established an appropriate analytical method of stabilization, accuracy, and sensitivity. The quercetin–nicotinamide cocrystals effectively increase the drug concentration of quercetin in rats. After fitting the data by software, the maximum blood concentration (Cmax) of quercetin–niacinamide cocrystals (1
2) was higher than that of quercetin crystals. In the in vivo experiments, HPLC was used to measure the plasma concentration of quercetin. We have initially established an appropriate analytical method of stabilization, accuracy, and sensitivity. The quercetin–nicotinamide cocrystals effectively increase the drug concentration of quercetin in rats. After fitting the data by software, the maximum blood concentration (Cmax) of quercetin–niacinamide cocrystals (1![[thin space (1/6-em)]](https://www.rsc.org/images/entities/char_2009.gif) :
:![[thin space (1/6-em)]](https://www.rsc.org/images/entities/char_2009.gif) 1) was 0.71 μg mL−1, and the area under the curve (AUC) was 15
1) was 0.71 μg mL−1, and the area under the curve (AUC) was 15![[thin space (1/6-em)]](https://www.rsc.org/images/entities/char_2009.gif) 216.63 (μg mL−1)·min. The drug concentration of insoluble drugs will be increased in vivo by the cocrystal method, and oral bioavailability will be improved.
216.63 (μg mL−1)·min. The drug concentration of insoluble drugs will be increased in vivo by the cocrystal method, and oral bioavailability will be improved.
5 Conclusion
In this study, we obtained quercetin–nicotinamide cocrystals via the solvent evaporation technique. The solid-state analysis suggests that quercetin–nicotinamide cocrystals are a new phase, and interactions of the intermolecular hydrogen bonds exist between quercetin and nicotinamide in quercetin–nicotinamide cocrystals. The dissolution of quercetin–nicotinamide cocrystals is found to be significantly improved in comparison to that of quercetin crystals. The pharmacokinetic experiment in rats affirms that quercetin–nicotinamide cocrystals improve the bioavailability of quercetin significantly. This study will mean that the drug cocrystal technology will be an available solid form to improve the dissolution and oral bioavailability of insoluble medicines and to expand the clinical applications of quercetin.Conflicts of interest
There are no conflicts to declare.References
- H. P. Hoensch and R. Oertel, The value of flavonoids for the human nutrition: short review and perspectives, Clin. Nutr. Exp., 2015, 3, 8–14 CrossRef.
- D. Aune, E. Giovannucci, P. Boffetta, L. T. Fadnes, N. Keum and T. Norat, et al., Fruit and vegetable intake and the risk of cardiovascular disease, total cancer and all-cause mortality-a systematic review and dose-response meta-analysis of prospective studies, Int. J. Epidemiol., 2017, 46(3), 1029–1056 CrossRef.
- A. W. Boots, G. R. Haenen and A. Bast, Health effects of quercetin: from antioxidant to nutraceutical, Eur. J. Pharmacol., 2008, 585, 325–337 CrossRef CAS.
- M. Russo, C. Spagnuolo, I. Tedesco, S. Bilotto and G. L. Russo, The flavonoid quercetin in disease prevention and therapy: facts and fancies, Biochem. Pharmacol., 2012, 83, 6–15 CrossRef CAS PubMed.
- S. Egert, S. Wolffram, A. Bosy-Westphal, C. Boesch-Saadatmandi, A. E. Wagner, J. Frank, G. Rimbach and M. J. Mueller, Daily quercetin supplementation dose-dependently increases plasma quercetin concentrations in healthy humans, J. Nutr., 2008, 138, 1615–1621 CrossRef CAS PubMed.
- D. D. Hou, W. Zhang, Y. L. Gao, Y. Z. Sun, H. X. Wang, R. Q. Qi, H. D. Chen and X. H. Gao, Anti-inflammatory effects of quercetin in a mouse model of MC903-induced atopic dermatitis, Int. Immunopharmacol., 2019, 74, 105676 CrossRef CAS PubMed.
- A. Murakami, H. Ashida and J. Terao, Multitargeted cancer prevention by quercetin, Cancer Lett., 2008, 269, 315–325 CrossRef CAS.
- Y. Guo and R. S. Brun, Endogenous and exogenous mediators of quercetin bioavailability, J. Nutr. Biochem., 2015, 26, 201–210 CrossRef CAS PubMed.
- V. Natarajan, N. Krithica, B. Madhan and K. Sehgal, Formulation and evaluation of quercetin polycaprolactone microspheres for the treatment of rheumatoid arthritis, J. Pharm. Sci., 2011, 1, 195–205 CrossRef PubMed.
- E. U. Graefe, H. Derendorf and M. Veit, Pharmacokinetics and bioavailability of the flavonol quercetin in humans, Int. J. Clin. Pharmacol. Therapeut., 1999, 37, 219–233 CAS.
- E. Sanchez-Rexach, J. Iturri, J. Fernandez, E. Meaurio, J. L. Toca-Herrera and J. R. Sarasua, Novel biodegradable and non-fouling systems for controlled-release based on poly(ε-caprolactone)/Quercetin blends and biomimetic bacterial S-layer coatings, RSC Adv., 2019, 9, 24154–24163 RSC.
- E. S. Kim, D. Y. Kim, J. S. Lee and H. G. Lee, Mucoadhesive Chitosan-Gum Arabic Nanoparticles Enhance the Absorption and Antioxidant Activity of Quercetin in the Intestinal Cellular Environment, J. Agric. Food Chem., 2019, 67, 8609–8616 CrossRef CAS PubMed.
- G. Kuminek, F. Cao, A. Bahia de Oliveira da Rocha, S. Gonçalves Cardoso and N. Rodríguez-Hornedo, Cocrystals to facilitate delivery of poorly soluble compounds beyond-rule-of-5, Adv. Drug Delivery Rev., 2016, 101, 143–166 CrossRef CAS PubMed.
- N. Shan and M. J. Zaworotko, The role of cocrystals in pharmaceutical science, Drug Discovery Today, 2008, 13, 440–446 CrossRef CAS PubMed.
- B. Sarma, J. Chen, H. Y. Hsi and A. S. Myerson, Solid forms of pharmaceuticals: polymorphs, salts and cocrystals, Korean J. Chem. Eng., 2011, 28, 315–322 CrossRef CAS.
- M. Karimi-Jafari, L. Padrela, G. M. Walker and D. M. Croker, Creating cocrystals: a review of pharmaceutical cocrystal preparation routes and applications, Cryst. Growth Des., 2018, 18, 6370–6387 CrossRef CAS.
- N. K. Duggirala, M. L. Perry, O. Almarsson and M. J. Zaworotko, Pharmaceutical cocrystals: along the path to improved medicines, Chem. Commun., 2016, 52(4), 640–655 RSC.
- S. J. Bethune, N. Schultheiss and J. O. Henck, Improving the poor aqueous solubility of nutraceutical compound pterostilbene through cocrystal formation, Cryst. Growth Des., 2011, 11(7), 2817–2823 CrossRef CAS.
- Z. Li and A. J. Matzger, Influence of coformer stoichiometric ratio on pharmaceutical cocrystal dissolution: three cocrystals of carbamazepine/4-aminobenzoic acid, Mol. Pharm., 2016, 13, 990–995 CrossRef CAS PubMed.
- A. J. Smith, P. Kavuru, L. Wojtas, M. J. Zaworotko and R. Douglas Shytle, Cocrystals of quercetin with improved solubility and oral bioavailability, Mol. Pharm., 2011, 8, 1867–1876 CrossRef CAS PubMed.
- A. Heinz, K. C. Gordon, C. M. McGoverin, T. Rades and C. J. Strachan, Understanding the solid-state forms of fenofibrate-A spectroscopic and computational study, Eur. J. Pharm. Biopharm., 2009, 71, 100–108 CrossRef CAS.
- M. Fujimori, K. Kadota, K. Shimono, Y. Shirakawa, H. Sato and Y. Tozuka, Enhanced solubility of quercetin by forming composite particles with transglycosylated materials, J. Food Eng., 2015, 149, 248–254 CrossRef CAS.
Footnote |
| † Electronic supplementary information (ESI) available. See DOI: 10.1039/d0ra03324c |
| This journal is © The Royal Society of Chemistry 2020 |

