
 Open Access Article
 This Open Access Article is licensed under a Creative Commons Attribution-Non Commercial 3.0 Unported Licence
Electrochromic Os-based metallo-supramolecular polymers: electronic state tracking by in situ XAFS, IR, and impedance spectroscopies†
Takefumi Yoshida a,
Manas Kumar Beraa,
Yemineni S. L. V. Narayanaa,
Sanjoy Mondala,
Hitoshi Abe*bcd and
Masayoshi Higuchi*a
a,
Manas Kumar Beraa,
Yemineni S. L. V. Narayanaa,
Sanjoy Mondala,
Hitoshi Abe*bcd and
Masayoshi Higuchi*a
aElectronic Functional Macromolecules Group, National Institute for Materials Science (NIMS), Tsukuba 305-0044, Japan. E-mail: HIGUCHI.Masayoshi@nims.go.jp
bInstitute of Materials Structure Science High Energy Accelerator Research Organization (KEK), 1-1 Oho, Tsukuba, Ibaraki 305-0801, Japan
cDepartment of Materials Structure Science, School of High Energy Accelerator Science, SOKENDAI (The Graduate University for Advanced Studies), 1-1 Oho, Tsukuba, Ibaraki 305-0801, Japan
dGraduate School of Science and Technology, Ibaraki University, 2-1-1 Bunkyo, Mito, Ibaraki 310-8512, Japan
First published on 29th June 2020
Abstract
In this study, the electronic states of Os-based metallo-supramolecular polymers (poly(OsL)2+) during electrochromism were tracked by in situ X-ray absorption fine structure (XAFS), infrared (IR), and impedance spectroscopies. The XAFS spectra suggested electronic charge migration in the polymer, and the in situ spectra revealed reversible changes caused by electrochemical redox reactions. The IR spectra of the polymers showed an IVCT band, and we also confirmed the reversible changes by applying a voltage to the redox cell. During the impedance measurements, we found a drastic decrease in the charge transfer resistance (RCT) of the polymer films near the electrochemical redox potential.
Introduction
Redox-active metal complexes are one of the important targets in the fields of materials science because they have various functions including conduction,1 catalysis,2 molecular magnetism,3 and electrochromism.4 Electrochromism is a phenomenon in which materials change their color as a result of electrochemical redox reactions. In order to understand the mechanism of electrochromism, it is important to track the oxidation state of the material. Cyclic voltammetry (CV), electron spin resonance (ESR), and X-ray absorption fine structure (XAFS) analysis are representative methods used to observe the electronic state of materials. Among the XAFS analysis methods, X-ray absorption near-edge structure (XANES) spectroscopy is useful to determine the oxidation and chemical states of metals5 and extended X-ray absorption fine structure (EXAFS) spectroscopy is useful to investigate the local structure around the ion.6 Liu and Wang have reported the electronic states of Co-based nanosheets.6a Moreover, Lin has reported the XANES and EXAFS spectra of catalytic metal–organic layers to reveal the electronic states and local structures of metal ions.6b Recently, in situ XAFS measurements have been conducted to investigate the catalytic reactions of metal oxides.7 In addition, impedance spectroscopy is important to determine the charge transfer resistance of materials for their applications such as in batteries or capacitors.8 Kawasoko has reported a low charge transfer resistance at the Li3PO4 electrolyte/Li(Ni0.5Mn1.5)O4 electrode interface and revealed that the inserted MgO layer was the origin of the impedance response.8a Recently, Siroma and Itou have suggested a transmission-line model (TLM) for porous systems.8b,8cMetallo-supramolecular polymers (MSPs)9 are prepared by the complexation of metal ions with multitopic organic ligands. These polymers have a coordination structure composed of alternating metal ions and ligands. Previously, we have reported the electrochromic (EC) properties of MSPs.4 The MSPs have received significant attention for application in non-volatile displays, such as electronic papers and smart windows, because they retain their changed color without the application of any voltage. Among transition metal ions, Fe2+ and Ru2+ ions are suitable for application as metal species in polymers because of their stable redox properties, which trigger electrochromism in polymers.4 Recently, we have also reported Os-based metallo-supramolecular polymers (poly(OsL)2+) and their EC properties.10 These EC properties originate by the redox reaction of metal ions; however, to date, we have confirmed this only by CV (the redox potential (E1/2): 0.94 V vs. Ag/Ag+). Herein, we selected poly(OsL)2+ among the reported MSPs and tracked their electronic states during electrochromism by in situ XAFS, IR, and impedance spectroscopies. XAFS spectroscopy at the Os L3-edge was carried out at the BL-9A and BL-12C beamline of the Photon Factory, High Energy Accelerator Research Organization (KEK).
Results and discussion
Tracking of EC changes by in situ XAFS spectroscopy
Herein, poly(OsL)2+ (Fig. 1a) was synthesized by the 1![[thin space (1/6-em)]](https://www.rsc.org/images/entities/char_2009.gif) :1 complexation of an osmium salt, (NH4)2OsCl6, with bis(terpyridyl)benzene (L) according to our previous study.10 As (NH4)2OsCl6 was used in the polymerization, it is considered that the original oxidation state of the metal complex is divalent and the counter anions in the obtained polymer are 2 Cl− ions. Poly(OsL)2+ was obtained by the treatment of (NH4)2OsCl6 with the counter anion ClO4−, as described later. In the UV-vis spectrum of methanol solution, the singlet and triplet metal-to-ligand charge transfer absorptions appeared at 511.2 and 677 nm, respectively. The color of poly(OsL)2+ is pale pink. The polymer displayed EC changes, and the color of the oxidized polymer poly(OsL)3+ is yellow green.10 As the ClO4− anions compensate the change in the charges during redox reactions, poly(OsL)3+ includes three ClO4− anions.
:1 complexation of an osmium salt, (NH4)2OsCl6, with bis(terpyridyl)benzene (L) according to our previous study.10 As (NH4)2OsCl6 was used in the polymerization, it is considered that the original oxidation state of the metal complex is divalent and the counter anions in the obtained polymer are 2 Cl− ions. Poly(OsL)2+ was obtained by the treatment of (NH4)2OsCl6 with the counter anion ClO4−, as described later. In the UV-vis spectrum of methanol solution, the singlet and triplet metal-to-ligand charge transfer absorptions appeared at 511.2 and 677 nm, respectively. The color of poly(OsL)2+ is pale pink. The polymer displayed EC changes, and the color of the oxidized polymer poly(OsL)3+ is yellow green.10 As the ClO4− anions compensate the change in the charges during redox reactions, poly(OsL)3+ includes three ClO4− anions.
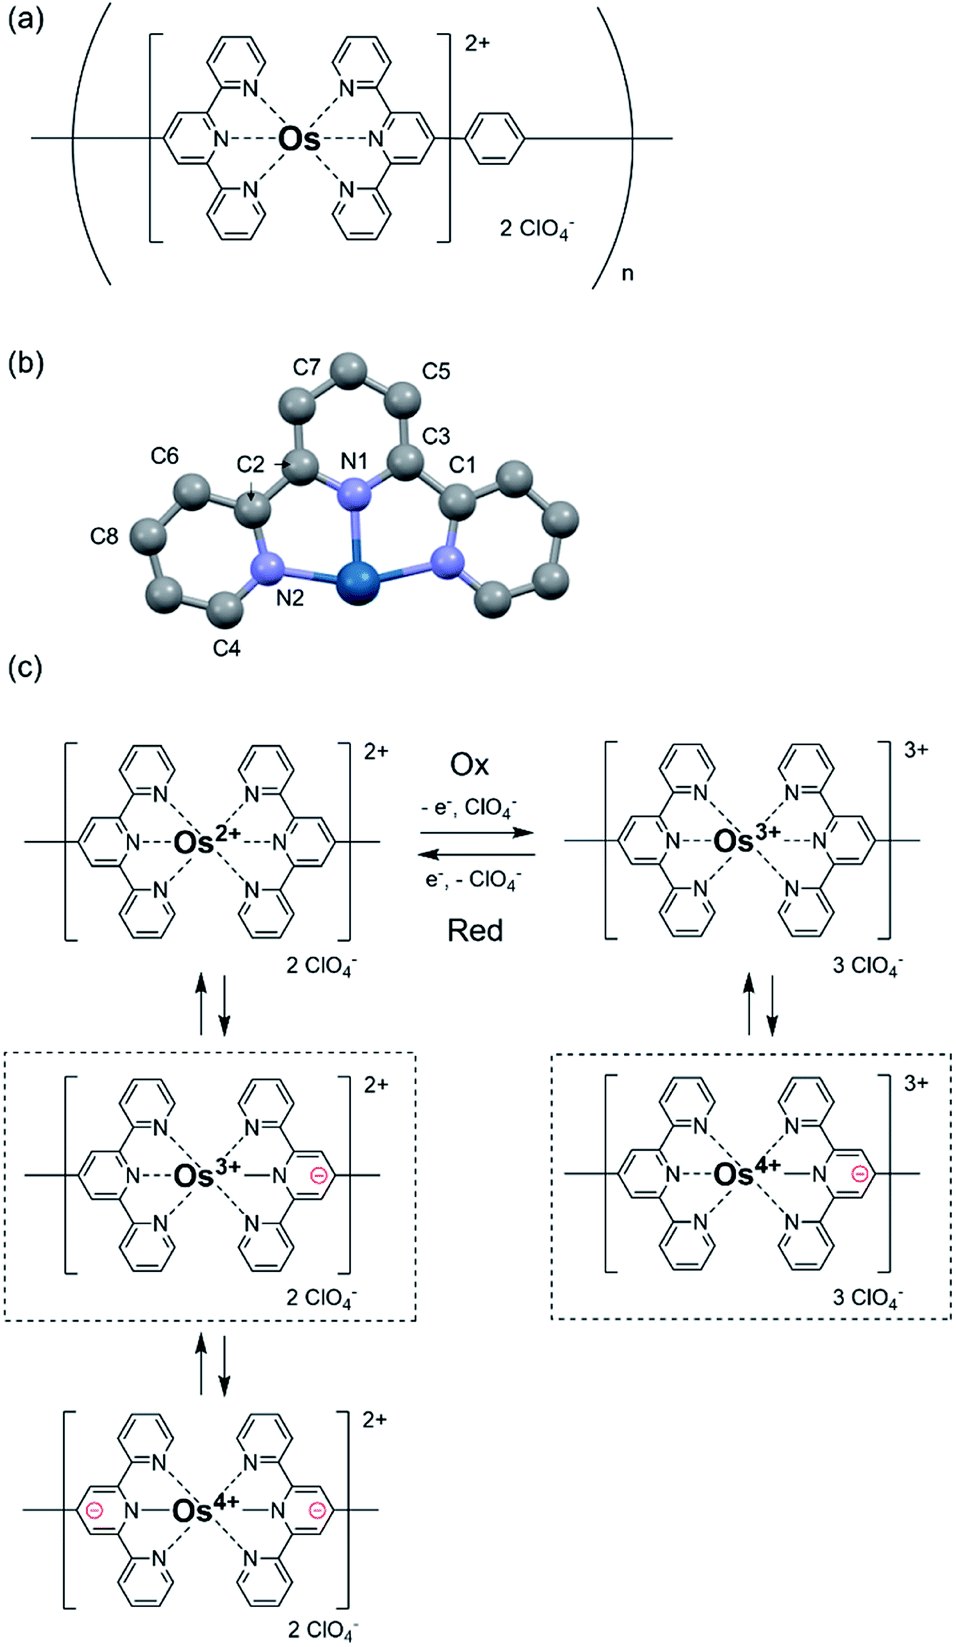 | ||
| Fig. 1 (a) The molecular structure of poly(OsL)2+. (b) The crystal structure of half of the Os complex. (c) The expected schematic for electronic charge migration in poly(OsL)2+ and poly(OsL)3+. The complexes poly(OsL)2+ and poly(OsL)3+ highlighted with a dot frame have the major oxidation states of Os ions, as suggested by in situ XAFS spectroscopy. | ||
Before performing in situ XAFS spectroscopy, we obtained the XAFS spectra of the standard samples by the transmittance method to confirm the position of the white line of both Os3+ and Os4+ ions (10873.3 eV and 10874.3 eV, respectively). In addition, in the EXAFS region, the fitting of the crystal structure of the reported Os complex (Fig. 1b) revealed that the Os–N coordination bond lengths in poly(OsL)2+ are 2.020 and 2.059 Å (R-factor; 1.0%, Table 1, EXAFS) (EXAFS oscillation and the Fourier transform spectra of EXAFS are shown in Fig. S1, ESI†). These values are similar to the Os–N distances determined in the crystal structure. These results suggested that the Os ion of poly(OsL)2+ has an octahedral coordination structure.11 Next, for conducting in situ XAFS spectroscopy, we constructed a redox cell, as shown in Fig. 2a and c, with a poly(OsL)2+ film (working area: 2 × 2.5 cm) on an ITO glass (8 Ω sq−1, 2.5 × 2.5 cm). The polymer film was prepared by spray coating a methanol solution of poly(OsL)2+ (5 mg ml−1, mass concentration of the Os ion was ∼20%) on the ITO glass. The polymer film was washed with a 0.1 M acetonitrile solution of LiClO4 to change the counter anion from Cl− to ClO4−, as shown in Fig. 1a. We used the polymer-coated ITO glass as a working electrode, the 0.1 M acetonitrile solution of LiClO4 as an electrolyte solution, a Pt wire as a counter electrode, and Ag/Ag+ as a reference electrode. We replaced the quartz cuvette with Uni-Pak (zipper bag) and maintained the distance between the poly(OsL)2+ film and Uni-Pak or the thickness of the electrolyte at less than 1 mm to decrease the absorption of both the cell and the electrolyte. Then, we measured the XAFS spectra of the original-state poly(OsL)2+ and the oxidized-state poly(OsL)3+ in the fluorescence yield mode using a Lytle detector by applying a potential of 0 V and 0.9 V vs. Ag/Ag+ (ref. 10) to the redox cell (Fig. 2b and d), respectively.
| R-Factor: 1.0% | N | R/Å | Reff | Δ |
|---|---|---|---|---|
| N1 | 2 | 2.020 | 1.972 | 0.0485 |
| N2 | 4 | 2.059 | 1.999 | −0.0603 |
| C1 | 1 | 2.872 | 2.868 | 0.0042 |
| C2 | 6 | 2.926 | 2.901 | 0.0244 |
| C3 | 1 | 2.841 | 2.934 | −0.0928 |
| C4 | 4 | 3.032 | 3.059 | −0.0269 |
| C5 | 4 | 4.350 | 4.205 | 0.1445 |
| C6 | 4 | 4.287 | 4.248 | −0.0385 |
| C7 | 2 | 4.852 | 4.733 | 0.1190 |
| C8 | 4 | 5.043 | 4.822 | 0.2209 |
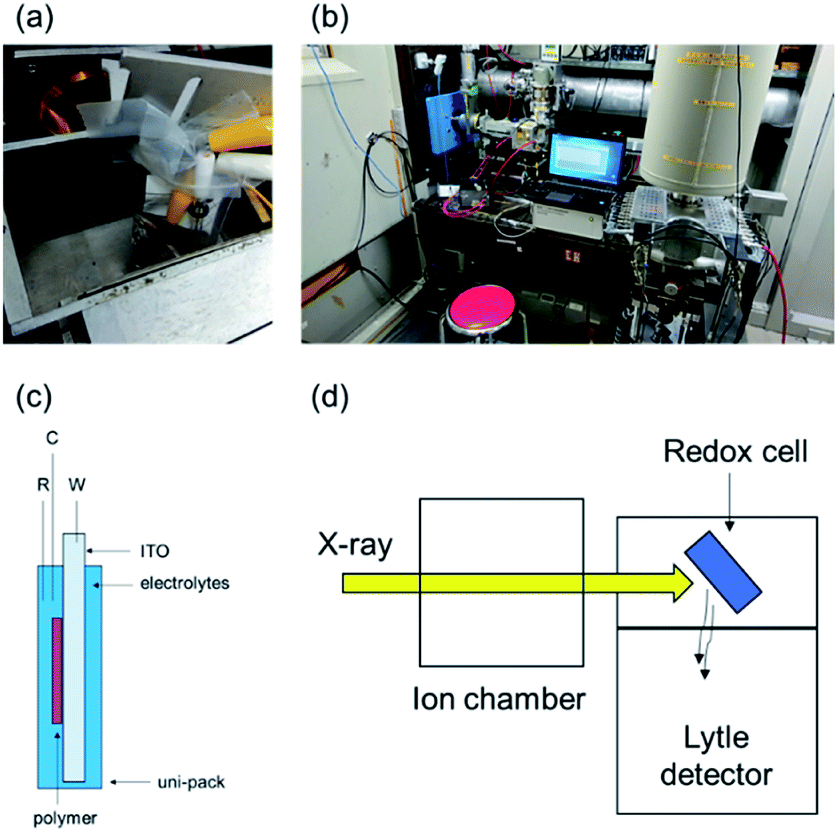 | ||
| Fig. 2 (a) An image of the redox cell. (b) An image of the set up used for in situ XAFS spectroscopy. (c) The redox cell structure (polymer: a poly(OsL)2+ film, W: working electrode (ITO), C: counter electrode (Pt wire), R: reference electrode (Ag/Ag+)), and electrolyte: a 0.1 M acetonitrile solution of (LiClO4). (d) A schematic of the measurement. | ||
The in situ XAFS spectra of poly(OsL)2+ are shown in Fig. 3a. The position of the white line in the XANES region represents the oxidation state of the metal atom. The white line of OsCl3 is at 10873.3 eV and that of a poly(OsL)2+ pellet is at 10873.9 eV. Interestingly, these results suggest that the oxidation state of the osmium ion in poly(OsL)2+ is Os3+ or higher.12 However, a divalent state is strongly suggested in many complexes synthesized using Os2+ salts.13 Therefore, we speculate that the direct detection of an Os3+ species in the XAFS spectrum was caused by electronic charge migration, such as the formation of Os3+·[terpyridine]−, inside the metal complex moieties of poly(OsL)2+ (Fig. 1c).
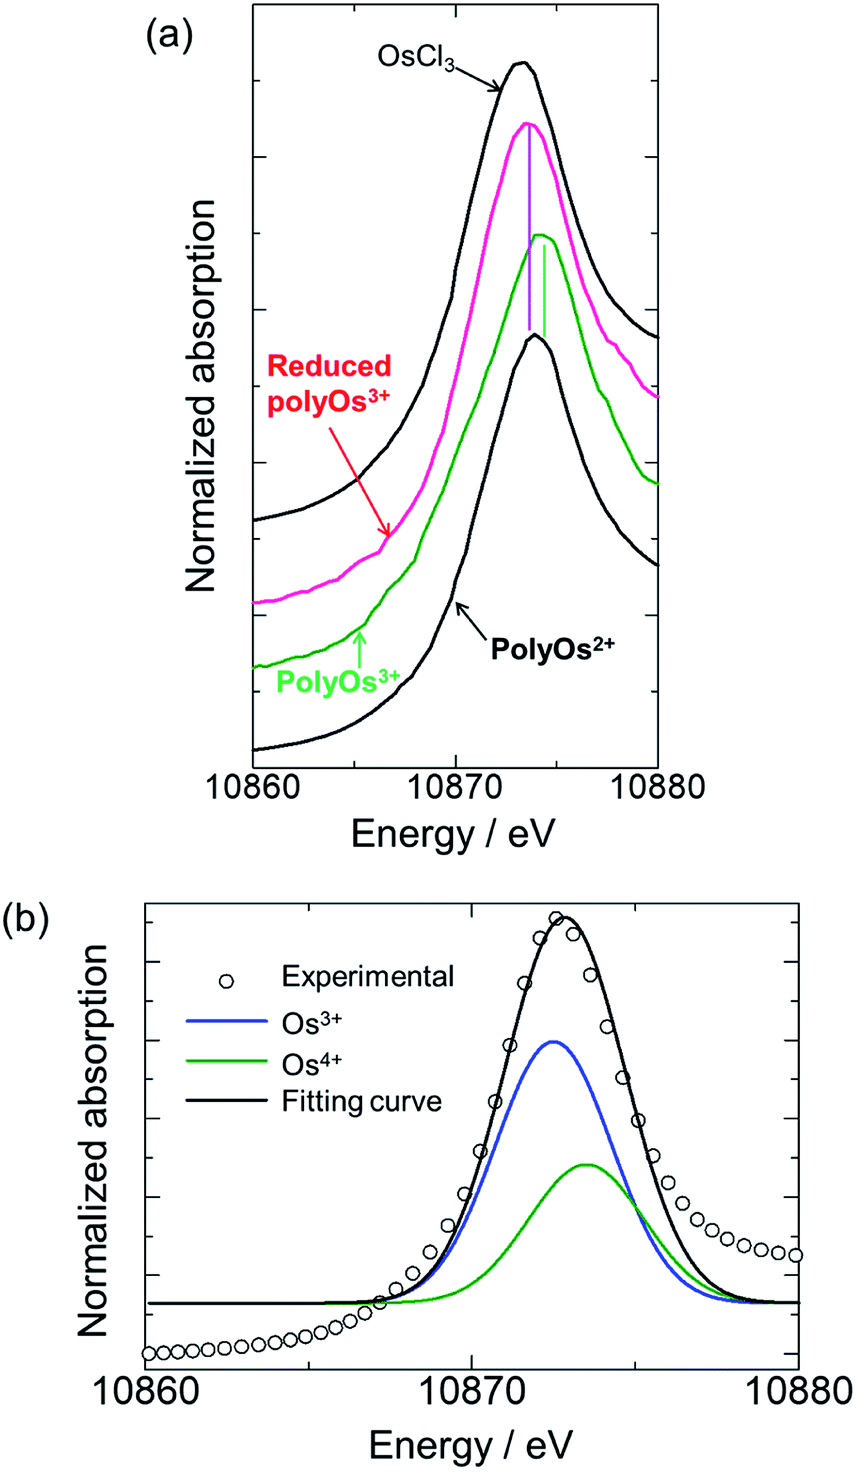 | ||
| Fig. 3 XAFS spectra at the Os L3-edge (a) XANES spectra: black: references (OsCl3 and poly(OsL)2+), green: poly(OsL)3+ at 0.9 V, and pink: reduced poly(OsL)3+ at 0.0 V. (b) The XANES data analysis of poly(OsL)2+ by a curve fitting method. | ||
Furthermore, when the polymer was oxidized to poly(OsL)3+ by applying an oxidation potential (0.9 V vs. Ag/Ag+), the white line moved to a further higher-energy region (10874.2 eV). It has been reported that the energy difference between Os3+ and Os4+ is about 1 eV.14 As the white line of Os3+ appeared at 10873.3 eV in the spectrum, the observed value of 10874.3 eV represents the white line of Os4+. According to our consideration that the Os3+ species is observed in poly(OsL)2+, the observation of Os4+ suggests the formation of poly(OsL)3+. In contrast, when a reduction potential (0.0 V vs. Ag/Ag+) was applied to the poly(OsL)3+ film, the white line returned to 10873.5 eV. This indicates that the Os4+ ions of poly(OsL)3+ were again electrochemically reduced to Os3+. We changed the applied potentials (0.0 and 0.9 V vs. Ag/Ag+) for five times and confirmed the repeatability of the spectral changes.
The electronic states of poly(OsL)2+, poly(OsL)3+, and electrochemically reduced poly(OsL)3+ were further analyzed by curve fitting the spectra with the two peaks of 10873.3 eV (Os3+) and 10874.3 eV (Os4+). The fitting profile of poly(OsL)2+ is shown in Fig. 3b. The results of peak separation are summarized in Table 2, which reveal that both Os3+ and Os4+ exist in the polymers. However, the ratio of Os3+ to Os4+ was different among the polymers. In poly(OsL)2+, the proportion of Os3+ is major (64%). On the other hand, Os4+ is prominent in poly(OsL)3+. In electrochemically reduced poly(OsL)3+, the ratio of Os3+ to Os4+ was similar to that in poly(OsL)2+. These results support that poly(OsL)3+ is electrochemically reduced to original poly(OsL)2+.
873.3 eV) to Os4+ (10874.3 eV) calculated by curve fitting the XAFS spectra of poly(OsL)2+, poly(OsL)3+, and electrochemically reduced poly(OsL)3+
| Poly(OsL)2+ | Poly(OsL)3+ | Reduced poly(OsL)3++ | |
|---|---|---|---|
| Os3+ | 0.64 | 0.16 | 0.60 |
| Os4+ | 0.36 | 0.84 | 0.40 |
Tracking of EC changes by IR measurements
The electronic charge migration shown in Fig. 1c was also supported by the IR spectrum of poly(OsL)2+ (Fig. S2 and ESI†). The large absorption band at ∼3300 cm−1 (∼0.41 eV) in the spectrum of poly(OsL)2+ (Fig. 4a) can be attributed to the inter-valence charge transfer (IVCT) between Os3+ and Os4+ in poly(OsL)2+ (In the spectrum, the band at 3180 cm−1 is assigned to the used KCl pellet). The fine modulation at 3600–3900 cm−1 is due to water vapors in the air. We used the spectrum of ITO as the background spectrum; however, there is a small influence of ITO because of scattering. In order to exclude “arbitrariness”, the spectrum was not treated by any baseline corrections or smoothing.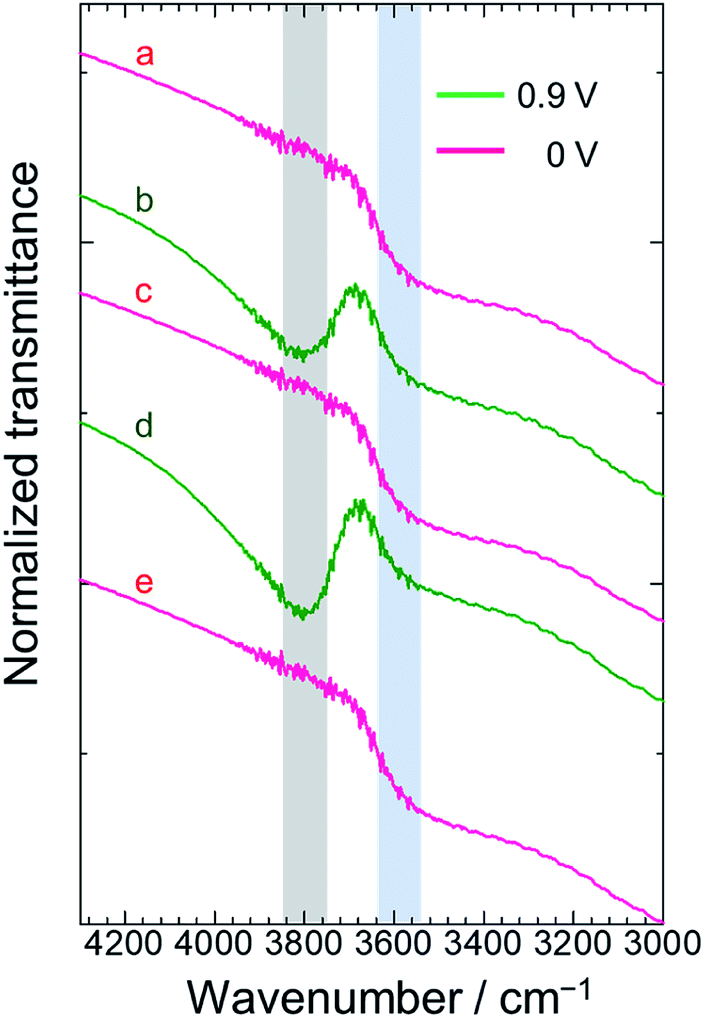 | ||
| Fig. 4 IR spectra of (a) poly(OsL)2+ and (b–e) the polymer film repeatedly oxidized/reduced at 0.9 V or 0 V vs. Ag/Ag+, respectively. ((b) The first oxidation to poly(OsL)3+; (c) the reduction of (b); (d) the second oxidation of (c); and (e) the reduction of (d)). | ||
In order to obtain further evidence of IVCT, we measured the IR spectrum of poly(OsL)3+ prepared by the electrochemical oxidation of poly(OsL)2+ as follows. The poly(OsL)2+ film on the ITO glass was oxidized to poly(OsL)3+ by applying an oxidation potential (0.9 V vs. Ag/Ag+) to the redox cell until the film changed from pale pink to yellow green. Then, the polymer film was taken out from the cell and washed with acetonitrile. The yellow green color of the polymer film confirms that the oxidation state was retained even after the washing step. The IR spectrum of the obtained poly(OsL)3+ film in the range of 3000–4300 cm−1 is shown in Fig. 4b. Interestingly, a new peak appeared around 3800 cm−1 (∼0.47 eV) in the spectrum. The slightly higher energy band than the IVCT band of poly(OsL)2+ could be assigned to the inter-polymer IVCT through the counter anion (ClO4−) because poly(OsL)3+ has 1.5 times more counter anions than poly(OsL)2+ to maintain the charge balance. Then, the poly(OsL)3+ film was again reduced at 0.0 V vs. Ag/Ag+. The spectrum of poly(OsL)3+ after reduction (Fig. 4c) was quite similar to that of original poly(OsL)2+. By varying the oxidation state of the polymer film for four times (Fig. 4b–e), we confirmed the repeatability of the IR spectral changes. Although electrochemical IR measurement itself is a general method,15 this is the first report where IR spectral changes were observed during electrochromism in MSPs.
Tracking of EC changes by impedance spectroscopy
For the further investigation of the EC properties of poly(OsL)2+, we tracked the impedance response. At first, we measured the impedance spectra of a poly(OsL)2+ pellet using a two-probe method without applying any DC voltage. The impedance response at various temperatures is shown in Fig. 5. The ion conductivities of the polymer pellet at 25, 35, 45, 55, 65, and 75 °C and 50% RH (same as the ambient atmosphere) were calculated to be 3.00 × 10⁻⁷, 4.38 × 10⁻⁷, 5.80 × 10⁻⁷, 7.28 × 10⁻⁷, 8.72 × 10⁻⁷, and 1.28 × 10⁻⁶ S cm−1, respectively, by the x-axis intercept of the semicircle at higher frequencies (Table S1 and ESI†). The activation energy for the ion conductivity was calculated to be 0.24 eV by Arrhenius plots (Fig. S3 and ESI†). This value was significantly smaller than that of an Fe-based MSP, poly(FeL)2+ (cf. 2.5 eV).16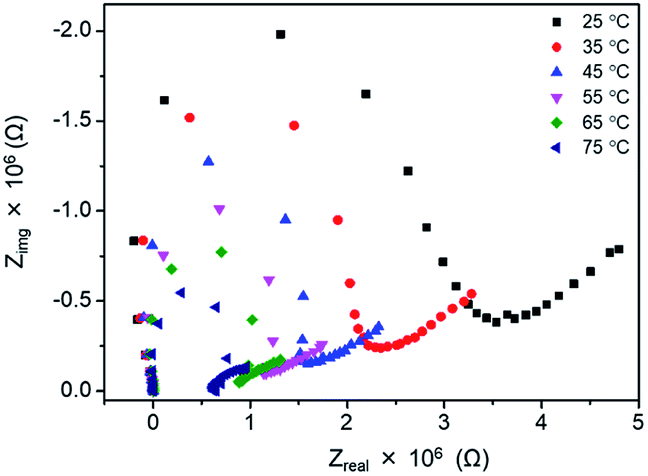 | ||
| Fig. 5 Nyquist plots of poly(OsL)2+ at various temperatures and 50% RH. | ||
Next, we investigated the effect of deuterium on the ion conductivity. We immersed a pellet of poly(OsL)2+ in both H2O (control) and D2O (replacing H2O with D2O) for 30 min to prepare poly(OsL)2+H and poly(OsL)2+D. Then, the ion conductivity was measured at RT (Fig. S4 and S5, ESI†). The ion conductivities of poly(OsL)2+H and poly(OsL)2+D were calculated to be 2.07 × 10⁻⁵ and 3.67 × 10⁻⁶ S cm−1, respectively, by the Nyquist plots. These results indicate that the hydrogen atoms of water molecules act as ion carriers.
Next, we investigated the impedance changes of the polymer pellet by applying 1.0 V; however, we observed only a noisy signal because of the low electronic conductivity of the polymer. Therefore, we prepared a poly(OsL)2+ film on an ITO glass and measured its impedance response using the three-probe method at liquid–solid interfaces (open-Q) and various potentials (0.0–1.2 V vs. Ag/Ag+) with a 10 mV AC amplitude (the same setup as the redox cell used for XAFS spectroscopy). Herein, we used a transmission-line model (Fig. 6 and 7a).8 The impedance responses of poly(OsL)2+ at liquid–solid interfaces are shown in Fig. 7b and S6, ESI.† The ionic resistivity (Rion) and resistivity of the electrolyte (Rsol) were calculated to be 68.8 and 80.5 Ω cm2, respectively. These values are constant in this system. In the range of 0.0–0.6 V vs. Ag/Ag+ at a 10 mV AC amplitude, the slope of the Nyquist plots gradually declines and shows a semicircle because of the decrease in the charge-transfer resistance (RCT). On the other hand, in the range of 0.6–1.2 V vs. Ag/Ag+ at a 10 mV AC amplitude, the slope of the Nyquist plots gradually increases because of the increase in RCT. At 0.6 V, there are two semicircles of electron resistivity (Re) and RCT. The Re is composed of the resistivity of the polymer itself (Re_polymer), the resistivity raised from the ordering of polymer chains (Re_order (if there are many junctions among the polymer chains, it will increase. Herein, it is almost dominant in Re)), and the resistivity of the capacitor. The Re_order was calculated to be 28 Ω cm2. The values of RCT at 0.3–0.8 V vs. Ag/Ag+ were calculated to be 547, 149, 196, 137, 196, and 839 Ω cm2 using the semicircle (Fig. 7c). These values are as high as the values (∼200–2000 Ω cm2) reported for the electrode/solid electrolyte interface.17 To investigate the relationship with the EC change, we measured the UV-vis spectra of the polymer film at various potentials (Fig. 7d). There is no difference between the transmittance at 500 nm in the ranges of 0.0–0.5 V and 0.7–0.9 V vs. Ag/Ag+, whereas large spectral changes occurred in the range of 0.5–0.7 V vs. Ag/Ag+. These large changes in the abovementioned range are consistent with the charge transfer process occurring during electrochromism. Remarkably, there is no difference between the transmittance at 500 nm; however, we observed a charge transfer process especially at 0.3 V, 0.4 V, and 0.8 V. These phenomena indicate that poly(OsL)2+ and poly(OsL)3+ already have different oxidation states of osmium ions (Os3+ and Os4+) in them due to electron migration, which is shown in Fig. 1c.
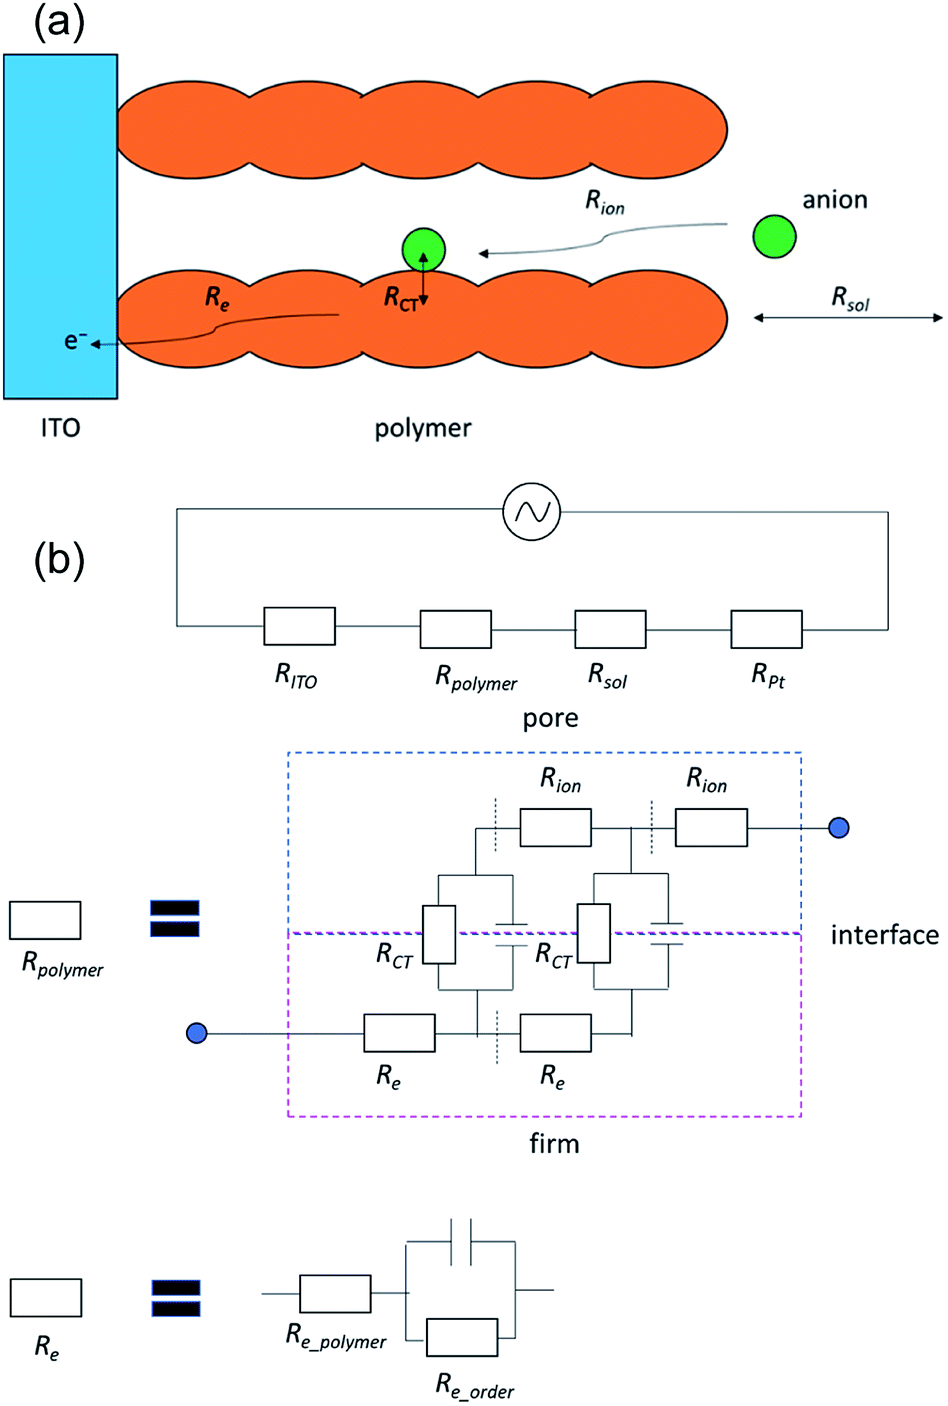 | ||
| Fig. 6 (a) The transmission-line model. (b) Circuits for the transmission-line model. | ||
 | ||
| Fig. 7 (a) The model of impedance responses. (b) Impedance responses of a poly(OsL)2+ film on an ITO glass at 0.3–0.8 V vs. Ag/Ag+. (c) The RCT at various potentials. (d) UV-vis spectra of a polyOs film on an ITO glass at 0.5–0.9 V vs. Ag/Ag+. | ||
Conclusions
In summary, we established a method to track the electronic states of MSPs during electrochromism by in situ XAFS, IR, and impedance spectroscopies. The XAFS spectra suggested electronic charge migration in the Os-based metallo-supramolecular polymers (poly(OsL)2+) and the reversible changes caused by the electrochemical redox reactions. The IR spectra showed the IVCT band attributed to the electronic charge migration in the polymer, and the reversible changes were confirmed by applying a voltage to the redox cell. The impedance spectra revealed a drastic decrease in the charge transfer resistance (RCT) of the polymer film around the electrochemical redox potential. These techniques are widely applicable to other redox-active MSPs and metal complexes.Experimental
Preparation of poly(OsL)2+
Poly(OsL)2+ was synthesized by the same procedure as reported in the literature.10 The polymer film (working area 2 cm × 2.5 cm) on ITO (8 Ω sq−1, 2.5 cm × 2.5 cm) was prepared by a spray coating method using 5 mg ml−1 of a methanol solution of Poly(OsL)2+.XAFS spectroscopy
XAFS spectroscopy was carried out at the BL-9A (energy: 2.1–15 keV, energy resolution: ΔE/E ∼ 2 × 10⁻⁴ (9 keV), photon flux at sample position: 6 × 10¹¹ phs per s (7 keV), monochromator: Si(111) water-cooled double crystal, focusing mirror: double bent conical mirror (Rh coated), beam size (FWHM): 0.5 mm × 0.3 mm), BL-12C (energy: 4–23 keV, energy resolution: ΔE/E ∼ 2 × 10⁻⁴, photon flux at sample position: 9 × 10¹⁰ phs per s (8 keV), monochromator: Si(111), focusing mirror: double bent conical mirror (Rh coated), beam size (FWHM): 0.6 mm × 0.5 mm) beamline of the photon factory (ring energy: 2.5 GeV, max. current: 450 mA (usually top-up operation), critical energy: 4 keV, horizontal acceptance: 3 mrad), High Energy Accelerator Research Organization (KEK) (the edge position was calibrated by that of the Os metal powder and Pt foil). Analysis was performed using the Demeter software platform. We used the reported crystal data for calculating Feff.9Spectroscopy
FTIR spectra were acquired using the FTIR-8400S infrared spectrophotometer. UV-vis spectra were obtained by an Ocean spectrometer (Ocean Optics, Inc.).Electrochemistry
The Solartron 1260 Impedance gain/phase analyser coupled with the Solartron 1296 dielectric interface and Princeton Applied Research VersaSTAT 4 were used for the impedance spectroscopy. Working electrode: ITO, counter electrode: Pt wire, reference electrode: Ag/Ag+, and supporting electrolyte: 0.1 M MeCN solution of LiClO4.Conflicts of interest
There are no conflicts to declare.Acknowledgements
This research was financially supported by the JST-CREST project (grant number: JPMJCR1533) and TIA “Kakehashi” program. The X-ray absorption fine structure was investigated at the BL-9A, 12C beamline in the Photon Factory of High Energy Accelerator Research Organization (KEK, Proposal No. 2019G117, 2017P016, No. 2017PF-04).Notes and references
- (a) K. Wada, K. Sakaushi, S. Sasaki and H. Nishihara, Angew. Chem., Int. Ed., 2018, 57, 8886–8890 CrossRef CAS PubMed; (b) L. S. Xie, L. Sun, R. Wan, S. S. Park, J. A. DeGayner, C. H. Hendon and M. Dincă, J. Am. Chem. Soc., 2018, 140, 7411–7414 CrossRef CAS PubMed.
- (a) A. Li, H. Ooka, N. Bonnet, T. Hayashi, Y. Sun, Q. Jiang, C. Li, H. Han and R. Nakamura, Angew. Chem., Int. Ed., 2019, 58, 5054–5058 CrossRef CAS PubMed; (b) S. Lin, P. M. Usov and A. J. Morris, Chem. Commun., 2018, 54, 6965–6974 RSC.
- J. Tong, S. Demeshko, M. John, S. Dechert and F. Meyer, Inorg. Chem., 2016, 55, 4362–4372 CrossRef CAS PubMed.
- (a) M. Higuchi and D. G. Kurth, Chem. Rec., 2007, 7, 203–209 CrossRef CAS PubMed; (b) F. Han, M. Higuchi and D. G. Kurth, J. Am. Chem. Soc., 2008, 130, 2073–2081 CrossRef CAS PubMed; (c) B.-H. Chen, S.-Y. Kao, C.-W. Hu, M. Higuchi, K.-C. Ho and Y.-C. Liao, ACS Appl. Mater. Interfaces, 2015, 7, 25069–25076 CrossRef CAS PubMed; (d) M. Higuchi, J. Mater. Chem. C, 2014, 2, 9331–9341 RSC; (e) C.-W. Hu, T. Sato, J. Zhang, S. Moriyama and M. Higuchi, J. Mater. Chem. C, 2013, 1, 3408–3413 RSC.
- H. Abe, Y. Niwa, M. Kitano, Y. Inoue, T. Yokoyama, M. Hara and H. Hosono, Bull. Chem. Soc. Jpn., 2017, 90, 963–965 CrossRef CAS.
- (a) Z. Chen, Y. Song, J. Cai, X. Zheng, D. Han, Y. Wu, Y. Zang, S. Niu, Y. Liu, J. Zhu, X. Liu and G. Wang, Angew. Chem., Int. Ed., 2018, 57, 5076–5080 CrossRef CAS PubMed; (b) Z. Lin, N. C. Thacker, T. Sawano, T. Drake, P. Ji, G. Lan, L. Cao, S. Liu, C. Wang and W. Lin, Chem. Sci., 2018, 9, 143–151 RSC; (c) A. Garai, S. Sobottka, R. Schepper, W. Sinha, M. Bauer, B. Sarkar and S. Kar, Chem.–Eur. J., 2018, 24, 12613–12622 CrossRef CAS PubMed; (d) H. Ohtsu, T. D. Bennett, T. Kojima, D. A. Keen, Y. Niwa and M. Kawano, Chem. Commun., 2017, 53, 7060–7063 RSC.
- (a) M. W. Kanan, J. Yano, Y. Surendranath, M. Dincă, V. K. Yachandra and D. G. Nocera, J. Am. Chem. Soc., 2010, 132, 13692–13701 CrossRef CAS PubMed; (b) S. R. Bare, S. D. Kelly, B. Ravel, N. Greenlay, L. King and G. E. Mickelson, Phys. Chem. Chem. Phys., 2010, 12, 7702–7711 RSC.
- (a) H. Kawasoko, S. Shiraki, T. Suzuki, R. Shimizu and T. Hitosugi, ACS Appl. Mater. Interfaces, 2018, 10, 27498–27502 CrossRef CAS PubMed; (b) Z. Siroma, N. Fujiwara, S. Yamazaki, M. Asahi, T. Nagai and T. Ioroi, Electrochim. Acta, 2015, 160, 313–322 CrossRef CAS; (c) N. Ogihara and Y. Itou, R&D Rev. Toyota CRDL, 2017, 48, 17–24 Search PubMed; (d) N. U. Day, M. G. Walter and C. C. Wamser, J. Phys. Chem. C, 2015, 119, 17378–17388 CrossRef CAS; (e) N. Ogihara, S. Kawauchi, C. Okuda, Y. Itou, Y. Takeuchi and Y. Ukyo, J. Electrochem. Soc., 2012, 159, A1034–A1039 CrossRef CAS.
- (a) J. B. Beck and S. J. Rowan, J. Am. Chem. Soc., 2003, 125, 13922–13923 CrossRef CAS PubMed; (b) A. Winter and U. S. Schubert, Chem. Soc. Rev., 2016, 45, 5311–5357 RSC.
- M. K. Bera, C. Chakraborty, U. Rana and M. Higuchi, Macromol. Rapid Commun., 2018, 39(1-6), 1800415 CrossRef PubMed.
- D. C. Craig, M. L. Scudder, W.-A. McHale and H. A. Goodwin, Aust. J. Chem., 1998, 51, 1131 CrossRef CAS.
- Y. Takahashi, T. Uruga, K. Suzuki, H. Tanida, Y. Terada and K. H. Hattori, Geochim. Cosmochim. Acta, 2007, 71, 5180–5190 CrossRef CAS.
- (a) B. Happ, A. Winter, M. D. Hager and U. S. Schubert, Chem. Soc. Rev., 2012, 41, 2222–2255 RSC; (b) M.-J. Sun, J.-Y. Shao, C.-J. Yao, Y.-W. Jhong and J. Yao, Inorg. Chem., 2015, 54, 8136–8147 CrossRef CAS PubMed; (c) F. Barigelletti, L. Flamigni, M. Guardigli, A. Juris, M. Beley, S. Chodorowski-Kimmes, J.-P. Collin and J.-P. Sauvage, Inorg. Chem., 1996, 35, 136–142 CrossRef CAS PubMed; (d) J.-Y. Shao and Y.-W. Zhong, Inorg. Chem., 2013, 52, 6464–6472 CrossRef CAS PubMed; (e) M. Lahav and M. E. van der Boom, Adv. Mater., 2018, 1706641 CrossRef PubMed.
- Y. Yamashita, Y. Takahashi, H. Haba, S. Enomoto and H. Shimiz, Geochim. Cosmochim. Acta, 2007, 71, 3458–3475 CrossRef CAS.
- (a) H. Wang, Y.-W. Zhou and W.-B. Cai, Curr. Opin. Electrochem., 2017, 1, 73–79 CrossRef CAS; (b) Y. Tanaka, M. Ono and M. Akita, J. Porphyrins Phthalocyanines, 2015, 19, 442–450 CrossRef CAS.
- R. K. Pandey, M. D. Hossain, T. Sato, U. Rana, S. Moriyama and M. Higuchi, RSC Adv., 2015, 5, 49224–49230 RSC.
- (a) C. Yada, A. Ohmori, K. Ide, H. Yamasaki, T. Kato, T. Saito, F. Sagane and Y. Iriyama, Adv. Energy Mater., 2014, 4, 1301416 CrossRef; (b) J. Li, C. Ma, M. Chi, C. Liang and N. Dudney, Adv. Energy Mater., 2015, 5, 1401408 CrossRef.
Footnote |
| † Electronic supplementary information (ESI) available. See DOI: 10.1039/d0ra03236k |
| This journal is © The Royal Society of Chemistry 2020 |