
 Open Access Article
 This Open Access Article is licensed under a Creative Commons Attribution-Non Commercial 3.0 Unported Licence
A novel critical control point and chemical marker identification method for the multi-step process control of herbal medicines via NMR spectroscopy and chemometrics†
Fang Zhao‡
,
Wenzhu Li‡,
Jianyang Pan,
Zeqi Chen and
Haibin Qu *
*
Pharmaceutical Informatics Institute, College of Pharmaceutical Sciences, Zhejiang University, Hangzhou 310058, PR China. E-mail: quhb@zju.edu.cn; Tel: +86-571-88208428
First published on 23rd June 2020
Abstract
Herbal medicines have played a vital role in maintaining the health of the world population in the past thousands of years, and have proved to be an effective therapy. It is important to improve our understanding of the effects of the multi-step processing in herbal medicines on the chemical changes to ensure product quality. A proton nuclear paramagnetic resonance (1H NMR)-based evaluation strategy was developed for an efficient process variation exploration and diversified metabolite identification. In this study, 48 process intermediates from 6 commercial batches of the multi-step manufacturing chain of Danshen processing were obtained. Hierarchical classification analysis (HCA) tree based on 1H NMR spectra clustered the samples according to the processing steps, which indicates that 1H NMR has the potential capability for critical control point identification based on its adequate information of the organic compounds. Then, principal component analysis (PCA) and orthogonal partial least squares-discriminant analysis (OPLS-DA) were applied to distinguish the major metabolite differences between the intermediates before and after the critical control point. In this case, the alkali-isolation and acid-dissolution method was recognized as the most critical process in the multi-step chain of Danshen extract manufacturing. Potential metabolites with the larger amplitude of variation and contributing the most to the discrimination were found to be potential quality markers by S-plot, including several previously undetected amino acids. The results in this study are consistent with previous research studies and reference experiments conducted with other analytical tools. Taken together, they prove that 1H NMR with chemometrics is a very effective process quality control tool to provide comprehensive information on the chemical changes during the processing of herbal medicines, and help with the identification of critical control points and potential critical quality markers.
1. Introduction
Herbal medicines have played a vital role in maintaining the health of the world population in the past thousands of years as a safe and effective therapy with low cost.1 The herbal medicine production process consists of a number of batch steps in the present industry. As each herbal medicine contains a large number of diverse compounds, one of the major challenges has been to track the chemical changes in each step. A typical herbal medicine production process includes extraction, concentration, purification and other steps. Nevertheless, the production processes usually induce chemical changes in the herbal medicine product. Therefore, a general understanding of the effects of processing on the chemical changes is important to ensure the quality of the products.Metabolite fingerprinting and profiling analysis has been used as a comprehensive measurement approach in medicinal plant research.2,3 In the study of herbal metabolomics, liquid chromatography-mass spectrometry (LC-MS), gas chromatography–mass spectrometry (GC-MS), nuclear magnetic resonance (NMR) and other kinds of spectroscopy methods are widely used in the acquisition of the fingerprints and identification of chemical markers.4–6 Among all the analytical methods, NMR stands out as a powerful technique that is able to monitor all types of chemical compounds containing the element hydrogen with a single experiment. NMR is non-destructive and possesses high-throughput analytical ability to provide a wealth of qualitative and quantitative information with no or straightforward pre-treatment.7,8 Due to the highly complex NMR datasets from herbal product matrices and the inherent similarity, applications of chemometric analysis to complement the analytical methods are necessary.9–11 NMR coupled with chemometric analysis has been used as a quick, accurate, efficient and robust methodology for the comprehensive analysis of herbal medicine research. These research studies reported the fingerprinting and profiling analysis as a quality consistency evaluation tool of both herbal preparation products and raw materials, but there are few studies describing the chemical changes during the processing of herbal medicines.12–15
This study was aimed to demonstrate the possibility of NMR spectroscopy to monitor the chemical changes in each step that take place in a typical herbal medicine production process. A commonly used herbal medicine, Salvia miltiorrhiza Radix et Rhizoma (Danshen in Chinese) was employed as a model. Danshen is a widely used cardiovascular-protecting herbal medicine in clinical practice, and has been studied widely over the years.16–18 The main active components of Danshen can be classified into two groups, the phenolic acids and diterpenoids. The phenolic acids are mainly salvianolic acid B, salvianic acid A, caffeic acid, rosmarinic acid and protocatechuic aldehyde, and the diterpenoids include tanshinone I and tanshinone II A.19 There have been several research perform analyses on the structural characterization, qualitative and quantitative analysis, degradation process and geographical origin of the Danshen and Danshen-containing preparations by NMR.20–24 In this work, we propose an NMR-based comprehensive analysis of Danshen extracts from batch steps. The chemical compositional changes resulting from a series of processing steps were characterized using 1H NMR spectra in coordination with chemometric analysis. First, different process intermediates will be clustered by a hierarchical classification analysis (HCA) tree to discriminate the critical control points. Then, principal component analysis (PCA) and orthogonal partial least squares-discriminant analysis (OPLS-DA) will be applied to identify the potential quality markers through screening the metabolites in the intermediates obtained before and after the critical control point.
2. Experimental
2.1. Reagents and materials
Deuterium oxide (D2O, 99.9 atom% D) containing 3-(trimethylsilyl) propionic-2,2,3,3-d4 acid sodium salt (TSP, 0.05 wt%). Ultrapure water was prepared using a Millipore Milli-Q System. Danshen extracts were collected from six batches of intermediates A–G manufactured at full commercial scale in Guizhou Baite Pharmaceutical Co., Ltd (Guiyang, China). All samples were stored at −20 °C until analysis. The detailed information of the intermediates was as follows (due to confidentiality reasons, the detailed process parameters cannot be shared.):Step 1. A prescribed amount of Danshen was extracted by the boiling water. Then, the water extract was filtered and collected. After that, the water extract was concentrated by heated steam to remove water until its density increased to the predetermined range. The last obtained concentrate was named as intermediate A.
Step 2. The alkali-isolation and acid-dissolution method was then applied to intermediate A. A solution of calcium hydroxide was added into intermediate A, and stirred for a period of time. Then, a sulfuric acid solution was added and stirred to make a suspension. After the suspension rested for a period of time, the supernatant was collected as intermediate B1 and B2 from different liquid levels.
Step 3. The first ethanol precipitation was conducted to intermediate B. During the process, an ethanol solution was added into intermediate B with continuous magnetic stirring. Then, the mixture was refrigerated for a period of time. After that, it was filtered by a vacuum frame-type filter. The obtained supernatant was concentrated to remove ethanol. The collected concentrate was named as intermediate C.
Step 4. Intermediate C was taken as the raw material of the second ethanol precipitation, which is the same as the first ethanol precipitation. The last collected concentrate was named as intermediate D.
Step 5. A prescribed amount of water was added into intermediate D to conduct the water precipitation. Then, the mixture was refrigerated for a period of time. After that, it was filtered by a vacuum frame-type filter. The obtained supernatant was named as intermediate E.
Step 6. For sterilization and impurity absorption, medicinal activated carbon was added into intermediate E, and the mixture was heated for a period of time. Then, the mixture was filtered by a vacuum frame-type filter and the collected filtrate was named as intermediate F.
Step 7. Intermediate F was dealt with a three-layer ultrafilter. The final collected filtrate was named as intermediate G.
2.2. Sample preparation
After the temperature of each sample of Danshen extract thawed to room temperature, the sample was weighed and dried using a centrifugal vacuum concentrator at 65 °C for 10 h to weaken the effects of residual water and/or ethanol in the solution. The sampling weight of different groups of intermediates was adjusted to the equivalent of 0.1 g per gram of the original material, so as to improve the sampling representativeness. The dehydrated sample was added into exactly 60 μL of D2O (containing 0.05% TSP) and 540 μL of ultrapure water. The solution was dissolved by ultrasound for 3 minutes and centrifuged at 3500 rpm for 10 min. After the removal of the insoluble material, the supernatant solution was transferred into a standard 5 mm NMR tube for analysis. Finally, the NMR tube was sealed and used for 1H NMR measurement.2.3. 1H NMR analysis
All pulse sequences were from the Bruker pulse program library. A presaturation sequence PROTON was applied to suppress the residual water signal. 1H NMR spectra were obtained using the standard NOESYPR1D pulse sequence. Each 1H NMR spectrum consisted of 64 scans requiring 6 min acquisition times with the following parameters: pulse width 11 ppm, sampling time 2.980 s, relaxation delay 2.0 s, 90° pulse width of 14.75 μs. The receiver gain value was at 36 for obtaining the best signal-to-noise ratio (S/N) without causing a baseline distortion. For proton signal assignment purposes, a set of two dimensional (2D) spectra, including 1H–1H correlation spectroscopy (COSY) and 1H–13C heteronuclear single quantum coherence (HSQC), were acquired for the identification of the constituents within the Danshen extracts and processed with similar parameters as described previously.
Subsequently, MestReNova (version 14.0.0, Mestrelab Research, Santiago de Compostella. Spain) was used to segment every spectrum by different types of bucket width across the chemical shift δ 0.60–9.90 ppm, and the signal intensity in each region was integrated. The regions of δ 4.50–5.00 were excluded from the analysis to avoid the effects of the water resonance. Meanwhile, the regions of the residual signal of CH3CH2OH (δ 1.21–1.28, δ 2.33–2.38 and δ 3.66–3.76) were also excluded before further analysis.
2.4. Chemometric analysis
Chemometric analyses were performed using the sextuplicate of production batches, as described in item 2.2. The bucket tables were pre-processed by mean-centered and scaled to unit variance, with the mean value of each column subtracted from individual elements since this pretreatment provided better differences between the samples, and it did not allow the noises to negatively affect the distribution.25 The chemical shift values in the loading plots refer to the peak's position of each bucket. SIMCA (Version 14.1, Umetrics, Umeå, Sweden) was used for multivariate analysis in this work. HCA and partial least squares-discriminant analysis (PLS-DA) were applied to discriminate the critical control points and conduct a similarity analysis. PCA and OPLS-DA were applied to explore differential metabolites.3. Results and discussion
3.1. Identification of the metabolites in Danshen extracts
After all spectra were processed and aligned according to the TSP typical signal at 0 ppm, spectra of intermediates A–G of Batch 1 are displayed in Fig. 1A. Among all spectra, the general signal distribution properties in the region δ 10.00–0.00 seemed to bear a certain resemblance, except for the ratio of the peak area in δ 10.00–6.0 in the whole spectrum scaling up with the process progressing. Meanwhile, the signals in δ 6.00–2.0 were too abundant, complex and diverse to exploit effective information. So, detailed component discrimination and deeper chemometric analysis were called for. A typical 1H NMR spectrum can be divided into three different regions, consisting of the aromatic region (δ 10.00–δ 6.00, Fig. 1D), fatty hydrocarbon region (δ 6.00–δ 3.50, Fig. 1C), as well as the organic and amino acid region (δ 3.50–δ 0.00, Fig. 1B). It provides comprehensive information of all metabolites in a sample because the signal intensity is directly proportional to the number of nuclei in all proton-bearing compounds. A total of 30 labeled metabolites were identified in this work and their detailed information regarding these metabolites, including chemical shifts and peak multiplicity, is provided in Table 1. These metabolites were identified by referring to the reported data in previous literature.20–24 The U.S. National Library of Medicine (PubChem; https://pubchem.ncbi.nlm.nih.gov), 13C NMR spectrum and two-dimensional NMR data (including COSY and HSQC spectra) were also taken as confirmed references for the metabolite assignments, and are attached in the ESI named as Fig. S1–S3.† Organic acids, such as isoleucine, proline, histidine and succinate, were identified in the organic and amino acid region. In the sugar region, fructose, sucrose, glucose, melibiose and raffinose were identified as the major sugars. In the aromatic region, seven phenolic acids, including salvianolic acid B, salvianolic acid A, rosmarinic acid, danshensu, protocatechuic aldehyde and lithospermic acid were clearly detected. In addition, in this research, melibiose, manninotriose and stachyose have been identified for the first time in the NMR spectrum of Danshen extracts, mainly referenced by corresponding standards.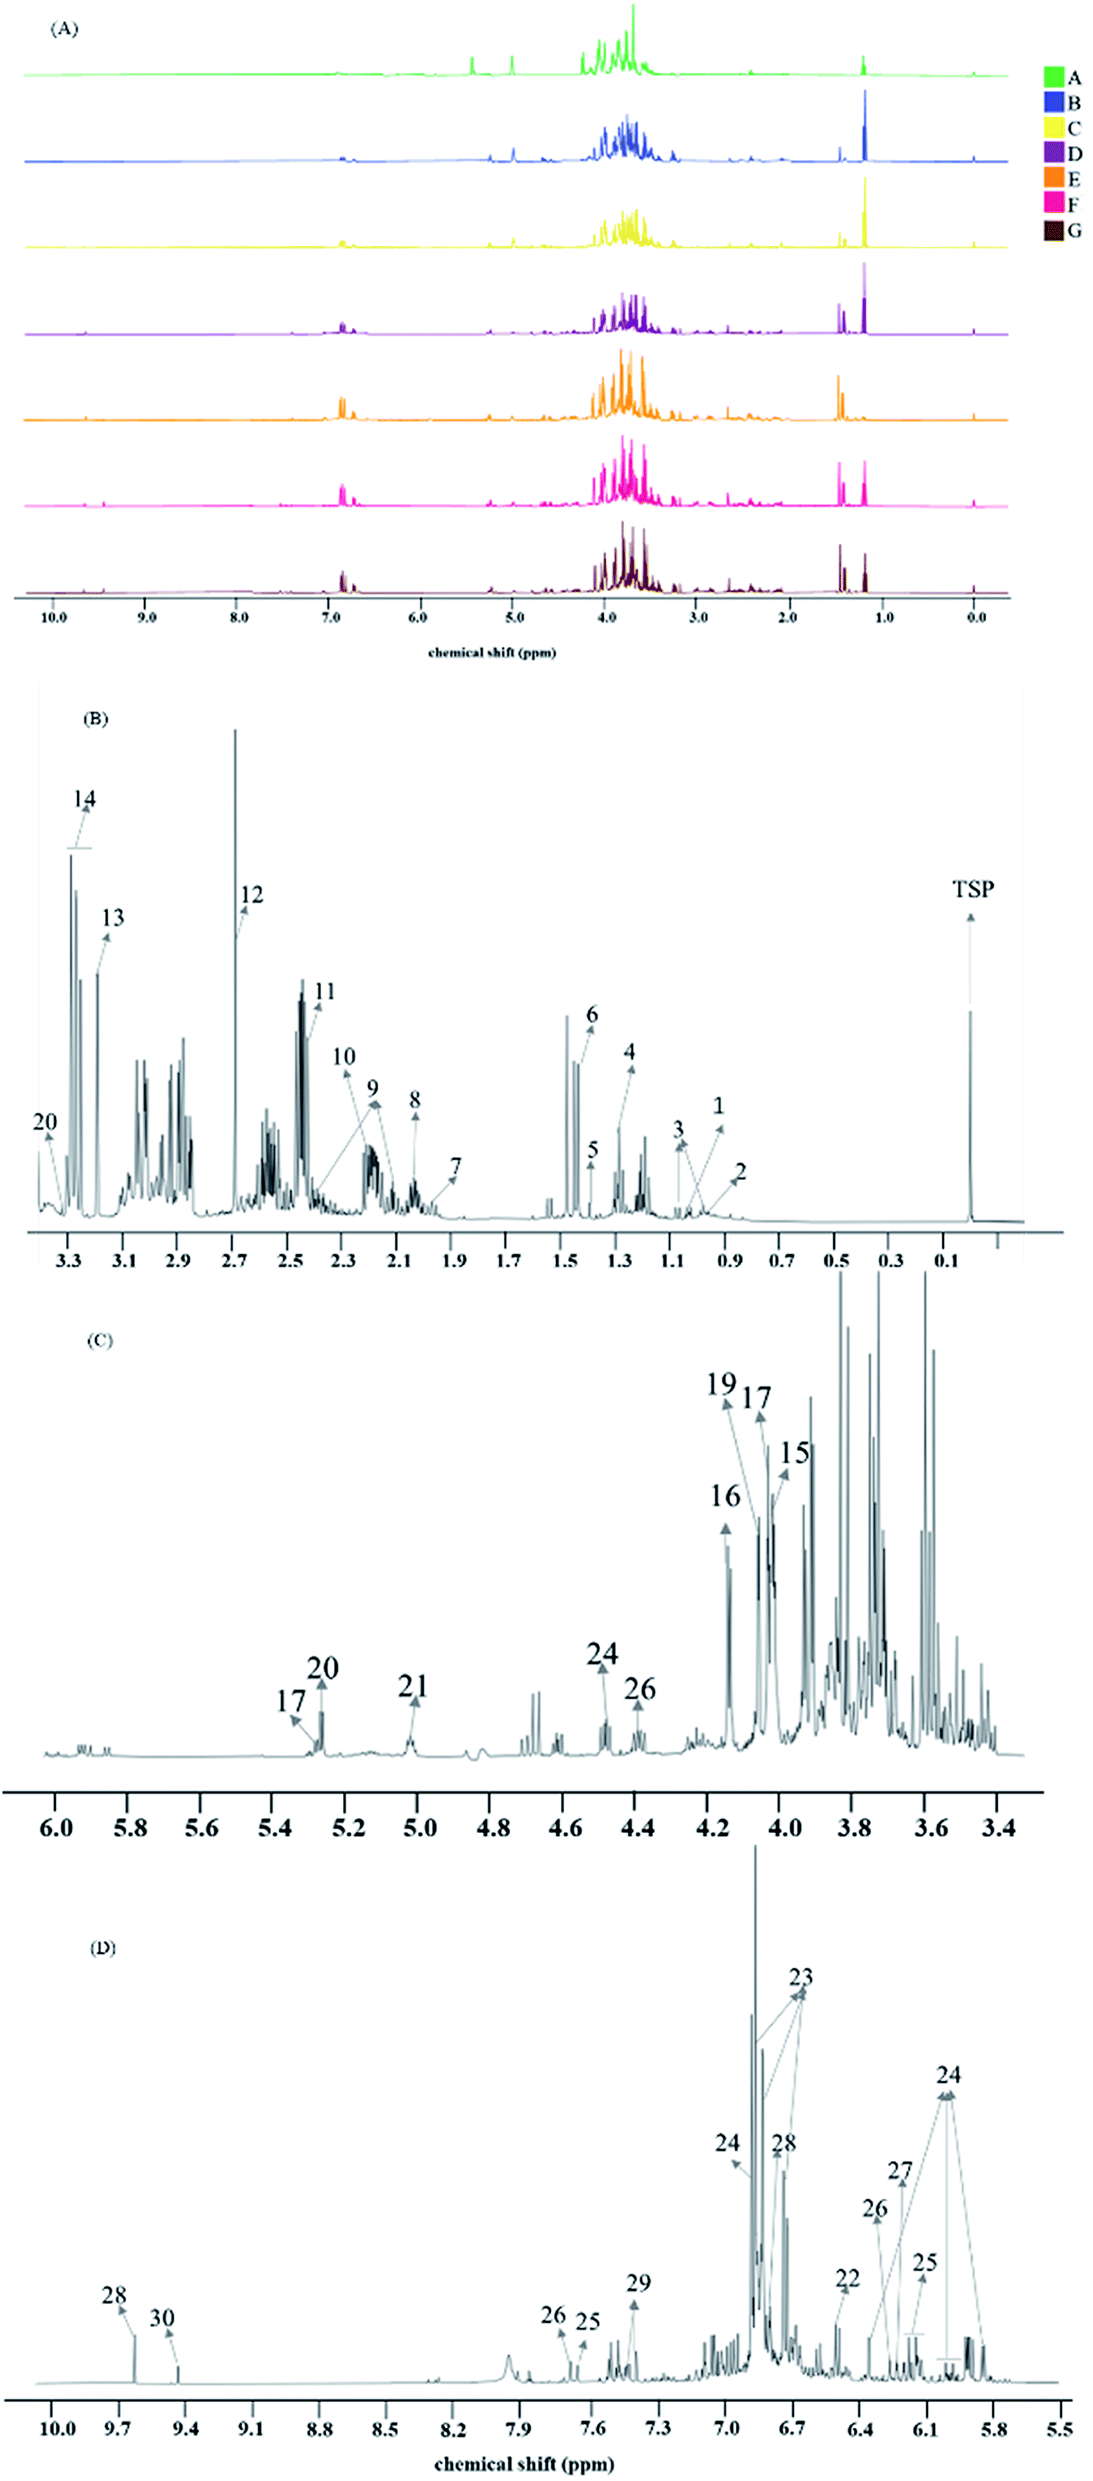 | ||
| Fig. 1 1H NMR spectra of Danshen extracts and expansions of a representative spectrum: (A) are preprocessed 1H NMR spectra of the process intermediates collected from production batch 1, colored by the intermediate number A–G, (B) is the enlarged organic and amino acid region, (C) is the enlarged fatty hydrocarbon region and (D) is the enlarged aromatic region. (B)–(D) are all parts of the 1H NMR spectrum of intermediate G collected from production batch 1. | ||
| Peak | Metabolites | δ 1H (multiplicity) |
|---|---|---|
| 1 | Isoleucine | 3.66(m), 1.96(m), 1.47(m), 1.26(m), 1.01(d), 0.96(t) |
| 2 | Leucine | 3.72(m), 1.67(m), 0.95(m) |
| 3 | Valine | 3.60(d), 2.26(m), 1.05(d), 1.00(d) |
| 4 | Lactate | 4.09(m), 1.29(d) |
| 5 | Threonine | 4.25(m), 3.58(d), 1.39(d) |
| 6 | Alanine | 3.78(m), 1.48(d) |
| 7 | Acetate | 1.95(s) |
| 8 | Proline | 4.13(m), 3.42(m), 3.34(m), 2.00(m) |
| 9 | Pyroglutamate | 2.76(dd), 2.97(dd), 4.00(m) |
| 10 | Glutamine | 3.79(m), 2.45(m), 2.15(m) |
| 11 | Succinic | 2.42(s) |
| 12 | Malate | 4.31(m), 2.68(dd), 2.37 |
| 13 | Choline | 3.21(s) |
| 14 | Glucose | 5.27(d), 4.68(d), 3.94(dd), 3.87(m), 3.77(m), 3.56(m), 3.50(m), 3.44(m), 3.28(dd) |
| 15 | Fructose | 3.99(dd), 3.91(dd), 3.88(dt), 3.78(dd), 3.58(m), 3.46(m), 3.43(d) |
| 16 | Manninotriose | 5.05(m), 5.02(m), 4.93(m), 4.79(d), 4.74(d), 4.15(dd), 3.99(d), 3.94(m), 3.88(m), 3.76(m), 3.58(m), 3.49(m), 3.40(dd), 3.20(d) |
| 17 | Galactose | 5.27(d), 3.83(m), 4.02(m) |
| 18 | Sucrose | 5.41(d), 4.21(d), 4.05(t), 3.82(m), 3.68(s), 3.56(dd), 3.47(t) |
| 19 | Raffinose | 5.47(d), 4.27(d), 4.08(m), 4.00(t), 3.94(m), 3.88(m), 3.83(m), 3.80(d), 3.74(d), 3.72(s), 3.61(m) |
| 20 | Melibiose | 5.30(d), 4.06(m), 4.03(m), 3.88(m), 3.84(m), 3.78(m), 3.71(dd), 3.66(m), 3.57(m), 3.32(m) |
| 21 | Stachyose | 5.44(d), 5.01(dd), 4.79(m), 4.24(d), 4.16(dd), 4.07(m), 4.00(d), 3.82(m), 3.57(m), 1.19(t) |
| 22 | Fumarate | 6.56(s) |
| 23 | Danshensu (DSS) | 6.86(d), 6.81(d), 6.74(dd), 5.42(m), 2.85(m), 3.04(m) |
| 24 | Salvianolic acid B (SaB) | 6.99(m), 6.76(m), 6.42(d), 6.24(d), 6.12(dd), 6.01(d), 5.85(d), 5.00(m), 4.90(m), 4.33(d), 3.10(m), 2.98(m), 2.90(m), 2.56(m) |
| 25 | Rosmarinic acid (RA) | 7.49(d), 6.98(d), 6.89(d), 6.72(d), 6.64(d), 6.55(dd), 6.32(d), 3.13(m), 2.92(m) |
| 26 | Lithospermic acid (LA) | 7.98(d), 6.26(d) |
| 27 | Salvianolic acid A (SaA) | 8.02(d), 6.24(d) |
| 28 | Procatechuic aldehyde (PA) | 9.63(d), 7.08(dd), 6.80(d) |
| 29 | Procatechuic acid | 7.41(d), 7.46(dd) |
| 30 | 5-Hydroxymethyl furfural | 9.45(s), 7.23(d), 6.51(d), 4.56(d), 3.27(t) |
3.2. Multivariate data analysis
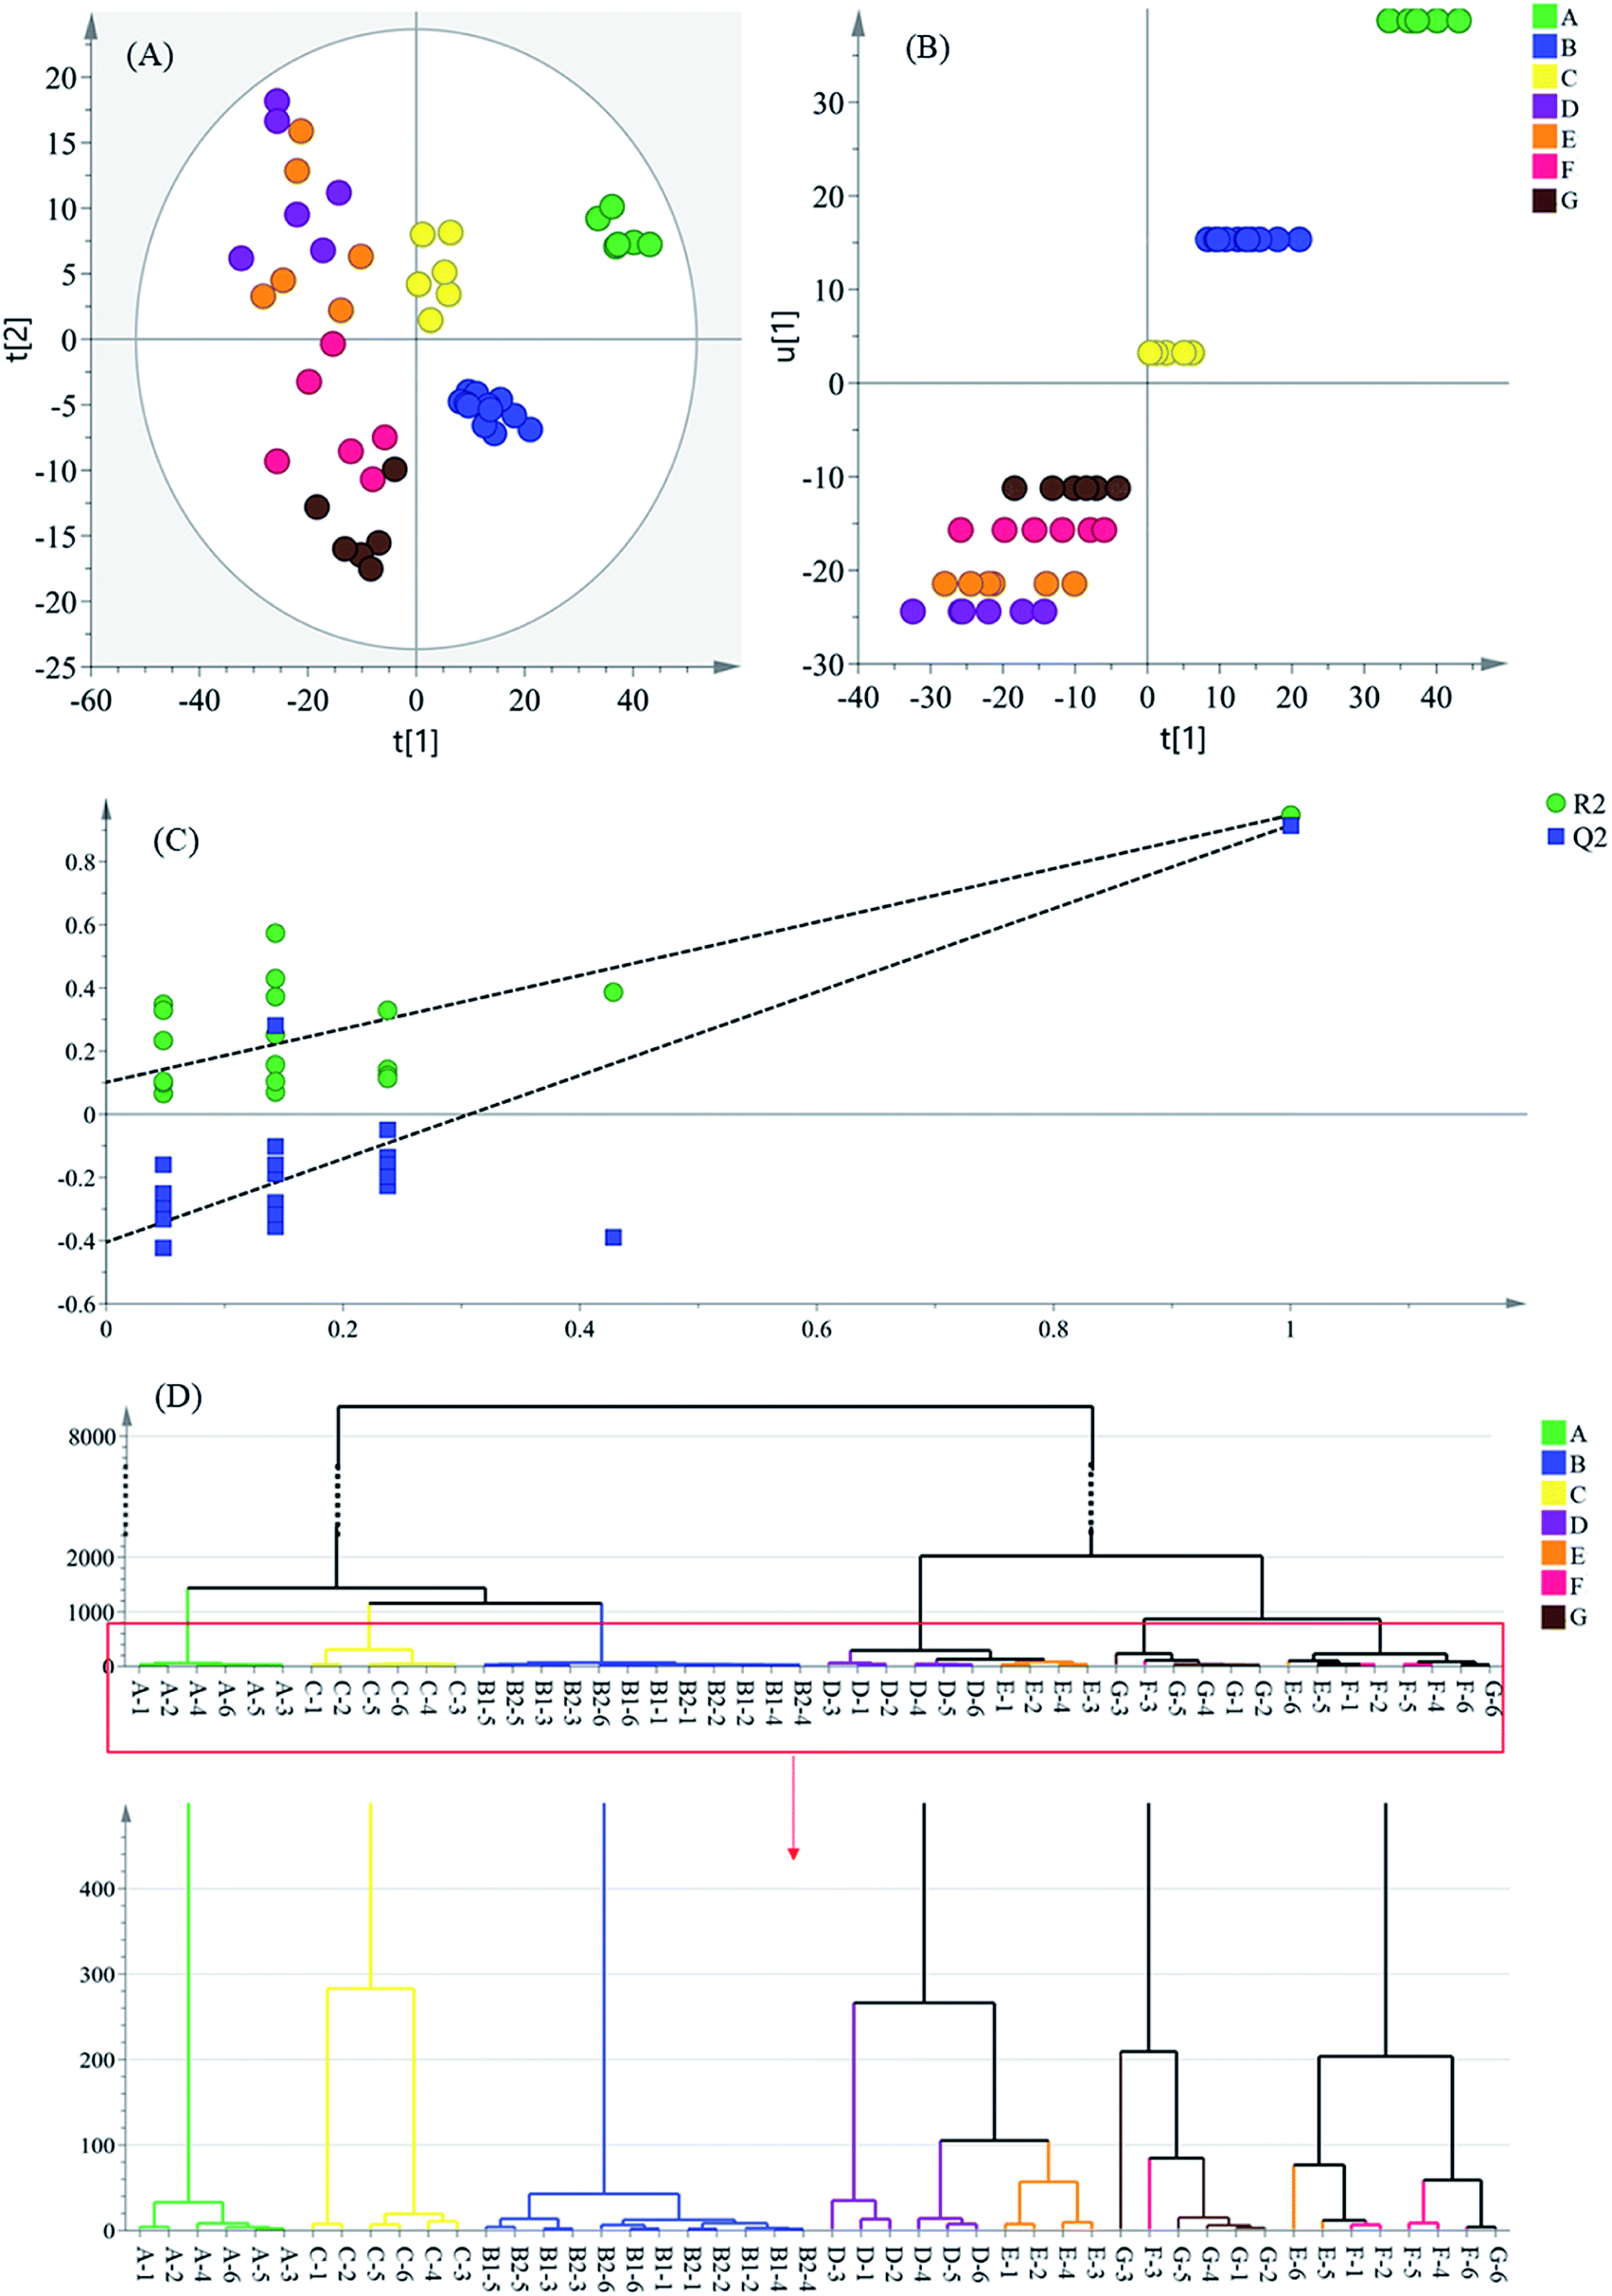 | ||
| Fig. 2 Multivariate analysis results based on the 1H NMR data of intermediates: (A) PLS-DA score plot, (B) scores scatter plot t1 vs. u1, (C) permutation test model validation plot, (D) dendrogram of the hierarchical clustering (sample names are identified by the intermediate name accompanying the batch number, such as A-1, which represents the intermediate A collected from the production batch 1.). | ||
In the score plot (Fig. 2A), which was generated by the first two principal components (PCs), a clear separation trend of the intermediate groups could be observed. All water extractions of Danshen (intermediate A) were on the most positive side of PC1, which is as shown in Fig. 2B, with the inner relationship between the Y-variable (u1) and the first summary of all the X-variables (t1). The latter intermediate groups were on the negative side of group A, suggesting that the intermediates were sustainably varied during the preparation processes. Moreover, the distribution of the latter samples (intermediates D–G), was not located close to each other, but spread wide by their PC2 score. Therefore, this was a lower influential factor on the clustering samples after the PC1 score.
A similarity analysis between intermediates was performed by hierarchical cluster analysis (HCA) by measuring the distance between all possible sample pairs in a high-dimensional space. It uses an iterative procedure that either associates or dissociates a group object-by-object to classify objects.26 The 48 intermediate samples were classified using Ward's method, employing the Euclidean distance as a measurement for HCA.
According to the HCA result (Fig. 2D), all intermediate samples were divided into two groups. Intermediate A showed little correlation with other sample groups, and was segregated at a height of around a value of 1400. Intermediate B showed an exclusively close correlation with intermediate C, and formed a separate cluster from intermediates D–G. These cluster results indicate that Step 2 and Step 4 contribute a lot to the formation of the final product. Under a height value of around 2000, intermediates D, E and F, G were further divided into two groups. The intermediate D and E samples were not separated completely for there were no thermal treatment, acid and alkali handling or other acute treatments during the water precipitation process, so there might be small differences between these two groups of samples. For the intermediate F and G samples, the processing entailed ultrafiltration with no thermal treatment or acid–alkali handling, so these intermediates were not separated well either, which is similar to the results from the PLS-DA analysis (Fig. 2A). In a word, the sample groups from the processes near the ends of the manufacturing chain were poorly separated. This indicated more slight component fluctuations than the preceding processes. In addition, according to the extremely close distance between the six groups of intermediates B1 and B2, the cluster result excluded the influence of the sampling position.
The investigation and verification of the critical control points are of urgency and necessity to guarantee a stable production efficacy, so as to lead to valid quality control in the manufacture of Danshen products because these processes have a big impact on the final medicinal product. Taking the results of the chemometric analyses, the different intermediate groups along the production line showed distinct variations to some degree. This result demonstrates that the low correlation between the initial Danshen water extraction (intermediate A) and the latter intermediates can presumably be ascribed to the high concentration acid and alkali handling applied to intermediate A, causing a fierce fluctuation of the sample quality. At the same time, the alcohol precipitation step has been demonstrated as a crucial refining process by a great deal of research studies,27 and was also recognized as the critical process in this work. Finally, by measuring the distance between the groups of samples, the alkali-isolation and acid-dissolution method was recognized as the most critical control point in the Danshen extract manufacturing, which indicates the chemometrics-based 1H-NMR approach has the ability to screen critical control points.
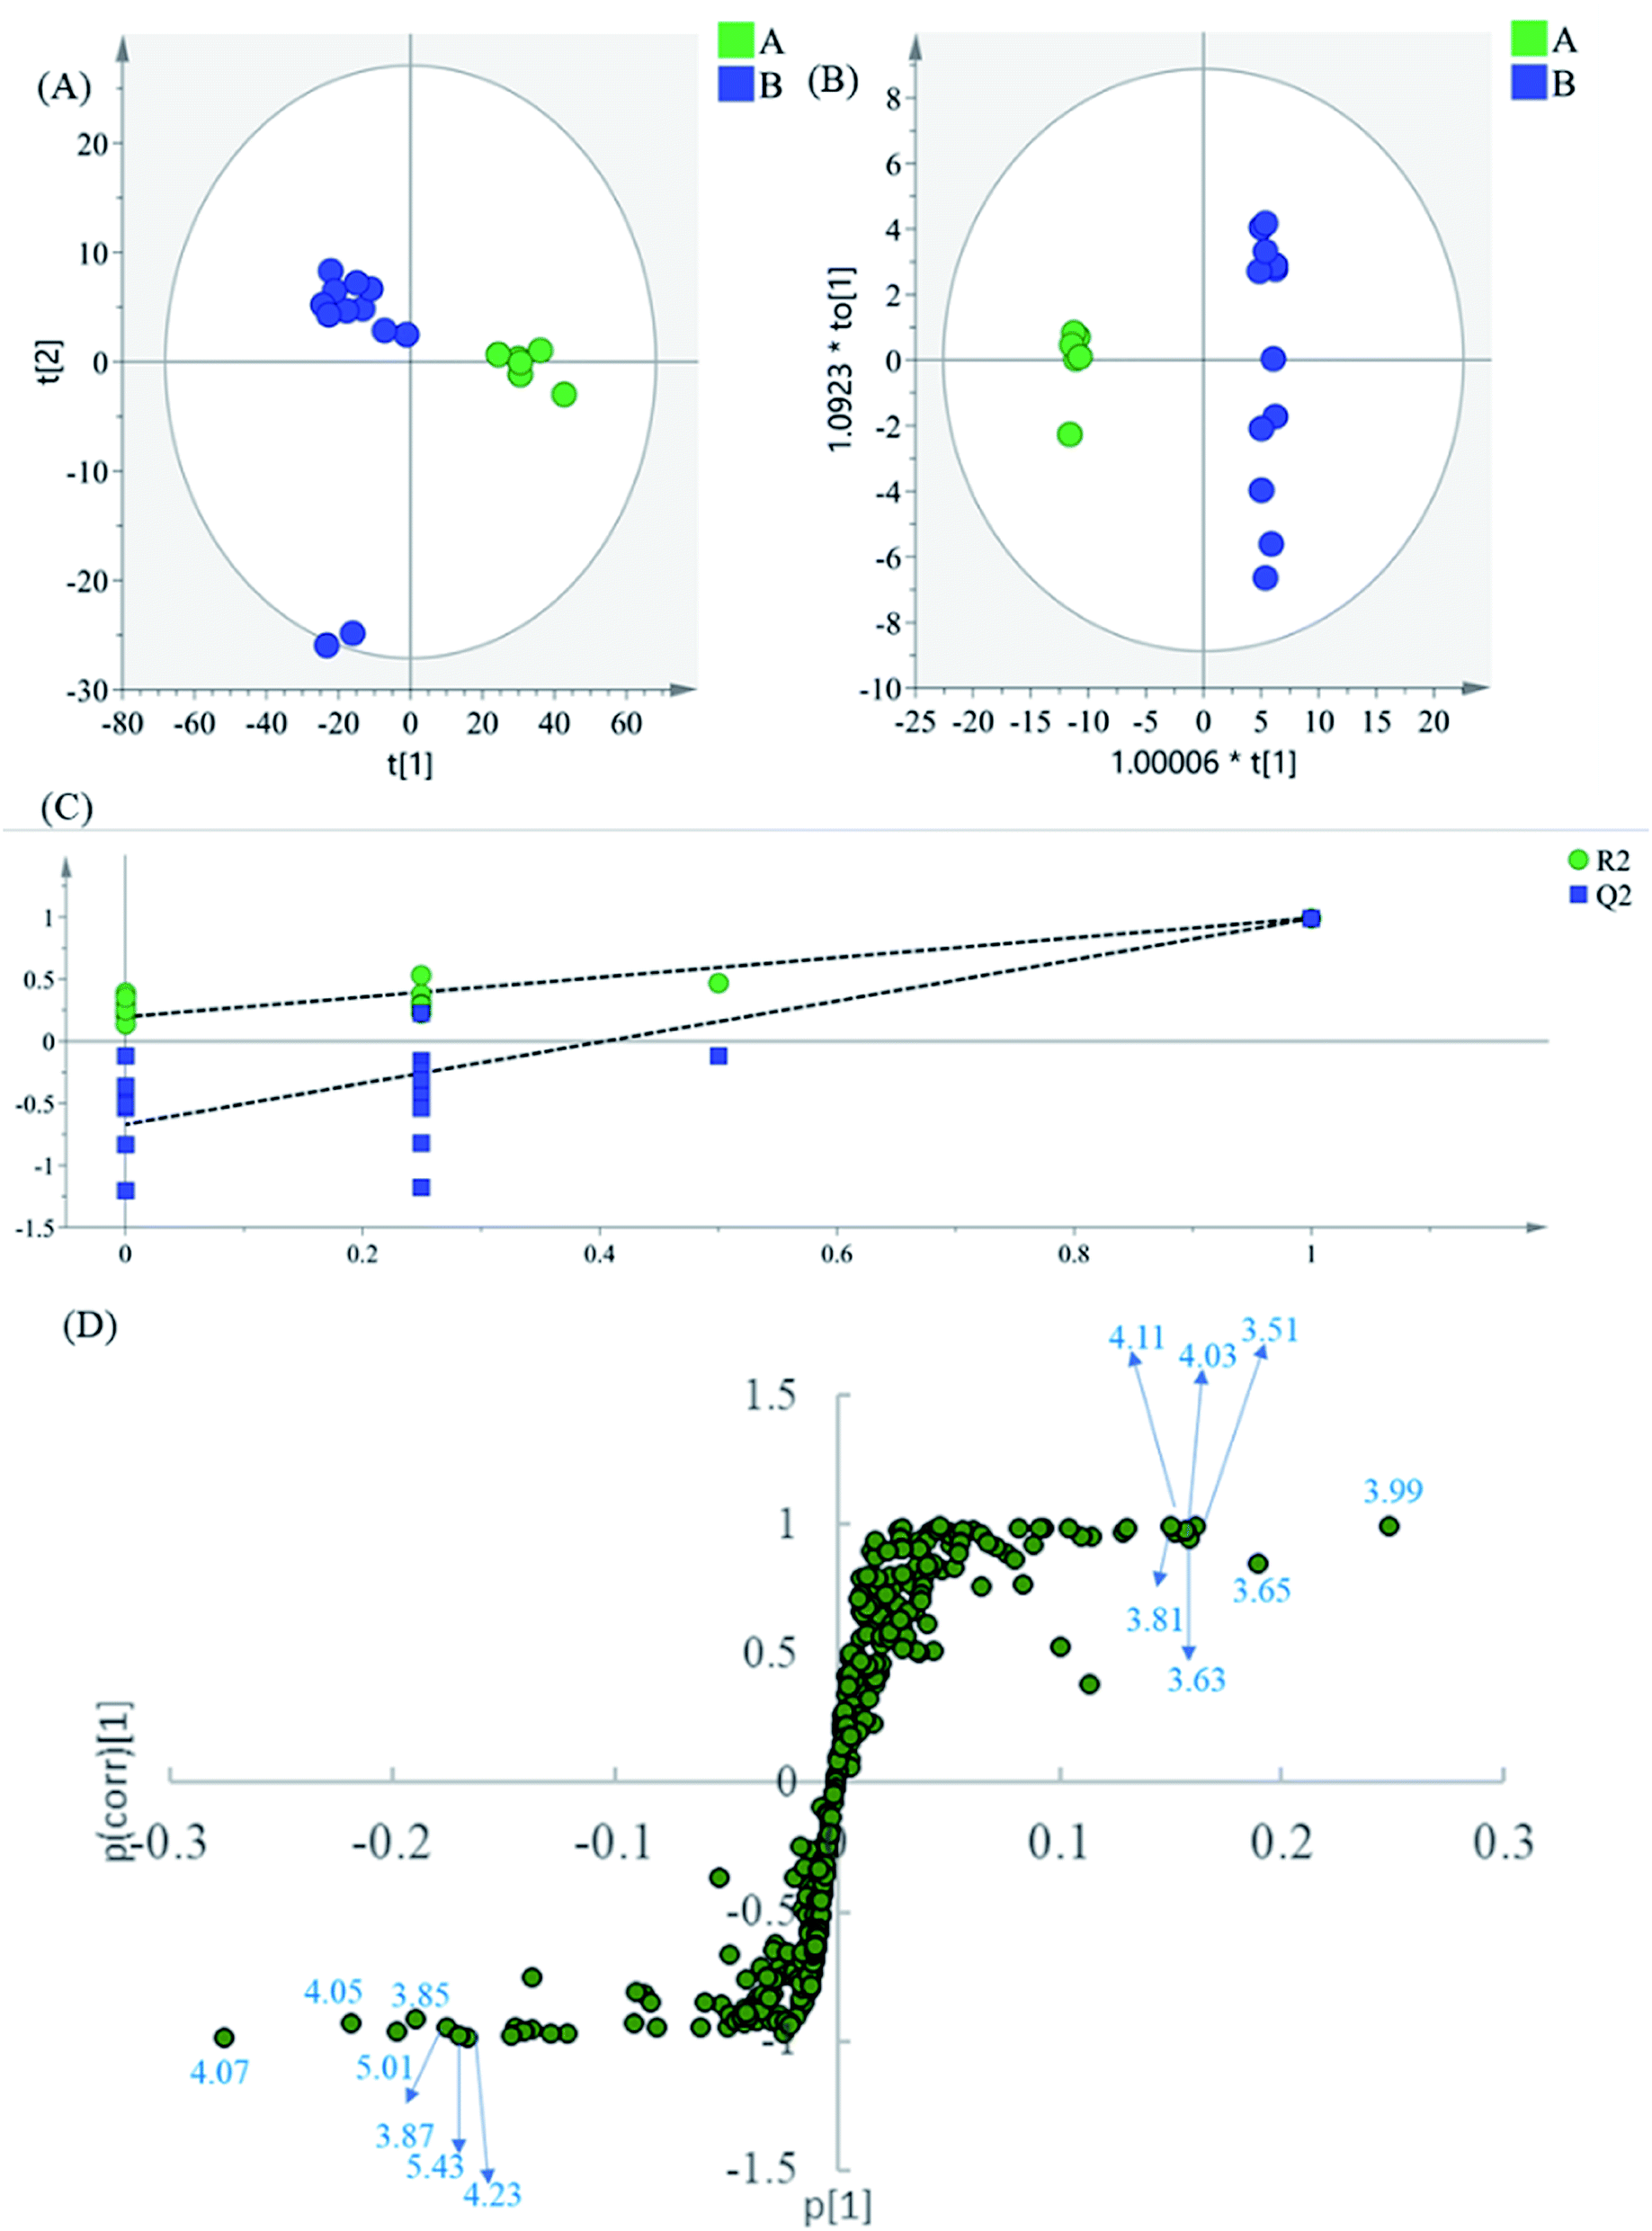 | ||
| Fig. 3 (A) PCA results based on 1H NMR data (0.6–9.9 ppm) of intermediates A and B, (B) OPLS-DA score plot, (C) permutation test model validation plot of OPLS-DA model, (D) S-plot of the OPLS-DA model. | ||
The region 5.50–9.90 of 1H NMR spectra were analyzed separately to study the contribution of the phenolic acids. In the PCA scatter plot (Fig. 4A), which was generated by the first two PCs (PC1: 85.3%; PC2: 0.0417%). Almost all intermediate B samples were located on the negative side of the PC1, indicating that intermediate A and intermediate B had significant variation in the content of the phenolic acids. Then, the supervised statistical method OPLS-DA (p value of CV-ANOVA is 2.61 × 10⁻⁸) was used to determine the altered endogenous metabolites in intermediate B (Fig. 4B). The corresponding S-plot (Fig. 4D) indicated that intermediate B showed increased levels of DSS and PA, as well as decreased levels of SaB, SaA and LA. According to the degradation rule, in the intense alkaline hydrothermal solutions, SaB would be degraded to SaA and LA. Then, SaA and LA would continue to degrade, which causes the increased content of PA and DSS. The results are consistent with previous research studies on the degradation laws of phenolic acids in a particular condition.22
 | ||
| Fig. 4 (A) PCA results based on 1H NMR data (5.60–9.90 ppm) of intermediates A and B, (B) OPLS-DA score plot, (C) permutation test model validation plot of OPLS-DA model, (D) S-plot of OPLS-DA model. | ||
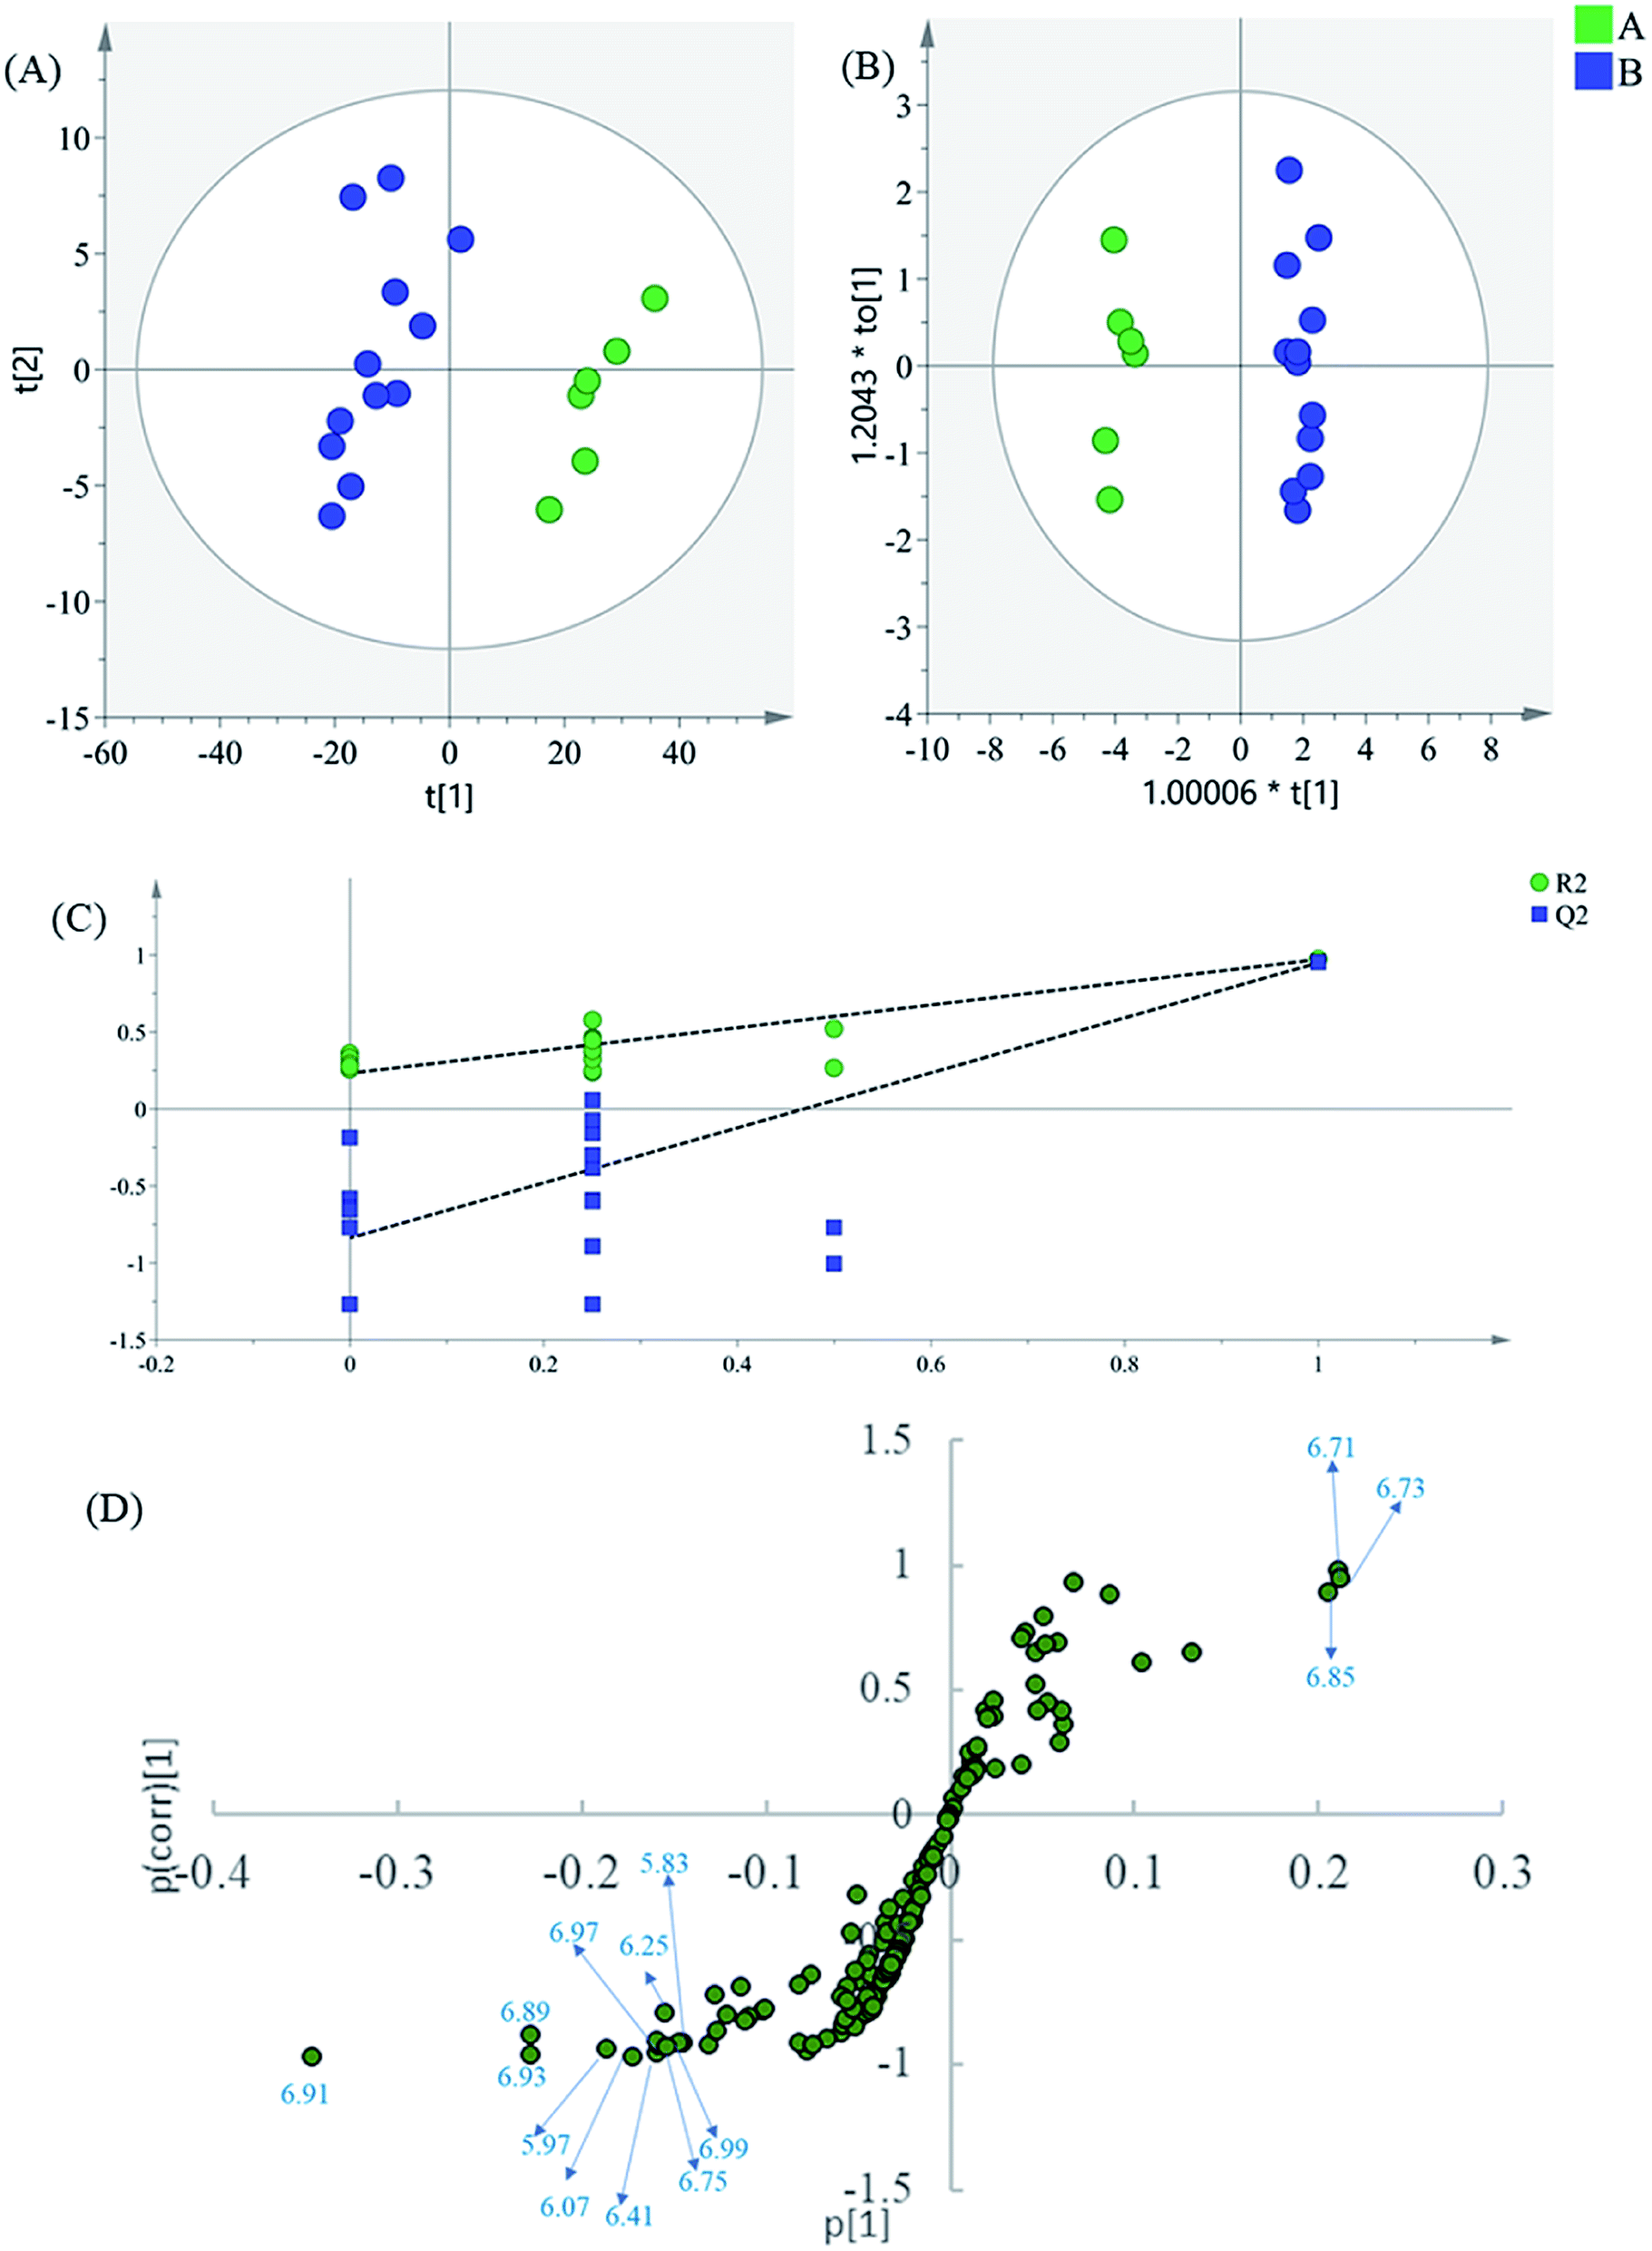
Finally, to dig into the negligible variations of the amino acids and other small-molecule primary metabolites, the region 0.60–3.30 of the 1H NMR spectra were also analyzed separately. In the PCA scatter plot (Fig. 5A), which was generated by the first two PCs (PC1: 52.4%; PC2: 22.5%), all intermediate B samples were located on the negative side of the PC1, indicating that intermediate A and intermediate B had significant variation in their content of phenolic acids. Then, the supervised statistical method OPLS-DA (p value of CV-ANOVA is 9.79 × 10⁻⁹) was used to determine the altered endogenous metabolites in intermediate B (Fig. 5B), with PLS1: 0.425 and PLS2: 0.305.
 | ||
| Fig. 5 (A) PCA results based on 1H NMR data (0.60–3.30 ppm) of intermediates A and B, (B) OPLS-DA score plot, (C) validation of the corresponding partial least squares discriminant analysis model via a permutation test, (D) S-plot of OPLS-DA model. | ||
The corresponding S-plot (Fig. 5D) indicated that intermediate B showed increased levels of threonine, alanine, valine, isoleucine, glucose, and malonate, as well as decreased levels of lactate. The contents of the amino acids present an increasing trend in general after the alkali-isolation and acid-dissolution process. This is because proteins and peptides have been hydrolyzed and released in the intensely alkaline or acidic hydrothermal solutions. At the same time, calcium lactate is coprecipitated in the alkali-isolation, which causes the reduction of lactate.
So far, three major components, including the main changes of saccharides, phenolic acids and amino acids, between the sample groups A and B have been explored and can be identified as potential critical quality markers to evaluate the process efficiency in future studies. After a literature-based retrospective analysis, results of the critical control points and potential quality markers identification in the Danshen extract processing in this work are consistent with previous research studies and reference experiments.29–32 Almost all research studies were conducted by LC-UV, LC-ELSD and LC-MS or their combination, which consumed an amount of analytical time and need complex pre-separation. Recognition, by the method, of the potential of 1H NMR combined with chemometrics on the simple and convenient critical control points and potential quality marker identification of the Danshen extract processes clearly provides paths for the quality control of the multi-step process control of herbal medicine.
4. Conclusion
1H NMR spectroscopy and multivariate data analysis showed the capability for identifying and differentiating the chemical changes of samples from each processing step of the Danshen extract. The clearly clustered samples by HCA indicate that the Euclidean distance between different intermediates could be an indicator to measure the influence of the corresponding process on the quality of intermediates. The larger the Euclidean distance is in the high-dimensional space, the more the process affects the quality of intermediates and the more critical the process is. Then, the potential chemical markers could be screened out by OPLS-DA. Some small molecular amino acids, including threonine, alanine, valine and isoleucine, were found to be potential markers, which have not been reported as the process control attributes. Therefore, 1H NMR was proved to be a valuable and efficient tool in providing a wealth of chemical information on the variation of the organic compounds of herbal medicines during their production. This work provides a novel method that can be easily applied to other herbal medicines for identifying critical control points and potential chemical markers, so as to conduct process quality assessment and improve process understanding by 1H NMR, and finally contribute to process control. Future studies will investigate the use of 1H NMR as a tool to quantitatively measure the process capability and intermediate quality. Other process control strategies, like make endpoint determination, abnormity diagnosis and other methods, are also placed on the research agenda.Conflicts of interest
There are no conflicts to declare.Acknowledgements
This work was supported by the National Science & Technology Major Project of China (2018ZX09201011-002). Many thanks to Ms Bailin Li, Mr Hui Li and Mr Wei Gou from Guizhou Baite Pharmaceutical Co., Ltd (Guiyang, 550014, China) for supporting us with the materials, sample collection and technical guidance.References
- C. X. Liu, D. A. Guo and L. Liu, Phytomedicine, 2018, 44, 247–257 CrossRef PubMed.
- Y. Liang, P. Xie and K. Chan, J. Chromatogr. B: Anal. Technol. Biomed. Life Sci., 2004, 812, 53–70 CrossRef CAS.
- G. Bai, T. J. Zhang, Y. Y. Hou, G. Y. Ding, M. Jiang and G. A. Luo, Phytomedicine, 2018, 44, 109–116 CrossRef PubMed.
- S. P. Putri, Y. Nakayama, F. Matsuda, T. Uchikata, S. Kobayashi, A. Matsubara and E. Fukusaki, J. Biosci. Bioeng., 2013, 115, 579–589 CrossRef CAS PubMed.
- C. Zhang, X. Zheng, H. Ni, P. Li and H. J. Li, J. Pharm. Biomed. Anal., 2018, 159, 296–304 CrossRef CAS PubMed.
- C. Seger, S. Sturm and H. Stuppner, Nat. Prod. Rep., 2013, 30, 970 RSC.
- J. C. Lindon, E. Holmes and J. K. Nicholson, Pharm. Res., 2006, 23, 1075–1088 CrossRef CAS PubMed.
- G. Fan, M. Y. Zhang, X. D. Zhou, X. R. Lai, Q. H. Yue, C. Tang, W. Z. Luo and Y. Zhang, Anal. Chim. Acta, 2012, 747, 76–83 CrossRef CAS PubMed.
- M. Jiang, Y. Jiao, Y. Wang, L. Xu, M. Wang, B. Zhao, L. Jia, H. Pan, Y. Zhu and X. Gao, PLoS One, 2014, 9, e105412 CrossRef PubMed.
- G. F. Pauli, T. Gödecke, B. U. Jaki and D. C. Lankin, J. Nat. Prod., 2012, 75, 834–851 CrossRef CAS PubMed.
- J. L. Izquierdo-García, P. Villa, A. Kyriazis, L. Del Puerto-Nevado, S. Pérez-Rial, I. Rodriguez, N. Hernandez and J. Ruiz-Cabello, Prog. Nucl. Magn. Reson. Spectrosc., 2011, 59, 263–270 CrossRef PubMed.
- Å. Rinnan, F. Savorani and S. B. Engelsen, Anal. Chim. Acta, 2018, 1021, 20–27 CrossRef.
- G. Fan, M. Y. Zhang, X. D. Zhou, X. R. Lai, Q. H. Yue, C. Tang, W. Z. Luo and Y. Zhang, Anal. Chim. Acta, 2012, 747, 76–83 CrossRef CAS PubMed.
- Z. Y. Li, J. Li, Z. Z. Zhang, X. Mi, G. H. Du and X. M. Qin, Chemom. Intell. Lab. Syst., 2017, 165, 1–10 CrossRef CAS.
- M. Halabalaki, K. Vougogiannopoulou, E. Mikros and A. L. Skaltsounis, Curr. Opin. Biotechnol., 2014, 25, 1–7 CrossRef CAS PubMed.
- H. Yao, P. Y. Shi, X. M. Huang, Z. H. Shen, Y. Su, C. L. Yang, M. L. Zhu, L. Y. Huang, A. L. Liu and X. H Lin, RSC Adv., 2017, 7, 13570–13583 RSC.
- H. S. Xiong, X. Y. Qi and H. B. Qu, Anal. Methods, 2013, 5, 465–473 RSC.
- H. J. Tang, L. Yang, W. Li, J. H. Li and J. Chen, RSC Adv., 2016, 6, 113527–113537 RSC.
- H. P. Mao, H. Zhang, H. Wang, Y. F. Wang, F. R. Zhao, L. M. Hu, N. Yanagihara and X. M. Gao, J. Ethnopharmacol., 2009, 125, 59–67 CrossRef CAS PubMed.
- M. M. Jiang, C. H. Wang, Y. Zhang, Y. F. Feng, Y. F. Wang and Y. Zhu, Phytochem. Anal., 2014, 25, 50–58 CrossRef CAS PubMed.
- K. J. Yan, Y. Chu, J. H. Huang, M. M. Jiang, W. Li, Y. F. Wang, H. Y. Huang, Y. H. Qin, X. H. Ma, S. P. Zhou, H. Sun and W. Wang, J. Pharm. Biomed. Anal., 2016, 131, 183–187 CrossRef CAS PubMed.
- J. Y. Pan, X. C. Gong and H. B. Qu, J. Pharm. Biomed. Anal., 2013, 85, 28–32 CrossRef CAS PubMed.
- J. Y. Pan, X. C. Gong and H. B. Qu, PLoS One, 2016, 11, e164421 Search PubMed.
- X. L. Chen, Y. J. Guo, Y. J. Hu, B. Y. Yu and J. Qi, J. Pharm. Biomed. Anal., 2016, 124, 281–287 CrossRef CAS PubMed.
- J. Xie, A. H. Zhang, H. Sun, G. L. Yan and X. J. Wang, RSC Adv., 2018, 8, 812–824 RSC.
- J. H. Kim, C. S. Seo, S. S. Kim and H. K. Shin, J. Anal. Methods Chem., 2015, 2015, 607211–607252 Search PubMed.
- X. C. Gong, T. Chen and H. B. Qu, J. Chin. Mat. Med., 2017, 1, 1021–1036 Search PubMed.
- J. A. Westerhuis, E. J. J. van Velzen, H. C. J. Hoefsloot and A. K. Smilde, Metabolomics, 2010, 6, 119–128 CrossRef CAS PubMed.
- W. Z. Li, L. Q. Zhang, B. L. Li, Q. J. Zhang, F. Zhao, Z. Q. Chen and H. B. Qu, Chin. Tradit. Herb. Drugs, 2019, 10, 2302–2311 Search PubMed.
- L. B. Chen, F. Zhao, W. Z. Li, Z. Q. Chen, J. Y. Pan, D. F. F. Xiong, B. L. Li, Q. J. Zhang and H. B. Qu, RSC Adv., 2020, 10, 10338–10351 RSC.
- P. P. Zhou, L. Zhou, Z. Sun, Z. L. Li, R. Zhang, K. L. Guan, Y. J. Yang, H. M. Li, Y. H. Wang, X. L. Zhang and S. Z. Du, Chin. Pharm. J., 2019, 04, 327–333 Search PubMed.
- S. S. Gao, Ph.D thesis, Beijing University of Chinese Medicine, 2017.
Footnotes |
| † Electronic supplementary information (ESI) available. See DOI: 10.1039/d0ra03172k |
| ‡ These authors contributed equally to this work. |
| This journal is © The Royal Society of Chemistry 2020 |