
 Open Access Article
 This Open Access Article is licensed under a Creative Commons Attribution-Non Commercial 3.0 Unported Licence
A comparative study on the structural features of humic acids extracted from lignites using comprehensive spectral analyses
Yuanqin Zhanga,
Yanhong Li *ab,
Liping Changb,
Changyu Zia,
Guangbing Lianga,
Dengfeng Zhanga and
Yi Sua
*ab,
Liping Changb,
Changyu Zia,
Guangbing Lianga,
Dengfeng Zhanga and
Yi Sua
aFaculty of Chemical Engineering, Kunming University of Science and Technology, Kunming 650500, People's Republic of China. E-mail: liyh_2004@163.com; Tel: +86 159 2523 6990
bKey Laboratory of Coal Science and Technology, Taiyuan University of Technology, Ministry of Education and Shanxi Province, Taiyuan 030024, People's Republic of China
First published on 9th June 2020
Abstract
The lignite reserves of Zhaotong and Mile in China are abundant and lignite utilizations are limited, however, humic acids (HAs) extracted from lignites play a significant role in many fields including agriculture, environmental protection and so on. Herein, the structures of HAs extracted from Zhaotong and Mile lignites (denoted as ZLHA and MLHA, respectively) were characterized and compared to each other using comprehensive spectral analyses. As a result, the UV-Vis spectrum analyses of HAs indicated that the molecular weight of MLHA is larger than that of ZLHA. Cross polarization magic angle spinning 13C NMR, which is rarely used to analyze the structures of HAs using fitting peaks, and FT-IR spectrum analyses indicated that both the aromaticity and the oxygen-containing group contents of ZLHA are higher than those of MLHA, and the HAs' aromaticity could be confirmed by the results of the X-ray diffraction patterns. Additionally, the main existing forms of the elements in the HAs were obtained from X-ray photoelectron spectrum analyses, which are not commonly used for HA analyses. In this work, the utilization of comprehensive spectral analyses was an effective method to study the structural features of ZLHA and MLHA and it could provide a basic reference for the applications of ZLHA and MLHA.
1. Introduction
Lignite reserves are abundant in China and lignites are mainly used as fuel; however, due to their properties of high moisture content, high ash content, and low calorific value, etc.,1 the applications of lignites cause some environmental problems, such as the release of polluting gases,2 which limit the utilization value of lignites. Besides, lignites are also used as raw materials for soil amendment.3 Generally, these applications of lignites are attributed to oxygen-containing groups (e.g. carboxyl groups and phenolic groups),3 so some small components of lignites are usually extracted and put into industrial, agricultural and medical fields, etc. When it comes to lignites, humic substances (HS) are one of their significant components and they are considered as an important resource of HS.4,5 At present, HS can be extracted from lignites by using an alkaline solution6 (e.g. sodium hydroxide and sodium pyrophosphate) because there are three components which can be isolated from lignites based on their solubility including alkali-insoluble, alkali-soluble and acid-insoluble, and alkali- and acid-soluble components, which correspond to humin, humic acids (HAs) and fulvic acids (FAs), respectively.7 HAs are widely used.HAs are macromolecules containing a number of oxygen-containing groups. Thus, they have some superior properties, e.g. high surface activity, high absorbability, etc.8,9 According to the literature,10 HAs are usually applied in agriculture because they can improve the physicochemical properties of soil to enhance soil fertility. Furthermore, HAs are also applied in the fields of medicine, industry and environmental protection. As we all know, the properties of a substance can be determined by its structure. In order to understand the properties of HAs, the most crucial work is to study the structural features of the HAs.
To obtain the structural features of HAs, numerous technologies are used,3,4,11–14 e.g. ultraviolet-visible (UV-Vis) spectroscopy, Fourier transform infrared (FTIR) spectroscopy, cross polarization magic angle spinning 13C NMR (CP/MAS 13C NMR) spectrometry, X-ray diffraction (XRD), fluorescence spectra, etc. The E4/E6 (Abs465/Abs665) and E2/E3 (Abs250/Abs365) ratios obtained by UV-Vis measurements are often used to indicate the molecular weight of HAs.15 The functional groups of HAs are usually obtained by FTIR.16 According to the literature,7,11,17,18 CP/MAS 13C NMR can measure the types of carbon in HAs and evaluate the aromaticity of HAs. In addition, HAs' aromaticity can be measured by XRD,19 and XRD patterns are often divided into four regions including the γ1, 002, γ2 and 10 bands, which correspond to around 21, 25, 32 and 42°, respectively, and HAs' aromaticity is calculated by the ratio of the relative area of the 002 band to the sum of the relative areas of the γ1 and 002 bands; however, Schnitzer et al.20 divided the XRD pattern into three regions, which were attributed to the γ band (0.43 nm), G band (0.35 nm) and 10 band (0.23 nm), and the HAs' aromaticity was calculated by the ratio of the peak area of the G band to the sum of the peak areas of the G and γ bands. Additionally, X-ray photoelectron spectroscopy (XPS) has been used to measure the different chemical states of carbon and oxygen and evaluate the relative contents of the elements.3 If this measurement could be combined with CP/MAS 13C NMR, it would be more helpful for the analyses of HAs' structural features, but this method is not commonly used at present in studies. As mentioned above, although many methods have been used for HAs' analyses, the analytical methods of HAs are not fixed, this situation could be explained by two reasons, the first reason is that HAs are macromolecules, and another important reason is that the properties and structures of HAs originating from different fields are different. Therefore, comprehensive spectral analyses are an effective method for studies on the structural features of HAs, and the peak-fitting method may be more effective for HA studies.
The lignite reserves of Zhaotong (ZL) and Mile (ML) in China are abundant,1 but their utilizations are limited, and they have not been studied widely. Taking the limited utilizations of lignites and HAs' applications into consideration, ZL and ML were selected as the raw materials used for extracting HAs in our paper. The structural features (including molecular weight, aromaticity and oxygen-containing functional groups) of the HAs extracted from ZL and ML (denoted as ZLHA and MLHA, respectively) were compared using peak-fitting of comprehensive spectral analyses. These analyses of HAs were based on multiple analytical technologies including elemental analysis, UV-Vis, FTIR, CP/MAS 13C NMR, XRD and XPS. This work could obtain the structural differences of ZLHA and MLHA, and provide a basic reference for the applications of ZLHA and MLHA, so as to improve the utilizations of lignites.
2. Materials and methods
2.1 Extractions of the HAs
Two lignite samples originating from Zhaotong and Mile were selected as the raw materials for extracting the HAs. The process of the extractions of HAs was performed according to the literature.3,9,21 In brief, 0.2 g of the lignites was dissolved in a 100 mL solution mixture of NaOH and Na4P2O7 (15 g Na4P2O7 and 7 g NaOH were dissolved into 1 L H2O) and stirred for 120 min, and the mixture was filtered through a Buchner funnel and the pore size of the filter paper is 15 micrometer. Then, the filtrate was treated with H2SO4 until pH < 2, and the samples were left to stand for 24 h. Subsequently, the samples were centrifuged at 9000 rpm for 40 min and dried at 60 °C and the HA samples were obtained.2.2 Fundamental analysis
The Fisons EA 1108 Elemental Analyzer was used to measure the C, H, N and S contents of the samples, and the content of O was obtained from the difference.The proximate analyses of HAs were performed by a 5E-MIN6150 drying oven (measuring the moisture content, at 105 °C) and a 5E-MF6100K muffle furnace (measuring the contents of ash and volatiles by burning 50–100 mg samples at 750 °C), and the content of fixed carbon was obtained from the difference.
2.3 UV-Vis spectrometry
UV-Vis spectra were measured using a UV-1800PC spectrophotometer by recording the absorption spectra between 200–700 nm. About 20 mg of the solid HAs was dissolved in 100 mL of 0.05 mol L−1 and 0.005 mol L−1 NaHCO3 aqueous solution. The E4/E6 ratios (Abs465/Abs665) and Δlog![[thin space (1/6-em)]](https://www.rsc.org/images/entities/char_2009.gif) K coefficients (the logarithm of the ratio of absorbance at 400 nm and 600 nm) were calculated according to the data obtained on the condition of the 0.05 mol L−1 NaHCO3 aqueous solution.
K coefficients (the logarithm of the ratio of absorbance at 400 nm and 600 nm) were calculated according to the data obtained on the condition of the 0.05 mol L−1 NaHCO3 aqueous solution.
2.4 FTIR spectrometry
The FTIR spectra of the pellet samples, which were prepared by mixing about 2 mg of the dry samples with 120 mg KBr to the homogeneous phase, were recorded on an ALPHA Bruker spectrophotometer with a standard detector. All the spectra were obtained in the range 4000–400 cm−1 with a resolution of 4 cm−1 and were the averages of 100 scans.2.5 CP/MAS 13C NMR spectrometry
Solid state CP/MAS 13C NMR spectra were acquired using a 4 mm double resonance probe, and operated on a Bruker AVWB III 600 MHz spectrometer at a magic angle spinning rate of 12 kHz and a resonating frequency of 150.9 MHz. The recycle delay was 3.0 s and a contact time of 4 ms and 5000 scans were used. A 4 mm-diameter zirconia rotor was used to place the samples. With reference to tetramethylsilane, the chemical shift of 13C was assigned.2.6 XRD patterns
The XRD patterns of the HAs were acquired using the X′ Pert 3 Powder spectrometer with copper (Cu) Kα radiation (λ = 1.54056 Å). Samples were scanned continuously at a speed rate of 8° min−1, ranging from 5–90° (2θ) with a step size of 0.026 Å. The pipe pressure and pipe electric current of analyzer were 40 kV and 40 mA, respectively.2.7 XPS spectrometry
The PHI 5000 Versaprobe-II spectrometer was used to obtain the XPS spectra. This measurement was operated under the following conditions: a monochromatic Al Kα source (hv = 1486.6 eV), a power of 50 W and a voltage of 15 kV. The spectra were corrected using the C1s peak at 284.8 eV.3. Results and discussion
3.1 Characterization analyses of samples
The yields and the proximate and ultimate analyses of samples are summarized in Table 1. The atomic ratios calculated from the ultimate analyses of HAs are listed in Table 2. In Table 1, the yields of ZLHA and MLHA were 48.6% and 32.8% respectively. The content of carbon in MLHA (57.39%) was higher than that in ZLHA (56.01%); on the contrary, higher contents of oxygen and hydrogen in ZLHA were determined. Additionally, higher ash contents were determined in MLHA.| HAs | Yield | Moisture | Ash | Ultimate analysis | ||||
|---|---|---|---|---|---|---|---|---|
| C | H | N | St | O | ||||
| a Notes: ad, air dry basis and St, total content of sulfur element. | ||||||||
| ZLHA | 48.6 | 6.39 | 2.80 | 56.01 ± 0.03 | 4.93 ± 0.03 | 1.31 ± 0.01 | 1.07 ± 0.02 | 27.49 ± 0.05 |
| MLHA | 32.8 | 9.19 | 6.45 | 57.39 ± 0.00 | 4.86 ± 0.03 | 1.49 ± 0.01 | 0.64 ± 0.01 | 19.98 ± 0.03 |
The O/C ratio reflects the relative contents of oxygen-containing groups in HAs, the higher the O/C ratios, the higher the content of oxygen-containing groups. As can be seen from Table 2, the contents of oxygen-containing groups in ZLHA were higher than that of MLHA. As reported in the literature,7 the O/C ratio of lignite humic acids ranges from 0.32 to 0.54; in this study, the O/C ratios of both MLHA (0.26) and ZLHA (0.37) are consistent with the values in the literature. The N/C ratios of both ZLHA and MLHA were 0.02, which is in line with the value of lignite humic acids in the literature (<0.05).22
The total acidities of both –COOH and Ar-OH contents of the HAs were measured and are presented in Table 2. The values of both the total acidity and the –COOH content of the samples indicate that ZLHA has a higher total acidity and more –COOH than MLHA; for Ar-OH, the data in Table 2 show that MLHA has more Ar-OH (2.94 meq g−1) than ZLHA (1.11 meq g−1).
3.2 UV-Vis spectrometry
The UV-Vis absorbance spectra of the samples are shown in Fig. 1 and they are featureless. With increasing wavelength, the absorbance of the HAs decreases gradually. A pronounced shoulder can be seen in the wavelength region of 275–285 nm in Fig. 1(a), which can be attributed to the overlapping absorbance of a large number of chromophores of quinonoid in the HAs.23,24 The nature of the shoulder is dependent on the salt concentrations.25 Both the E4/E6 and ΔlogK reflect the molecular weight of the HAs, the higher the E4/E6 ratio and ΔlogK value, the smaller the molecular weight of the HAs.15,26 In our study, the E4/E6 ratios and ΔlogK values were calculated based on the UV-Vis data presented in Fig. 1(b) and are listed in Table 2. The E4/E6 (5.40) and ΔlogK value (0.74) of ZLHA were higher than that of MLHA, these data suggest that the molecular weight of MLHA is higher than that of ZLHA.
 | ||
| Fig. 1 UV-Vis spectra of HAs with a concentration of NaHCO3 of (a) 0.005 mol L−1 and (b) 0.05 mol L−1. | ||
In addition, HAs can be classified into four types including A, B, Rp and P:14 for type A, the ΔlogK values are lower than 0.6 and the UV-Vis spectra are featureless; for type B, a shoulder at 270–280 nm appears in the UV-Vis spectra and the ΔlogK values are 0.6–0.8; for type Rp, the ΔlogK values are 0.8–1.1 and a shoulder at 270–280 nm appears; and for type P, there are characteristic absorptions at 615, 570 and 450 nm. For our samples, both the ZLHA and MLHA are of type B.
3.3 FTIR spectrometry
The FTIR spectra of the samples are presented in Fig. 2, the spectra have common and distinctive features. The sharp absorbance band at around 3450–3200 cm−1 were observed and assigned to the O–H stretching of groups like phenols and/or alcohol and the N–H stretching of amines (minor) and amides.13–15,27,28 At around 3040 cm−1, the band of MLHA was assigned to the aromatic hydrogen bond.4 At 3000–2800 cm−1, a broad band appears resulting from the stretching of the C–H of methylene in the HAs.3,27 According to the literature,28 the OH stretching vibration of the hydrogen-bonded COOH occurs at 2700–2500 cm−1. A sharp band at 1800–1700 cm−1 was attributed to the stretching of C![[double bond, length as m-dash]](https://www.rsc.org/images/entities/char_e001.gif) O in carboxyl. Vibrations of aromatic CC and CO stretching of amide groups were observed in the range of 1700–1600 cm−1. At about 1510 cm−1, the spectra bands were attributed to CN stretching and N–H deformation. The spectra bands at around 1450 cm−1 originated from the C–H deformation of aliphatic carbon, and the intensity of MLHA is stronger than that of ZLHA, which indicates that the MLHA has more aliphatic structures. A small sharp band in the region 1370–1300 cm−1 was presented due to the stretching vibrations of –C(CH3) and the methyl group, and the deformation of the methylene of the cyclic structures.29 At around 1260–1220 cm−1, the band was assigned to the O–H and C–O deformation in the carboxyl, phenoxy and aryl ester.30 The C–O deformation of polysaccharides occurs at the region 1100–900 cm−1. A band presented at 900–650 cm−1 was ascribed to the C–H deformation out of plane in the aromatic ring including the O-substituted benzene, mono substituted benzene and condensed benzene ring.4 The band presented at 600–400 cm−1 was attributed to the Si–O vibration stretching,31 and the intensity of MLHA is higher than that of ZLHA, which may be attributed to the higher ash contents of MLHA, this result is in agreement with the proximate analyses of HAs.
O in carboxyl. Vibrations of aromatic CC and CO stretching of amide groups were observed in the range of 1700–1600 cm−1. At about 1510 cm−1, the spectra bands were attributed to CN stretching and N–H deformation. The spectra bands at around 1450 cm−1 originated from the C–H deformation of aliphatic carbon, and the intensity of MLHA is stronger than that of ZLHA, which indicates that the MLHA has more aliphatic structures. A small sharp band in the region 1370–1300 cm−1 was presented due to the stretching vibrations of –C(CH3) and the methyl group, and the deformation of the methylene of the cyclic structures.29 At around 1260–1220 cm−1, the band was assigned to the O–H and C–O deformation in the carboxyl, phenoxy and aryl ester.30 The C–O deformation of polysaccharides occurs at the region 1100–900 cm−1. A band presented at 900–650 cm−1 was ascribed to the C–H deformation out of plane in the aromatic ring including the O-substituted benzene, mono substituted benzene and condensed benzene ring.4 The band presented at 600–400 cm−1 was attributed to the Si–O vibration stretching,31 and the intensity of MLHA is higher than that of ZLHA, which may be attributed to the higher ash contents of MLHA, this result is in agreement with the proximate analyses of HAs.
 | ||
| Fig. 2 FTIR spectra of ZLHA and MLHA. | ||
In this work, the relative contents of –COOH and aromatic CC were calculated by the corresponding integral area of the FTIR spectra and are presented in Table 3. The carboxyl group content of ZLHA (0.03) in Table 3 was higher than that of MLHA (0.02). Additionally, the ratio (ratio intensity at 1720 cm−1 to intensity at 1220 cm−1) could be used to measure the carboxyl content32 and the results of the samples are listed in Table 3, the ratios of ZLHA and MLHA were 1.16 and 0.81 respectively. These two results show that the ZLHA has more carboxyl groups than MLHA. This conclusion can be confirmed by the O/C ratio in Table 2, the O/C ratio of ZLHA (0.37) was higher than that of MLHA (0.26). In addition, ZLHA has more aromatic structures according to the relative contents of aromatic CC for both ZLHA (0.02) and MLHA (0.01) in Table 3.
| HAs | Area%a | Cal/Car | 1720/1220 | fab | O/Cc | Δd | fae | |
|---|---|---|---|---|---|---|---|---|
| –COOH | Aromatic CC |
|||||||
| a Calculated using the ratio of the integral areas of aromatic CC and –COOH to the total integral areas of the FTIR spectra, respectively.b Calculated using the ratio relative area of aromatic carbon to total carbon obtained by 13C NMR.c Calculated by the data obtained from 13C NMR, O/C = [area% (150–160 ppm) + 2 × Area% (160–190 ppm) + area% (150–160 ppm)]/area% (total carbon).d The difference of O/C (13C NMR) – O/C (ultimate analysis).e Calculated from the ratio of the relative area of the G band to the sum of the relative areas of the γ1 band and G band obtained from XRD. |
||||||||
| ZLHA | 0.03 | 0.02 | 1.05 | 1.16 | 0.45 | 0.30 | −0.07 | 0.51 |
| MLHA | 0.02 | 0.01 | 1.23 | 0.81 | 0.43 | 0.27 | 0.01 | 0.41 |
3.4 CP/MAS 13C NMR spectrometry
The CP/MAS 13C NMR spectra could explain the carbon contents of the HAs and they are associated with aliphatic carbon (0–45 ppm), O-alkyl carbon (50–90 ppm), aromatic carbon (110–150 ppm), phenolic carbon (150–160 ppm), and carbonyl carbon (160–220 ppm).7,14,18,33 The peak fitting of the 13C NMR spectra was used in the analysis of HA–graphene oxide,33 but this method has never been applied to the analyses on the HAs' structural features. As a result, the CP/MAS 13C NMR spectra of samples are displayed in Fig. 3. The spectra of ZLHA and MLHA were fitted with eleven peaks, and the assignments of chemical shift are summarized in Table 4. | ||
| Fig. 3 CP/MAS 13C NMR spectra and fitting peaks of HAs ((a) ZLHA, (b) MLHA). Lines: red – the spectra of the HAs and black – fitting curves. | ||
| Peak Number | Assignment | ZLHA | MLHA | ||
|---|---|---|---|---|---|
| CCSa | RPb | CCSa | RPb | ||
| a CCS, center of chemical shift of each fitting peak (in ppm).b RP, relative proportion (in %) of each fitting peak corresponding to the total area of fitted curves in Fig. 3. | |||||
| 1 | Terminal methyl | 19.0 | 6.39 | 20.0 | 9.07 |
| 2 | CH3–carbonyl | 31.0 | 10.32 | 31.0 | 12.00 |
| 3 | Polymethylene, alicyclic | 41.5 | 9.58 | 40.0 | 10.40 |
| 4 | Methoxyl | 54.5 | 5.90 | 54.5 | 6.13 |
| 5 | Carbohydrates | 75.0 | 7.57 | 75.5 | 6.40 |
| 6 | Heteroaromatics | 114.0 | 17.69 | 113.0 | 13.87 |
| 7 | Aromatic rings | 130.8 | 15.53 | 130.0 | 17.80 |
| 8 | Substituted aromatic rings | 145.7 | 4.77 | 145.7 | 4.21 |
| 9 | Phenols | 155.0 | 7.47 | 155.0 | 6.99 |
| 10 | Carboxyls, esters | 172.0 | 7.42 | 173.0 | 6.40 |
| 11 | Ketones, aldehydes | 204.0 | 7.37 | 204.0 | 6.93 |
The data in Table 4 indicate that aliphatic carbon (0–45 ppm) and aromatic carbon (110–150 ppm) are the main carbon contents in the samples, and MLHA contains more aliphatic carbon (31.47%) than ZLHA (26.29%), while ZLHA has more aromatic carbon (45.46%) than MLHA (42.87%). The HAs' aromaticity (fa) values were calculated from the ratio of the relative area (aromatic carbon) to the relative area (total carbon) and are listed in Table 3, the results indicate that ZLHA has a higher aromaticity (0.45) than MLHA (0.43), this result is confirmed by the Cal/Car values of ZLHA (1.05) and MLHA (1.23), because the higher the Cal/Car value, the lower the aromaticity.
The O/C ratios of HAs were calculated by 13C NMR and are shown in Table 3, the results only contained the oxygen content within the phenols, carboxyl, ester, ketones and aldehyde, whereas the O/C ratios acquired by the ultimate analyses measured the whole oxygen contents in the HAs. If all the oxygens in the HAs are presented in phenols, carboxyls, esters, ketones, and aldehydes (150–220 ppm), the difference calculated by [O/C (13C NMR) – O/C (ultimate analysis)] could be used to obtain the contributions from ethers and alcohols which are not present in carboxyls, esters, ketones, and aldehydes,17 and the differences are listed in Table 3. The values of ZLHA (−0.07) and MIHA (0.01) indicate that the contributions of ethers and alcohols to the structures of the HAs are minor.
3.5 XRD patterns
The XRD patterns of the samples are presented in Fig. 4 and exhibit four peaks at around 19, 25, 32 and 43°, which are ascribed to the γ1, G, γ2 and 10 bands, respectively. The peak at 22 degrees of 2-theta (γ1 band) was attributed to aliphatic carbon, and the peak at 25 degrees of 2-theta (G band) was assigned to aromatic carbon.19 | ||
| Fig. 4 XRD patterns and fitting curves of the HAs ((a) ZLHA and (b) MLHA). Lines: red – XRD patterns of the HAs and black – fitting curves. | ||
To obtain the aromaticity of ZLHA and MLHA, the XRD patterns were fitted with four sub-peaks, and the details are summarized in Table 5. The data of the γ1 band of both ZLHA (36.62%) and MLHA (51.03%) indicate that MLHA contains more aliphatic carbon than ZLHA; the relative areas of the G band show that the aromatic carbon of ZLHA (37.36%) is higher than that of MLHA (35.25%). The HAs' aromaticity values were calculated by XRD and are listed in Table 3, the aromaticity of ZLHA (0.51) was higher than that of MLHA (0.41). These results are in agreement with conclusions obtained from CP/MAS 13C NMR. The aromaticity obtained from XRD was higher than the result of CP/MAS 13C NMR, which could be ascribed to some carbon not being included in the γ1 and G band.
| Peak number | Assignment | 2-Theta (degree) | Relative proportion | ||
|---|---|---|---|---|---|
| ZLHA | MLHA | ZLHA | MLHA | ||
| 1 | γ1 band | 18.20 | 18.81 | 36.62 | 51.03 |
| 2 | G band | 23.40 | 24.00 | 37.36 | 35.25 |
| 3 | γ2 band | 33.00 | 36.30 | 10.96 | 4.38 |
| 4 | 10 band | 41.30 | 42.04 | 15.05 | 9.35 |
3.6 XPS analysis
XPS was used for analyses of the surface elements. The XPS C1s spectra of the samples are presented in Fig. 5, and the spectra were fitted by the six chemical states of carbon associated with (1) aromatic carbon (C–C or C–H), (2) aliphatic carbon (C–C or C–H), (3) α carbon (C–C(O)), (4) ether or alcohol carbon (C–O), (5) ketonic carbon (CO), and (6) carboxylic carbon. The binding energy, chemical assignment and relative proportion of the different elements contained in functional groups are listed in Table 6. However, the aromaticity of HAs is not estimated from the XPS spectra, and the hydroxyl and ether also cannot be distinguished according to some reports in the literature.3,34
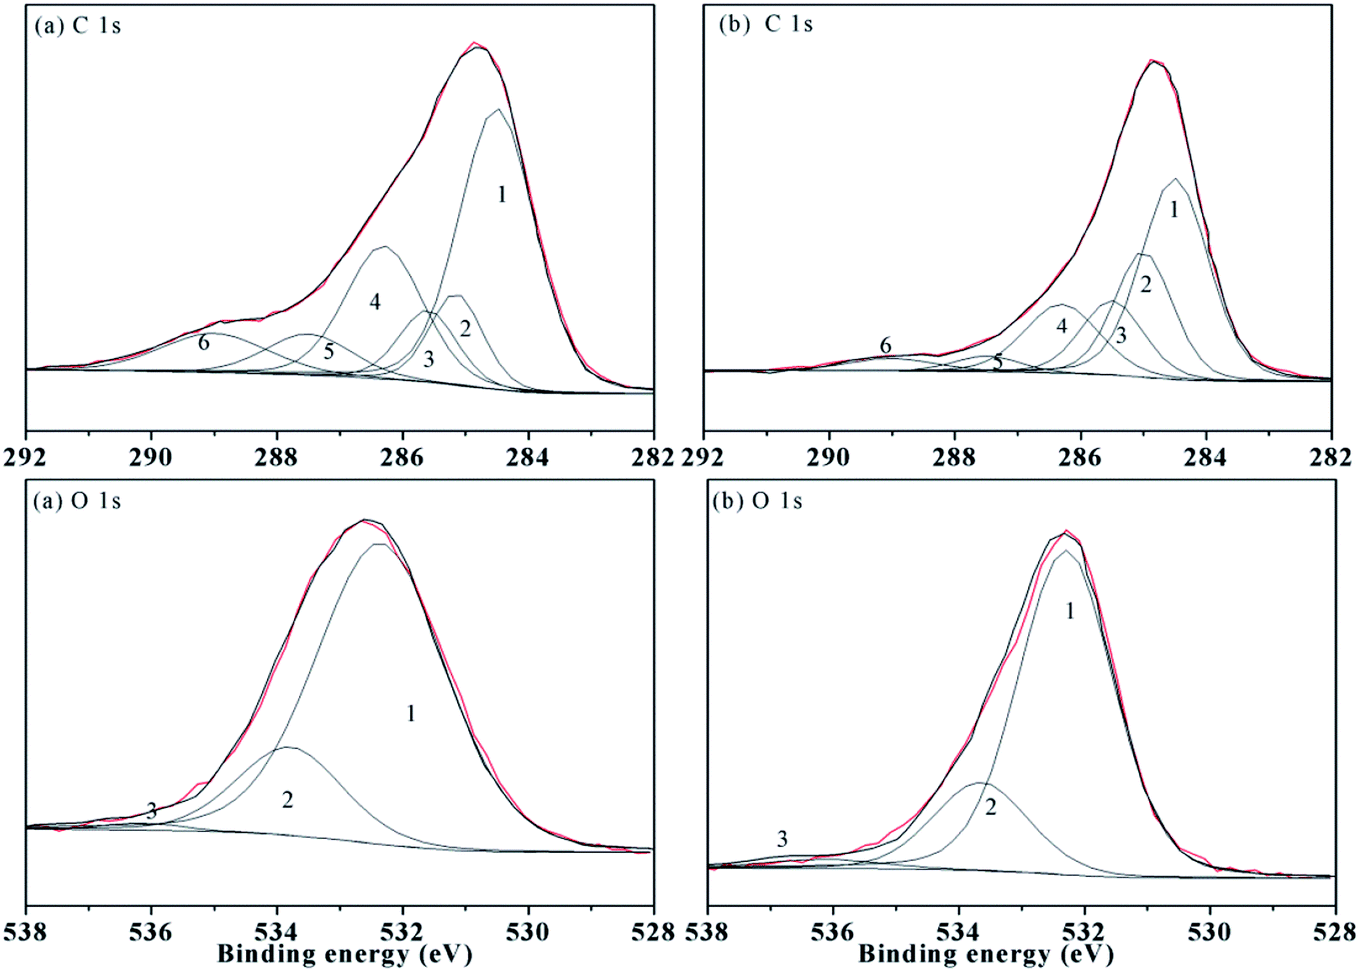 | ||
| Fig. 5 XPS carbon (C 1s) and oxygen (O 1s) spectra of the HAs ((a) ZLHA and (b) MLHA). Lines: red – spectra of HAs and black – fitting curves. | ||
| Name | Peak | Assignment | ZLHA | MLHA | ||
|---|---|---|---|---|---|---|
| BEa | RPb | BEa | RPb | |||
| a BE, binding energy (in eV).b RP, relative proportion (in %) of each functional group corresponding to the total area of the fitted curves in Fig. 5. | ||||||
| C 1s | 1 | Aromatic C–C/C–H | 284.50 | 44.09 | 284.50 | 41.33 |
| 2 | Aliphatic C–C/C–H | 285.15 | 10.10 | 285.00 | 22.24 | |
| 3 | α carbon (C–C(O)) | 285.60 | 8.58 | 285.50 | 14.16 | |
| 4 | Ether or alcohol carbon (C–O) | 286.30 | 21.28 | 286.30 | 15.66 | |
| 5 | Ketonic carbon (CO), |
287.50 | 7.29 | 287.50 | 3.14 | |
| 6 | Carboxylic carbon (C(O)O) | 289.00 | 8.66 | 289.00 | 3.48 | |
| O 1s | 1 | O-binding (CO) |
532.25 | 79.82 | 532.30 | 76.46 |
| 2 | C–O | 533.80 | 19.05 | 533.65 | 20.81 | |
| 3 | Absorptive oxygen | 536.14 | 1.13 | 536.15 | 2.73 | |
The data in Table 6 demonstrate that ZLHA contains more aromatic carbon (44.09%) than MLHA (41.33%), while MLHA has more aliphatic carbon (22.24%) than ZLHA (10.10%). In addition, the relative proportion of carboxylic carbon in ZLHA (8.66%) was higher than that of MLHA (3.48%), which indicates that ZLHA contains more carboxyl than MLHA. These results are in line with the conclusion obtained from the FTIR analyses of the HAs.
The XPS O1s spectra are also presented in Fig. 5, and the spectra were fitted by three peaks associated with the O-binding (SiO2/CO) at about 532.00 eV, C–O structures at about 533.7 eV and absorptive oxygen at about 536.00 eV. Generally, the HAs contain a lower content of SiO2, so the first peak was attributed to the CO. The O-binding (CO) contents in Table 6 indicate that the oxygens in CO are the main existing form of oxygen in the HAs. Besides, the contents of C–O and absorptive oxygen in ZLHA and MLHA were 20.18% and 23.54% respectively, which shows that MLHA has less CO, this result is in line with the conclusion of the CP/MAS 13C NMR that the contents of ethers and alcohols are minor.
4. Conclusions
Comprehensive spectral analyses in this work were used to analyze the structural features of ZLHA and MLHA, and the structural differences of the HAs have been obtained using multi-peak fitting of CP/MAS 13C NMR, XRD and XPS.The yields of ZLHA and MLHA were 48.6% and 32.8% respectively; proximate and ultimate analyses demonstrate that ZLHA has more oxygen-containing groups than MLHA. UV-Vis analyses demonstrate that both ZLHA and MLHA are type B HAs, and the molecular weight of MLHA is higher than that of ZLHA. FTIR results indicate that the carboxyl content of ZLHA is higher than that of MLHA. Additionally, FTIR, CP/MAS 13C NMR and XRD analyses demonstrate that the aromaticity of MLHA is lower than ZLHA. According to the XPS analyses, the C1s spectra show that ZLHA contains more aromatic structures than MLHA and the content of aliphatic structures in MLHA is higher than ZLHA. The oxygen states of HAs are mainly in the form of CO, and ZLHA contains more CO than MLHA. In the future, we will focus on researching the effect of increasing soil fertility when ZLHA and MLHA are applied in agriculture and other fields.
Conflicts of interest
There are no conflicts to declare.Acknowledgements
This work was supported by the National Natural Science Foundation of China (Grant 21766013) and Analysis and Testing Foundation of Kunming University of Science and Technology (Grant 2019T20070105).References
- Z. K. Li, X. Y. Wei, H. L. Yan and Z. M. Zong, Fuel, 2015, 153, 176–182 CrossRef CAS.
- Z. Yang, J.-P. Cao, X.-Y. Ren, X.-Y. Zhao, S.-N. Liu, Z.-X. Guo, W.-Z. Shen, J. Bai and X.-Y. Wei, Fuel, 2019, 237, 1079–1085 CrossRef CAS.
- L. Doskočil, J. Burdíková-Szewieczková, V. Enev, L. Kalina and J. Wasserbauer, Fuel, 2018, 213, 123–132 CrossRef.
- T. Das, B. K. Saikia, B. P. Baruah and D. Das, J. Geol. Soc. India, 2015, 86, 468–474 CrossRef CAS.
- B. Xing, R. Yuan, C. Zhang, G. Huang, H. Guo, Z. Chen, L. Chen, G. Yi, Y. Zhang and J. Yu, Fuel Process. Technol., 2017, 165, 112–122 CrossRef CAS.
- J. Peuravuori, P. Žbánková and K. Pihlaja, Fuel Process. Technol., 2006, 87, 829–839 CrossRef CAS.
- S. Nasir, T. B. Sarfaraz, T. V. Verheyen and A. L. Chaffee, Fuel Process. Technol., 2011, 92, 983–991 CrossRef CAS.
- H. Ma, Y. Qiao, C. M. Pedersen, P. Wang, M. Wu, P. Liu, X. Hou, T. Hu and Y. Wang, Fuel Process. Technol., 2018, 179, 296–301 CrossRef CAS.
- H. Martyniuk and J. Więckowska, Fuel Process. Technol., 2003, 84, 23–36 CrossRef CAS.
- H. Khaled and H. A. Fawy, Soil Water Res., 2011, 6, 21–29 CrossRef CAS.
- P. Conte, R. Spaccini, D. Šmejkalová, A. Nebbioso and A. Piccolo, Chemosphere, 2007, 69, 1032–1039 CrossRef CAS PubMed.
- F. J. Gonzalez-Vila, F. Martin, J. C. Del Rio and R. Fründ, Sci. Total Environ., 1992, 117–118, 335–343 CrossRef CAS.
- D. P. Dick, A. S. Mangrich, S. Menezes and B. F. Pereira, J. Braz. Chem. Soc., 2002, 13, 177–182 CrossRef CAS.
- M. Giovanela, J. S. Crespo, M. Antunes, D. S. Adamatti, A. N. Fernandes, A. Barison, C. W. P. da Silva, R. Guégan, M. Motelica-Heino and M. M. D. Sierra, J. Mol. Struct., 2010, 981, 111–119 CrossRef CAS.
- V. Enev, L. Pospíšilová, M. Klučáková, T. Liptaj and L. Doskočil, Soil Water Res., 2014, 9, 9–17 CrossRef CAS.
- F. Novák, M. Šestauberová and R. Hrabal, J. Mol. Struct., 2015, 1093, 179–185 CrossRef.
- T. V. Verheyen, R. B. Johns and D. T. Blackburn, Geochim. Cosmochim. Acta, 1982, 46, 269–277 CrossRef CAS.
- O. A. Trubetskoj, P. G. Hatcher and O. E. Trubetskaya, Chemoecology, 2010, 26, 315–325 CAS.
- N. Katsumi, K. Yonebayashi and M. Okazaki, Soil Sci. Plant Nutr., 2015, 61, 603–612 CrossRef CAS.
- M. Schnitzer, H. Kodama and J. A. Ripmeester, Soil Sci. Soc. Am. J., 1991, 55, 745–750 CrossRef CAS.
- L. S. K. Pang, A. M. Vassallo and M. A. Wilson, Org. Geochem., 1990, 16, 853–864 CrossRef CAS.
- B. Allard, Geoderma, 2006, 130, 77–96 CrossRef CAS.
- U. Fooken and G. Liebezeit, Mar. Geol., 2000, 164, 173–181 CrossRef CAS.
- J. Peuravuori and K. Pihlaja, Anal. Chim. Acta, 1997, 337, 133–149 CrossRef CAS.
- G. Kunal and M. Schnitzer, J. Soil Sci., 1979, 30, 735–745 CrossRef.
- K. Kumada, Soil Sci. Plant Nutr., 1965, 11, 11–16 CrossRef.
- M. Drosos, M. Jerzykiewicz and Y. Deligiannakis, J. Colloid Interface Sci., 2009, 332, 78–84 CrossRef CAS PubMed.
- R. Baigorri, M. Fuentes, G. González-Gaitano, J. M. García-Mina, G. Almendros and F. J. González-Vila, J. Agric. Food Chem., 2009, 57, 3266–3272 CrossRef CAS PubMed.
- B. K. Saikia, O. Sahu and R. Baruah, J. Geol. Soc. India, 2007, 70, 917–922 CAS.
- L. Doskočil, V. Enev, M. Pekař and J. Wasserbauer, Org. Geochem., 2016, 95, 34–40 CrossRef.
- D. M. Xavier, A. S. Silva, R. P. Santos, M. F. Mesko, S. Nunes Costa, F. Valder, B. Cavada and J. L. Martins, Int. J. Agric. Sci., 2012, 4, 238–242 CrossRef.
- J. Ibarra and R. Juan, Fuel, 1985, 64, 650–656 CrossRef CAS.
- S. A. Baskakov, A. S. Lobach, S. G. Vasil’ev, N. N. Dremova, V. M. Martynenko, A. A. Arbuzov, Y. V. Baskakova, A. A. Volodin, V. I. Volkov, V. A. Kazakov and Y. M. Shul’ga, High Energy Chem., 2016, 50, 43–50 CrossRef CAS.
- F. Monteil-Rivera, E. B. Brouwer, S. Masset, Y. Deslandes and J. Dumonceau, Anal. Chim. Acta, 2000, 424, 243–255 CrossRef CAS.
| This journal is © The Royal Society of Chemistry 2020 |