DOI:
10.1039/D0RA03051A
(Paper)
RSC Adv., 2020,
10, 20504-20514
Aqueous Cu(II) ion adsorption by amino-functionalized mesoporous silica KIT-6
Received
4th April 2020
, Accepted 21st May 2020
First published on 28th May 2020
Abstract
To find an alternative adsorbent with high adsorption performance, KIT-6 was prepared by hydrothermal crystallization synthesis using tetraethyl orthosilicate as a silicon source and triblock copolymer P123 as a template. Then the silane coupling agent (3-chloropropyl)trimethoxysilane was first grafted onto KIT-6 mesoporous material and then the polyethyleneimine (PEI) was further grafted through the substitution reaction between amino groups and chlorine atoms. The functionalized KIT-6 was denoted as PEI/KIT-6. The samples were characterized by X-ray diffraction (XRD), scanning electron microscopy (SEM), N2 adsorption–desorption, elemental analysis (EA), Fourier transform infrared spectroscopy (FT-IR) and thermal gravimetric analysis (TGA). The Cu2+ adsorption performance was determined by inductively coupled plasma (ICP). The results showed that the average loading of the amino groups was 3.74 mmol g−1, and the modified KIT-6 still has a stable mesoporous structure without pore blockage. With the dosage of 1 g L−1 PEI/KIT-6 and at room temperature, the optimum pH value for adsorption of 100 mg L−1 Cu2+ was 6.0. The adsorption capacity of PEI/KIT-6 for Cu2+ increased with the increase of reaction temperature, and the maximum adsorption capacity of Cu2+ was 36.43 mg g−1. The adsorption capacity tends to reach equilibrium after 120 min, and the optimum adsorption temperature was 35 °C. The pseudo-second-order kinetic model was found to be well suited for the adsorption process of Cu2+. Adsorption equilibrium data could also be described well by the classical Langmuir and Freundlich isotherm models. The adsorption tends to be the chemisorption of a monolayer.
Introduction
With the rapid development of electroplating, metallurgy, printing and dyeing and electronics industries, the damage caused by heavy metal pollution to the environment is becoming more and more serious. Various nanomaterials,1–5 membrane materials,6 and photocatalytic materials7–9 are often used in the removal or separation of organic dyes from wastewater, such as zirconia nanoparticles,10 titanium dioxide nanomaterials,11–14 zinc dioxide nanomaterials,15,16 Bi2WO6 nanofilms,17 etc. However, these materials cannot remove or separate inorganic salt ions from wastewater.18 Tohid Tavangar et al. used a loose nano-filtration polyethersulfone membrane loaded with cerium oxide to separate Mg, Na and other inorganic salts from printing and dyeing wastewater.19 Notably, there are some characteristics of heavy metals, such as toxicity, pollution concealment, easiness to migrate and pollution persistence. What's more, it could accumulate in living organisms and affect one's health.20 For example, if the copper ion content in drinking water exceeds 1.3 mg L−1, it could cause damage to both infants and adults, like diarrhea, vomiting, nausea and even liver cancer.21 Among these methods, adsorption is by far the most versatile and widely used method for its low cost, simple operation and great efficiency.22 Therefore, there have been various porous materials designed as adsorbents, such as zeolites,23 mesoporous silicas,24 metal organic frameworks,25 and activated carbons.26 In addition, mesoporous SiO2 is a kind of adsorbent with the advantages of large specific surface area, developed pores and easy functionalization, which could accommodate organic functional groups with special functions for organic functionalization. The adsorbent obtained has the orderly mesoporous pore structure and good selective adsorption. Organic groups are often used to modify the surface of mesoporous SiO2 for the adsorption of heavy metal ions such as lead ions, copper ions, and mercury ions present in solution.27–30 KIT-6, with a three-dimensional (3D) cubic Ia3d symmetric structure and porous networks, has high specific surface area, large pore volume, high hydrothermal stability and large readily tunable pores with thick pore walls.31,32 Therefore, KIT-6 has more adsorption sites for modification and functionalization and can be more resistant to pore blockage and has a good mass transfer of the reactant molecules through the channels.33
However, so far there are few reports on the adsorption of heavy metals by amino-modified mesoporous material KIT-6 in water and no report on the preparation of amino-modified KIT-6 to adsorb Cu2+ by grafting method in two steps.34 Therefore, a new adsorbent was synthesized by using two-step grafting method to modify molecular sieve to find a better adsorbent for Cu2+ in wastewater. In this study, tetraethyl orthosilicate and the triblock copolymer P123 were respectively used as silicon source and template to prepare the mesoporous molecular sieve KIT-6. With the two-step grafting method, namely, the silanylation of KIT-6 by (3-chloropropyl)trimethoxysilane coupling agent before the substitution of chlorine atoms with amino groups on PEI, to produce a new material PEI/KIT-6. Then its structure was characterized, and the cyclic adsorption performance of the material and the influence of different experimental factors on the Cu2+ adsorption of the material were studied.
Experimental
Materials
Sodium hydroxide, absolute ethanol, toluene, tetraethyl poly(ethylene glycol)–poly(propylene glycol)–poly(ethylene glycol) triblock copolymer (P123, EO20PO70EO20, Mw = 5800, Aldrich, USA). Hydrochloric acid, tetraethyl orthosilicate (TEOS, 99 wt%), N-butanol (99.5 wt%) were from Xilong Chem. Reagent Co., Shantou, China. Lead nitrate is analytically pure. (3-Chloropropyl)trimethoxysilane (98 wt%) and polyethyleneimine (PEI, 99 wt%) were obtained from Aladdin Industrial Co., Shanghai, China.
Characterization
XRD patterns were measured with a X'Pert X-ray diffractometer (PANalytical, Netherlands). The surface characteristics and pore structure of samples were analyzed by using S-4800 scanning electron microscope (Hitachi, Japan). Nitrogen adsorption/desorption tests were carried out on a NOVA2000e automatic surface analyzer (Quantachrome, USA). Surface area was calculated by Brunauer–Emmett–Teller (BET) equation. Fourier transform infrared spectra (FT-IR) were detected with a Nexus 470 IR spectrometer (Nicolet, USA) in wavenumber range of 4000–400 cm−1. Thermal gravimetric analysis (TGA) was performed on a SDT Q600 TGA (TA, USA) in nitrogen flow up to 850 °C.
The synthesis and modification of KIT-6
The synthesis of KIT-6. The synthesis of KIT-6 silica was carried out according to the literature.35,36 The typical synthesis process is as follows: 4.0 g P123 was dissolved in a mixture of 144 g deionized water and 6.7 g 36 wt% HCl at 35 °C. After 2 h stirring, the P123 was totally dissolved in the solution, 4.94 mL N-butanol was added. The mixture was continuously stirred at 35 °C for 1 h and then heated to 40 °C. 9.24 mL tetraethyl orthosilicate was pipetted dropwise into the mixture with rapidly stirring at 450 rpm for 24 h. Resulting mixture inside a Teflon autoclave was then sealed and subsequently placed in the oven at 100 °C for 24 h. After the autoclave was cooled to room temperature, the aged precipitate was vacuum filtered at room temperature and then dried at 100 °C for 24 h. The resultant material is herein denoted as KIT-6.
The modification of KIT-6. 1 g of KIT-6 was added into 50 mL of toluene, then 1 g of (3-chloropropyl)trimethoxysilane was added into them. After that, they were mixed well before zeolite was added into them and lasted for 10 h. The suspension was vacuum filtered, and was repeatedly washed with absolute ethanol for several times and dried at 100 °C for 12 h to obtain a chloropropylated KIT-6 material.1 g of PEI was added to 25 mL of absolute ethanol, and stirred at room temperature for 10 minutes to prepare a mixed solution. 1 g of chloropropylated KIT-6 material was added into the solution and magnetically stirred for 6 h at 90 °C in a water bath. After the suspension was cooled to room temperature, it was filtered, was repeatedly washed with ultrapure water several times, and then dried at 80 °C to obtain a final product, which was designated as PEI/KIT-6. A schematic representation of the process for the preparation of PEI/KIT-6 is shown in Fig. 1.
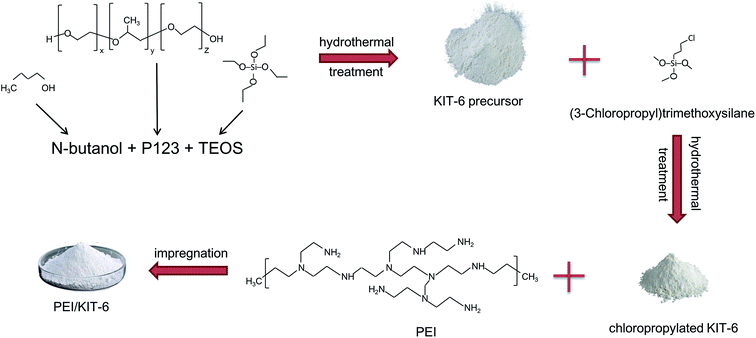 |
| | Fig. 1 Schematic representation of the preparation of PEI/KIT-6. | |
The adsorption experiment of copper ion
0.02 g of PEI/KIT-6 was added to a 20 mL simulated waste water containing Cu2+. After adsorption for a certain period of time, the suspension was collected from the flask and centrifuged at 4000 rpm for 3 min. The concentration of Cu2+ in the solution was detected by ICAP-7400 Inductively Coupled Plasma Emission Spectrometer (ICP) (Thermo Fisher Scientific, USA). The adsorption properties of the adsorbent and the adsorption rate of the adsorbent were calculated according to the following eqn (1) and (2):| |
 | (1) |
| |
 | (2) |
where Q is the calculated adsorption capacity of the adsorbent (mg g−1), C0 and Ce are the concentrations of Cu2+ before adsorption (mg L−1) and after adsorption (mg L−1), respectively. V is the volume of wastewater in the adsorption experiment (L) and m is the amount of adsorbent in the adsorption experiment (g). R is the adsorption rate of the adsorbent.
Results and discussion
The results of X-ray diffraction (XRD)
The quality of 3D cubic KIT-6 support obtained after hydrothermal synthesis and calcination was examined by low angle XRD to ascertain that material structure is retained after the calcination. The XRD patterns of KIT-6 and PEI/KIT-6 are presented in Fig. 2. As seen in Fig. 2, for sample (a), there was an intense plane diffraction peak (211) and a weak plane diffraction peak (220) in the region 1(2θ). It indicates that the sample possesses the characteristics of the Ia3d cubic phase mesoporous material, which was similar to the KIT-6 reported by the Ryoo group,35 indicating that KIT-6 was synthesized successfully. It can be seen from (b) of Fig. 2 that the diffraction peaks of PEI/KIT-6 on the (211) and (220) crystal planes are weaker than KIT-6, and shifted slightly towards right. This may be due to the fact that the PEI molecules are grafted on the surface of KIT-6 and occupy part of its pores. It showed that the cubic phase structure of KIT-6 was not destroyed during the surface amino-functionalization process.
 |
| | Fig. 2 Low-angle X-ray diffraction of the KIT-6 and the PEI/KIT-6. | |
The results of scanning electron microscopy (SEM)
The surface morphology of the prepared KIT-6 and PEI/KIT-6 was characterized by scanning electron microscope (SEM). KIT-6 material exhibits a hard, rock-like amorphous morphology (Fig. 3), which was similar to the report by Prabhu et al.37 By comparison of the appearance features of the SEM micrographs, it could be found that modification by PEI did not change KIT-6 surfaces obviously (Fig. 4). Both materials have no fixed particle morphology.
 |
| | Fig. 3 SEM images of KIT-6. | |
 |
| | Fig. 4 SEM images of PEI/KIT-6. | |
It can be seen from the Fig. 3 and 4 that the average particle size of PEI/KIT-6 is slightly larger than that of KIT-6. The average particle size of the KIT-6 was 47 μm, whereas the PEI/KIT-6 was 52 μm, indicating that the particle size of the KIT-6 slightly increased after the grafting of PEI.
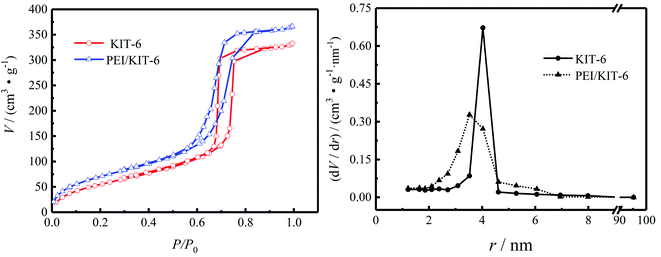
The results of N2 adsorption–desorption studies
The N2 adsorption–desorption isotherms are shown in Fig. 5 and pore size distribution of KIT-6 and PEI/KIT-6 are presented in Table 1. It can be seen that both KIT-6 and PEI/KIT-6 show type IV isotherm and a sharp capillary condensation step in the 0.6–0.8 P/P0 range, indicative of large channel like pores with a narrow range pore-size distribution and materials maintains the structural characteristics of the mesoporous material. Since PEI was grafted onto the surface of the carrier KIT-6, the specific surface area, pore volume and pore size of the material changed in different degrees, suggesting that PEI has been successfully grafted onto the surface of KIT-6. After KIT-6 was modified by polyethyleneimine (PEI![[thin space (1/6-em)]](https://www.rsc.org/images/entities/char_2009.gif) :KIT-6 mass ratio was 1:1), its pore size distribution became narrower than before. The N2 adsorption–desorption curve of PEI/KIT-6 still expressed as type IV adsorption isotherm, indicating that the modified material still maintains the ordering characteristics of mesoporous materials. This indicates that the pore size of the modified material is also uniformly distributed, and the order of the material is still maintained, which are consistent with the XRD characterization results. The physical property changes before and after the KIT-6 modification are shown in Table 1. For KIT-6, the pore radius is 4.03 nm, the specific surface area is 205.63 m2 g−1, and the pore volume is 0.55 cm3 g−1. The specific surface area, pore volume and pore radius of the material modified with polyethyleneimine (PEI) are 246.9 m2 g−1, 0.60 cm3 g−1, 3.53 nm, respectively. The change in physical properties of the material is mainly due to the PEI grafted in the channels and surface of KIT-6.
:KIT-6 mass ratio was 1:1), its pore size distribution became narrower than before. The N2 adsorption–desorption curve of PEI/KIT-6 still expressed as type IV adsorption isotherm, indicating that the modified material still maintains the ordering characteristics of mesoporous materials. This indicates that the pore size of the modified material is also uniformly distributed, and the order of the material is still maintained, which are consistent with the XRD characterization results. The physical property changes before and after the KIT-6 modification are shown in Table 1. For KIT-6, the pore radius is 4.03 nm, the specific surface area is 205.63 m2 g−1, and the pore volume is 0.55 cm3 g−1. The specific surface area, pore volume and pore radius of the material modified with polyethyleneimine (PEI) are 246.9 m2 g−1, 0.60 cm3 g−1, 3.53 nm, respectively. The change in physical properties of the material is mainly due to the PEI grafted in the channels and surface of KIT-6.
 |
| | Fig. 5 Pore size distribution and N2 adsorption desorption isotherms of KIT-6 and PEI/KIT-6. | |
Table 1 Characterization details for the KIT-6 support and PEI/KIT-6a
| Sample |
Specific surface area (m2 g−1) |
Pore volume (cm3 g−1) |
Pore radius (nm) |
| The specific surface area is calculated by the BET method; the pore volume and the pore radius are calculated by the BJH method. |
| KIT-6 |
205.63 |
0.55 |
4.03 |
| PEI/KIT-6 |
246.90 |
0.60 |
3.53 |
The results of thermogravimetric analysis
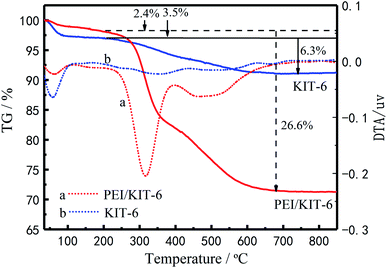
By comparison of the TG curves of KIT-6 with PEI/KIT-6, the effect of organic modifiers on material decomposition and its thermal stability are shown in Fig. 6. It can be seen from Fig. 6 that the two materials show a weight loss below 200 °C, which is attributed to the removal of adsorbed water on the surface and in the pores. The weight loss of KIT-6 is observed between 200 °C and 700 °C, which is caused by the decomposition of the templating agent. For PEI/KIT-6, there is also a stage of weight loss in the temperature range from 200 °C to 700 °C, which may be due to the pyrolysis of the functionalized groups contained on the surface of PEI/KIT-6 and the templating agent. These results indicated the successful functionalization of the KIT-6. Accordingly, the results of weight loss can be seen from the DTG curves, there are two peaks. The first one stands for the removal of adsorbed water on the surface and in the pores and the next one for the decomposition of the templating agent. The different thermogravimetric parameters were shown in Table 2.
 |
| | Fig. 6 The TG curves of KIT-6 and PEI/KIT-6. | |
Table 2 The thermal behaviour parameters of mesoporous materialsa
| Sample |
TG/(°C) |
Weight loss (%) |
| Tonset |
Tp |
Tg |
ΔT |
| Tonset is the extrapolated initial temperature, Tp is the peak temperature, and Tg is the extrapolated end temperature. |
| KIT-6 |
48/248 |
58/358 |
580 |
532 |
3.5/6.3 |
| PEI/KIT-6 |
47/271 |
62/316 |
618 |
571 |
2.4/26.6 |
The results of elemental analysis
The N content in the material before and after the grafting in Table 3 were obtained by the elemental analysis. By measuring the content of N in KIT-6-Cl and PEI/KIT-6, the content of amine in KIT-6 after modification can be analysed. It can be seen in Table 3 that the amount of C in KIT-6-Cl increased due to the grafting of (3-chloropropy)ltrimethoxysilane. In addition, since the silane coupling agent does not contain an amine group, the amount of N in KIT-6-Cl has no change. After grafting PEI, the C content in the sample further increased. What's more, the N content increased significantly, indicating that PEI was successfully grafted onto KIT-6.
Table 3 Elemental analysis of KIT-6, KIT-6-Cl and PEI/KIT-6
| Sample |
Element content (%) |
Na (mmol g−1) |
| C |
H |
N |
| The nitrogen content (mmol g−1) of the adsorbents was calculated from the ratio between N-content (%) directly attained by elemental analysis and molar mass of nitrogen. KIT-6-Cl represents the silane coupling agent grafted KIT-6. |
| KIT-6 |
3.20 |
1.62 |
0.04 |
— |
| KIT-6-Clb |
11.71 |
2.59 |
0.05 |
— |
| PEI/KIT-6 |
18.17 |
3.86 |
5.23 |
3.74 |
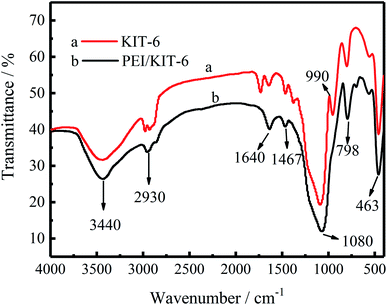
The results of Fourier transform infrared spectroscopy (FT-IR)
Infrared spectra are useful to ascertain the presence of various functional groups and structure. The FT-IR spectra of KIT-6 and PEI/KIT-6 are displayed in Fig. 7. As seen in Fig. 7, for the both two samples, there is a wide absorption bands in the wavelength range of 3500–3300 cm−1, which is caused by the O–H stretching vibration of the silanol groups of the surface and the physically adsorbed water.38,39 It means that both the two samples have a hydroxyl group, while the hydroxyl content of material after grafting is lower. The symmetry and antisymmetric stretching peaks of the methyl group appear at 2930 cm−1,40 while the peak at 1640 cm−1 is caused by the O–H stretching vibration of the silanol groups of the material surface.41 As can be seen from Fig. 7, the synthesized sample materials have three distinct characteristic peaks at 1080, 798 and 463 cm−1, respectively. The framework region spectrum of KIT-6 consists of bands centered at 1080 cm−1 is large, which is formed by the asymmetric vibration of the Si–O–Si bond. The peak near 798 cm−1 is due to the symmetric vibration of the Si–O–Si bond, and the absorption peak near 463 cm−1 is attributed to the bending vibration of Si–O–Si.42–44 These characteristic peaks prove the existence of KIT-6 skeleton, and also indicate that the grafting of PEI does not destroy the original skeleton structure of KIT-6. In addition, the peak at 1467 cm−1 is attributed to –CH2 bending vibration.45 Furthermore, the curve of KIT-6 has a peak at 990 cm−1, which is attributed to the stretching vibrations of Si–OH, while this peak disappeared after grafting. It may be due to the chemical reaction between Si–OH group on the surface of KIT-6 and the PEI modifier, resulting in the reduction of the silicon hydroxyl group on the surface of the material. The results provided clear evidence that PEI was grafted on the KIT-6 support.
 |
| | Fig. 7 Infrared spectra of unmodified KIT-6 and PEI/KIT-6. | |
Effect of different factors on the adsorption performance of Cu2+
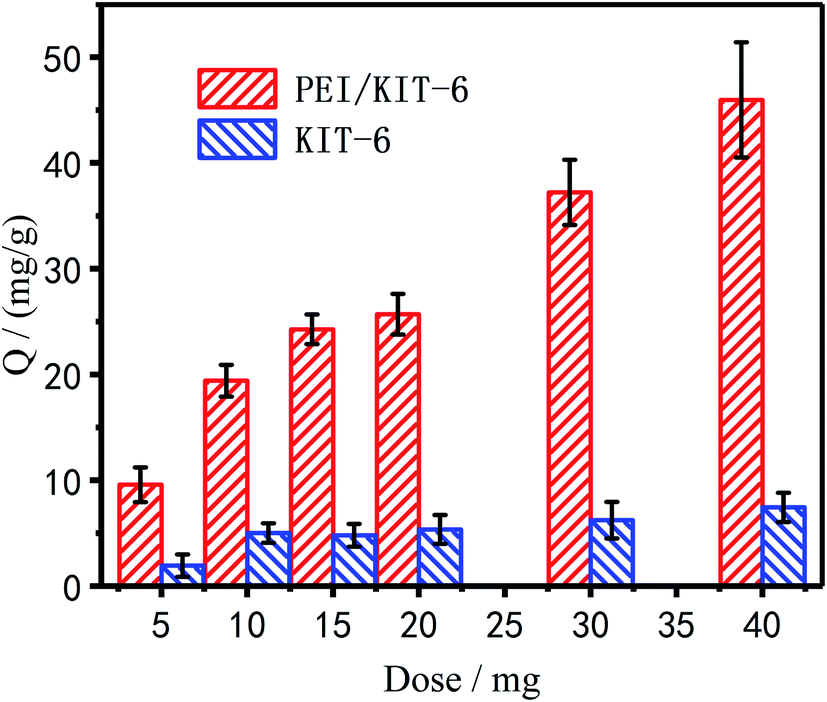
Effect of modification on the adsorption performance of Cu2+. Adsorption of Cu2+ under different dosages before and after modification was summarized in Fig. 8, which showed that as the dosage increased, the amount of adsorption increased. It is due to the increase of the adsorption sites in the system, which is more beneficial to remove Cu2+. When PEI was modified on the surface of KIT-6, the adsorption amount of PEI/KIT-6 on Cu2+ was significantly improved.
 |
| | Fig. 8 Adsorption of KIT and PEI/KIT-6 under different dosages of Cu2+. | |
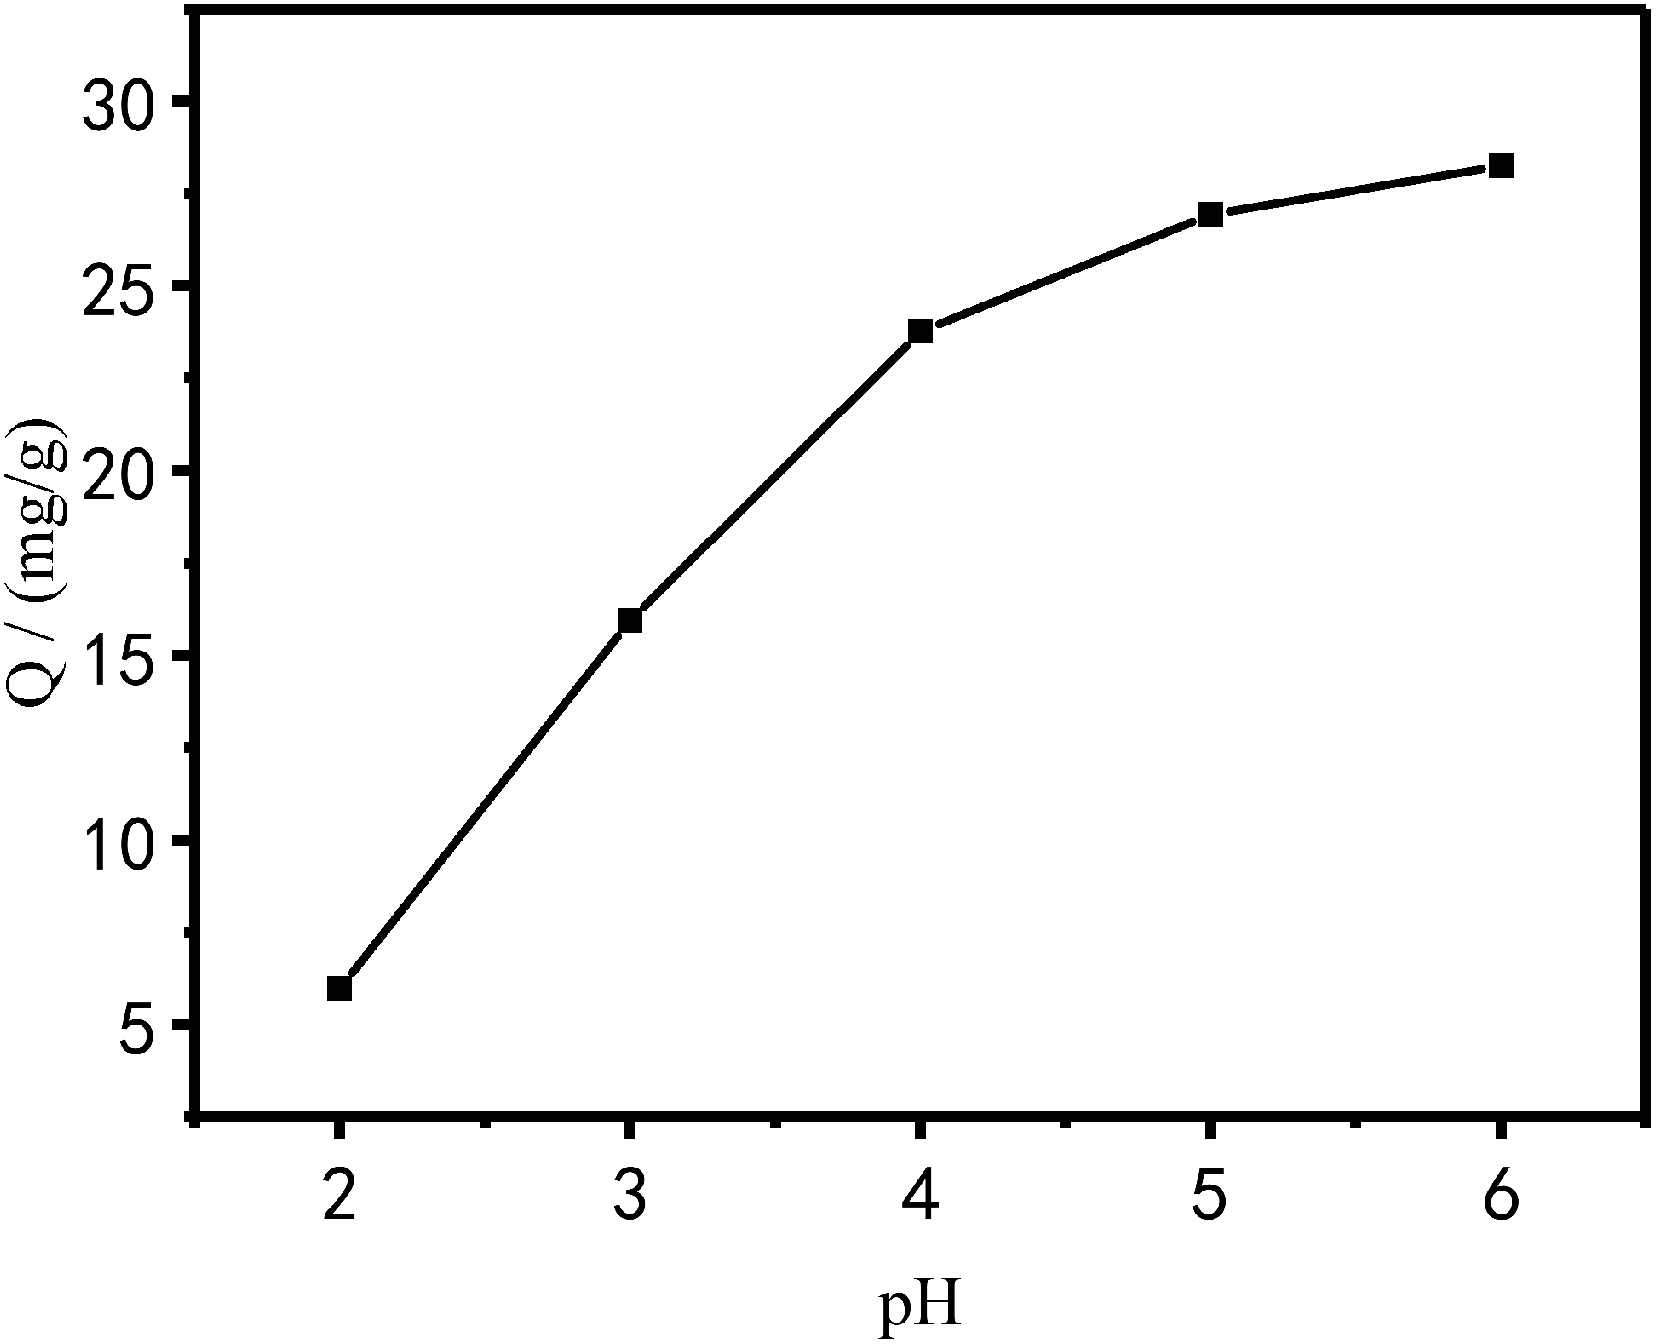
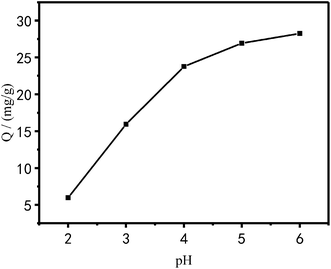
Effect of pH on the adsorption performance of Cu2+. The effect of the solution pH on the adsorption of Cu2+ onto PEI/KIT-6 is shown in Fig. 9. Since the precipitation of Cu2+ is expected when the pH is greater than 6.0, the test is carried out in the pH range of 2.0 to 6.0. It can be seen in Fig. 9 that the adsorption capacity of PEI/KIT-6 to Cu2+ increased as the pH increased, which indicates that the pH value has a great effect on the adsorption performance of Cu2+. When the pH value is below 4.0, the copper ion adsorption performance of PEI/KIT-6 is poor. When the pH is greater than 5.0, the adsorption performance of PEI/KIT-6 on Cu2+ is stronger. The maximum adsorption amount of Cu2+ by PEI/KIT-6 occurs when pH is at 6.0. This may be due to the fact that the water contains a large amount of hydrogen ions at low pH values, which can cause the functional group of the adsorbent PEI/KIT-6 to be protonated, resulting in the Cu2+ not being completely adsorbed. However, with the increase of pH, the hydrogen ions originally combined with the functional groups on the mesoporous material PEI/KIT-6 will gradually detach. The number of adsorption sites that can be used to adsorb Cu2+ increased, so the adsorption capacity increased with the pH increased. Therefore, the optimum pH value for the removal of Cu2+ from aqueous solution ranged from 5 to 6.
 |
| | Fig. 9 Effect of pH on Cu2+ adsorption (reaction at 25 °C, initial concentration: 100 mg L−1). | |
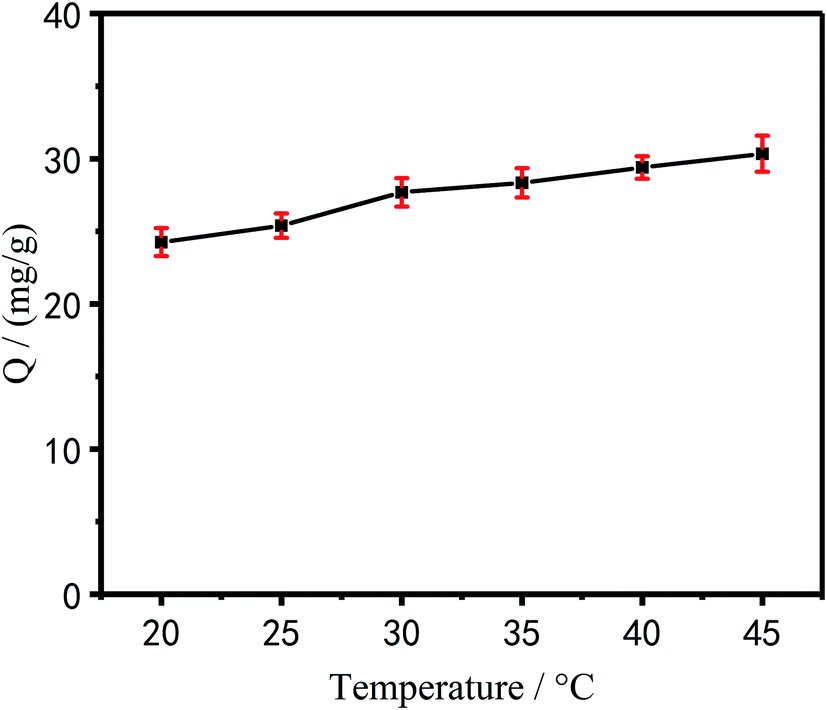
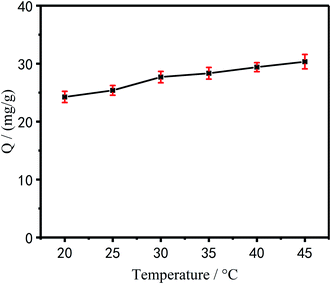
Effect of temperature on the adsorption performance of Cu2+. It can be seen from Fig. 10 that as the temperature of the reaction system increases, the adsorption capacity of PEI/KIT-6 for Cu2+ also gradually increased. When the temperature was 45 °C, the adsorption capacity of PEI/KIT-6 for Cu2+ was the highest. It can be shown that the chelating adsorption process of the modified mesoporous material PEI/KIT-6 on Cu2+ was mainly an endothermic reaction. That is to say, the temperature increase was beneficial to the adsorption process. Despite the amount of adsorption increases with increasing temperature, the increase was not large. Considering the actual engineering application, we chose room temperature (25 °C) as the optimum temperature.
 |
| | Fig. 10 Effect of temperature on Cu2+ adsorption(pH = 6.0, initial concentration: 100 mg L−1). | |
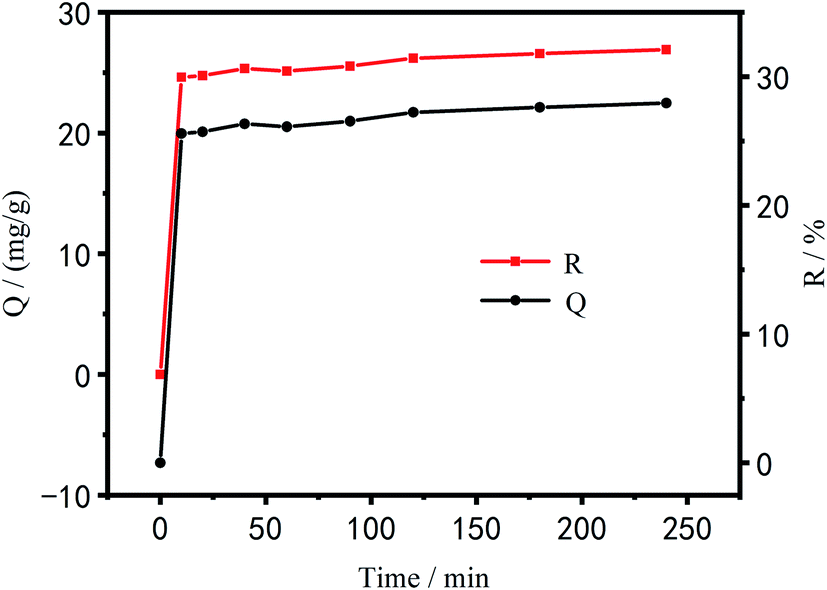
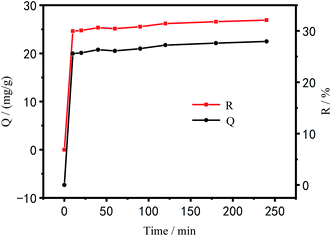
Effect of time on the adsorption performance of Cu2+. Fig. 11 shows the relationship between PEI/KIT-6 adsorption capacity and time as well as the relationship between adsorption efficiency of Cu2+ and time. As can be seen from Fig. 11, the adsorption capacity and efficiency of PEI/KIT-6 for Cu2+ gradually increased with time. The adsorption process of Cu2+ by PEI/KIT-6 can be roughly divided into two stages, the first reaction stage ranged from the beginning to the 10th min, followed by the second stage. The first stage reaction was mainly surface adsorption, namely, the adsorption capacity and adsorption efficiency greatly increased, and the adsorption reaction was very fast. In the second reaction stage, the gradual adsorption was dominant, and the adsorption reaction was relatively slow.46,47 After 120 min, it gradually entered equilibrium. In the early stage of adsorption, the mesoporous material PEI/KIT-6 contains a large number of active sites and has a high mass transfer driving force, so Cu2+ can be easily adsorbed by PEI/KIT-6. However, over time, a large amount of Cu2+ accumulates on the surface of PEI/KIT-6, which reduces the number of active sites and hinders the movement of Cu2+ so that the adsorption was nonlinear.
 |
| | Fig. 11 Effect of time on Cu2+ adsorption (reaction at 25 °C, pH = 6.0, initial concentration: 100 mg L−1). | |
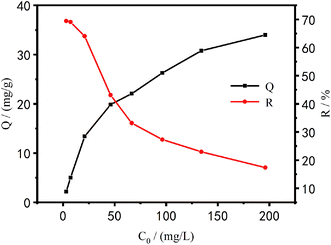
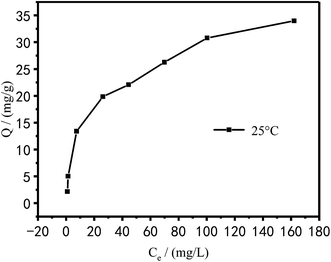
Effect of initial concentrations on the adsorption performance of Cu2+. Fig. 12 shows the relationship between the adsorption efficiency of PEI/KIT-6 on Cu2+ and various initial concentrations as well as the relationship between the amount of adsorption and various initial concentrations.
 |
| | Fig. 12 Effect of initial concentration on Cu2+ adsorption (reaction at 25 °C, pH = 6.0, initial concentration: 100 mg L−1). | |
It can be seen from Fig. 12 that with the increase of the initial concentration of Cu2+, the adsorption efficiency of PEI/KIT-6 on Cu2+ gradually decreased, and the adsorption capacity gradually increased, but the increase gradually reduced, and eventually the Cu2+ removal attained equilibrium. When the concentration of Cu2+ was small, the adsorption capacity of PEI/KIT-6 for Cu2+ did not reach saturation value, and many organic functional groups that do not fully react with Cu2+ can continue to coordinate with Cu2+. The adsorption performance of the mesoporous material PEI/KIT-6 has not been fully exerted so that the amount of adsorption was relatively low. However, with the increase of copper ion concentration, the adsorption performance of PEI/KIT-6 gradually appeared, and the adsorption capacity also increased. When the Cu2+ concentration was below 20 mg L−1, the removal rate of Cu2+ by PEI/KIT-6 can be as high as 70% or more; but when the initial concentration was 196.1 mg L−1, the removal efficiency was only 17.34%. This was because when the concentration of Cu2+ was high, more organic groups on PEI/KIT-6 are required to coordinate with them. However, the number of coordination sites in the solution was a constant, so the mesoporous material PEI/KIT-6 reaches the adsorption saturation value. As a result, the higher the initial concentration of Cu2+, the lower the removal efficiency of Cu2+ by PEI/KIT-6. Although the equilibrium adsorption amount was increasing, the increase gradually reduced, and it eventually attained equilibrium.
Cyclic adsorption performance
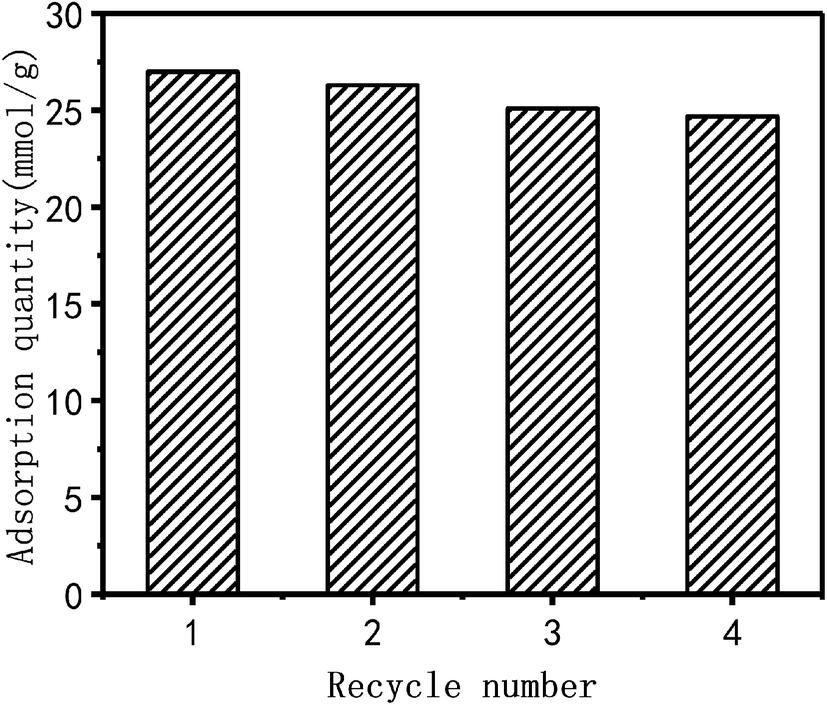
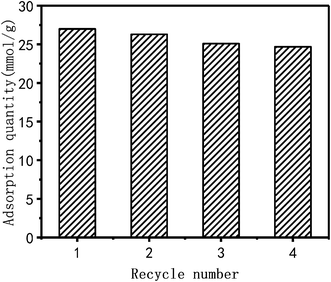
Cu2+ adsorbed by PEI/KIT-6 is desorbed by 0.1 mol L−1 hydrochloric acid at room temperature. The cycle adsorption experiment was carried out under the conditions of pH = 6, temperature of 25 °C and initial concentration of 100 mg L−1. PEI/KIT-6 was reused in three successive adsorption–desorption cycles. As shown in Fig. 13, the adsorption capacity of the PEI/KIT-6 after four cycles was 24.7 mmol g−1, indicating a loss in the adsorption capacity of only 8.5% compared to the initial adsorption capacity. These data indicate the good regeneration ability of the PEI/KIT-6 modified material.
 |
| | Fig. 13 The cyclic adsorption of PEI/KIT-6(reaction at 25 °C, pH = 6.0, initial concentration: 100 mg L−1). | |
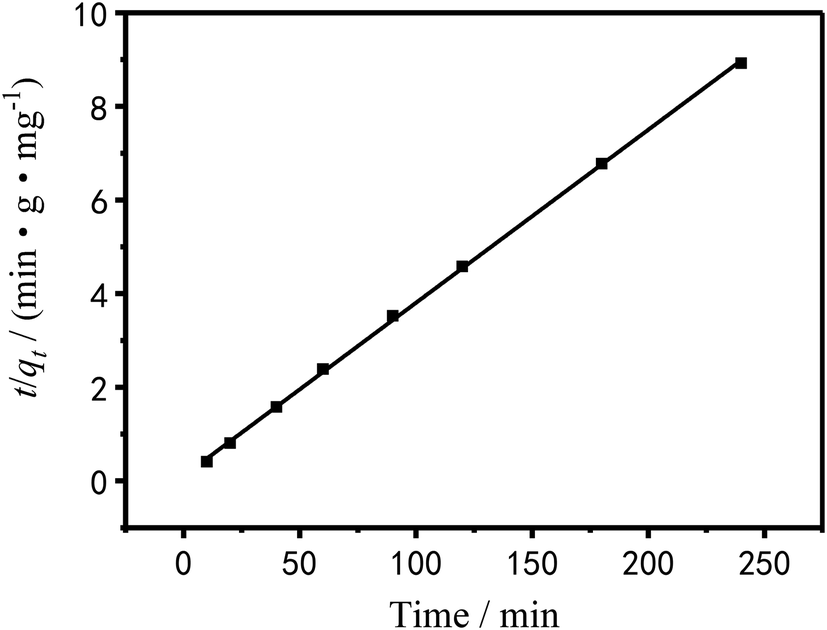
Adsorption kinetics
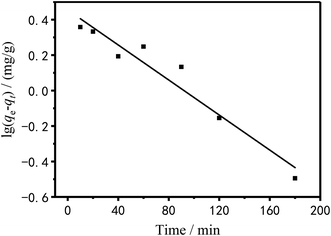
To investigate the adsorption mechanism, the raw data of Fig. 11 was fitted by pseudo-first and pseudo-secondary adsorption kinetic equations and the fitted results were showed in Fig. 14 and 15.
 |
| | Fig. 14 Pseudo-first-order dynamic model of Cu2+ linear fitting. | |
 |
| | Fig. 15 Pseudo-second-order dynamics model of Cu2+ linear fitting. | |
The pseudo-first-order dynamic model assumes that the adsorption rate is proportional to the number of coordination sites on the surface of the adsorbent material.48 It is as follow:
The pseudo-secondary dynamics model is as follow:
| |
 | (4) |
where
qt and
qe are the adsorption amount of Cu
2+ by PEI/KIT-6 at time
t and at adsorption saturation (mg g
−1), respectively;
k1 and
k2 are pseudo-primary rate constants (min
−1) and pseudo-secondary rate constants (g mg
−1 min
−1), respectively.
Table 4 shows the kinetic data and correlation coefficients obtained by the two kinetic models. It can be seen in Table 4 that the linear relationship obtained by the pseudo-first-order model analysis was not very good; therefore, the pseudo-first-order model was not sufficient to clarify the adsorption process of Cu2+ on PEI/KIT-6. The Qe,cal value analyzed by the pseudo-second-order model was quite close to the Qe,exp value obtained by the actual test, and the correlation coefficient was greater than 0.99, which indicates that the adsorption reaction of PEI/KIT-6 on Cu2+ was consistent with the reaction mechanism corresponding to the pseudo-second-order model. It is the chemical adsorption process that controls the speed of the adsorption reaction, which might involve the valence forces through the sharing or exchange of electrons between Cu2+ ions and adsorbents.47–49
Table 4 Kinetic parameters and correlation coefficients of Cu2+ adsorption rate curves
| Qe,exp (mg g−1) |
Adsorption pseudo-first-order dynamic model |
Adsorption pseudo-secondary dynamics model |
| Qe,cal (mg g−1) |
k1 |
R2 |
Qe,cal (mg g−1) |
k2 |
R2 |
| 26.9 |
2.8496 |
0.0113 |
0.92824 |
27.1 |
0.0124 |
0.99957 |
Adsorption isotherm
The adsorption isotherm of Cu2+ in Fig. 16 was plotted by the raw data in Fig. 12. As can be seen from Fig. 16, the adsorption capacity of PEI/KIT-6 for Cu2+ increased as the equilibrium concentration of Cu2+ increased.
 |
| | Fig. 16 Adsorption isotherms of Cu2+. | |
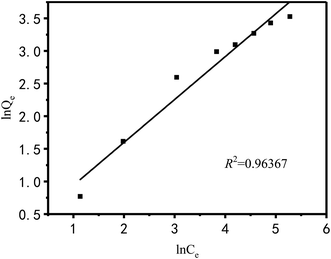
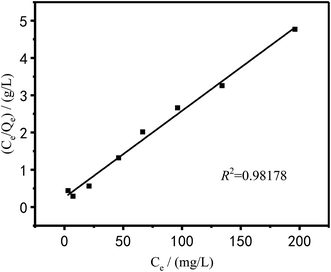
The Langmuir and Freundlich models were used to fit and analyze thermodynamic data to obtain Fig. 17 and 18. Langmuir type and Freundlich type linear fitting parameters are listed in Table 5. It can be seen in Fig. 17, 18 and Table 5 that the linear coefficients obtained by the two types of isothermal adsorption equations all exceed 0.95, which indicates that both adsorption models can be used to clarify the adsorption process of Cu2+ by PEI/KIT-6. However, the linear correlation of the Langmuir model was better than that of the Freundlich model, which indicates that the former was more suitable than the latter to describe the isothermal adsorption process. The adsorption tends to be a chemisorption of monolayer. As shown in Table 5, the theoretical maximum adsorption amount calculated according to the Langmuir adsorption model is 36.43 mg g−1 at 25 °C, which is close to the actual adsorption value of 34.00 mg g−1. The R2 of the Langmuir model exceeds 0.98, indicating that the model can describe the experiment well, thus the maximum theoretical calculation is reliable. As shown in Table 6, compared with other modified molecular sieve adsorbents, PEI/KIT-6 showed a good performance for Cu2+ removal. Moreover, the n value of Freundlich model was obtained in the range from 1 to 10, which indicates that the modified material PEI/KIT-6 was easy to adsorb Cu2+, and the model was similar to the actual test results.
 |
| | Fig. 17 Langmuir type linear fitting. | |
 |
| | Fig. 18 Freundlich type linear fitting. | |
Table 5 Langmuir type and Freundlich type linear fitting parameters of adsorption of Cu2+ on PEI/KIT-6
| |
Langmuir |
Freundlich |
| Qm (mg g−1) |
b |
R2 |
K |
n |
R2 |
| Cu2+ |
36.43 |
0.0549 |
0.9818 |
2.34 |
1.894 |
0.9637 |
Table 6 Adsorption of Cu2+ by different modified mesoporous materials
| Support |
Modifier |
pH |
Capacity (mg g−1) |
Reference |
| SBA-15 |
Triethylenetetramine |
4 |
23.90 |
50 |
| SBA-15 |
1,4,7-Triazacycclononane |
5 |
42.60 |
51 |
| PMMA |
PEI |
6–7 |
14.34 |
52 |
| SBA-15 |
(3-Aminopropyl)-trimethoxysilane |
4 |
19.20 |
53 |
| SBA-15 |
N-Propylsalicylaldimine |
4.8 |
57.20 |
54 |
| MCM-41 |
Sodium dodecyl sulfate |
5 |
9.51 |
55 |
| KIT-6 |
PEI |
6 |
36.43 |
This work |
Conclusions
PEI/KIT-6 was prepared by the two-step grafting method using (3-chloropropyl)trimethoxysilane and PEI as modifiers. The chemical, structural and textural properties of the PEI/KIT-6 were characterized by several methods. The grafting of PEI did not destroy the order of material structure. The loading of the amino groups on the surface of PEI/KIT-6 was 3.74 mmol g−1. The specific surface area, pore volume and pore diameter of PEI/KIT-6 were 246.90 m2 g−1, 0.60 cm3 g−1, 7.06 nm, respectively. The grafting of PEI did not block the channel of the material. Then, the application of PEI/KIT-6 for the adsorption of Cu2+ from an aqueous solution was examined. PEI/KIT-6 has good cycle adsorption performance. The PEI/KIT-6 dosage was 1 g L−1, the initial concentration was 100 mg L−1 Cu2+, the optimum pH was 6.0, the equilibrium adsorption time was 120 min, and the adsorption process was suited well by the pseudo second-order kinetics. The adsorption tends to takes place through chemisorption of monolayer. The Cu2+ adsorption capacity increases with the increase of temperature, and the optimum reaction temperature was 35 °C. Adsorption follows both Langmuir and Freundlich model, and the maximum theoretical adsorption capacity based on the Langmuir adsorption model was 36.43 mg g−1. The KIT-6 mesoporous material after PEI grafting has better adsorption performance than the KIT-6 without PEI grafting. In this work, only a single heavy metal Cu2+ in water adsorbed by PEI/KIT-6 was explored. Due to the complexity of pollutants in the real wastewater, mixed heavy metals removal study is expected to be carried out in the future.
Conflicts of interest
There are no conflicts to declare.
Acknowledgements
The authors sincerely acknowledge the support of National Natural Science Foundation of China (No. 51966002).
References
- K. R. Reddy, B. C. Sin, C. H. Yoo, W. J. Park, K. S. Ryu, J. S. Lee, D. W. Sohn and Y. I. Lee, Scr. Mater., 2008, 58, 1010–1013 CrossRef CAS.
- C. Venkata Reddy, I. N. Reddy, B. Akkinepally, K. R. Reddy and J. Shim, J. Alloys Compd., 2020, 814, 152349 CrossRef CAS.
- N. R. Reddy, U. Bhargav, M. M. Kumari, K. K. Cheralathan, M. V. Shankar, K. R. Reddy, T. A. Saleh and T. M. Aminabhavi, J. Environ. Manage., 2020, 254, 109747 CrossRef CAS PubMed.
- C. V. Reddy, I. N. Reddy, K. Ravindranadh, K. R. Reddy, N. P. Shetti, D. Kim, J. Shim and T. M. Aminabhavi, J. Environ. Manage., 2020, 260, 110088 CrossRef CAS PubMed.
- N. P. Shetti, S. D. Bukkitgar, K. R. Reddy, C. V. Reddy and T. M. Aminabhavi, Colloids Surf., B, 2019, 178, 385–394 CrossRef CAS PubMed.
- S. P. Dharupaneedi, S. K. Nataraj, M. Nadagouda, K. R. Reddy, S. S. Shukla and T. M. Aminabhavi, Sep. Purif. Technol., 2019, 210, 850–866 CrossRef CAS.
- N. P. Shetti, D. S. Nayak, S. J. Malode, R. R. Kakarla, S. S. Shukla and T. M. Aminabhavi, Anal. Chim. Acta, 2019, 1051, 58–72 CrossRef CAS PubMed.
- V. Navakoteswara Rao, N. Lakshmana Reddy, M. Mamatha Kumari, P. Ravi, M. Sathish, K. M. Kuruvilla, V. Preethi, K. R. Reddy, N. P. Shetti, T. M. Aminabhavi and M. V. Shankar, Appl. Catal., B, 2019, 254, 174–185 CrossRef CAS.
- P. S. Basavarajappa, B. N. H. Seethya, N. Ganganagappa, K. B. Eshwaraswamy and R. R. Kakarla, Chemistryselect, 2018, 3, 9025–9033 CrossRef CAS.
- C. V. Reddy, I. N. Reddy, V. V. N. Harish, K. R. Reddy, N. P. Shetti, J. Shim and T. M. Aminabhavi, Chemosphere, 2020, 239, 124766 CrossRef CAS PubMed.
- K. R. Reddy, K. Nakata, T. Ochiai, T. Murakami, D. A. Tryk and A. Fujishima, J. Nanosci. Nanotechnol., 2010, 10, 7951–7957 CrossRef CAS PubMed.
- S. B. Patil, P. S. Basavarajappa, N. Ganganagappa, M. S. Jyothi, A. V. Raghu and K. R. Reddy, Int. J. Hydrogen Energy, 2019, 44, 13022–13039 CrossRef CAS.
- P. S. Basavarajappa, S. B. Patil, N. Ganganagappa, K. R. Reddy, A. V. Raghu and C. V. Reddy, Int. J. Hydrogen Energy, 2020, 45, 7764–7778 CrossRef CAS.
- K. R. Reddy, V. G. Gomes and M. Hassan, Mater. Res. Express, 2014, 1, 015012 CrossRef.
- N. P. Shetti, S. J. Malode, D. S. Nayak, G. B. Bagihalli, S. S. Kalanur, R. S. Malladi, C. V. Reddy, T. M. Aminabhavi and K. R. Reddy, Appl. Surf. Sci., 2019, 496, 143656 CrossRef CAS.
- C. V. Reddy, I. N. Reddy, K. R. Reddy, S. Jaesool and K. Yoo, Electrochim. Acta, 2019, 317, 416–426 CrossRef CAS.
- R. Koutavarapu, B. Babu, C. V. Reddy, I. N. Reddy, K. R. Reddy, M. C. Rao, T. M. Aminabhavi, M. Cho, D. Kim and J. Shim, J. Environ. Manage., 2020, 265, 110504 CrossRef CAS PubMed.
- E. Haque, J. Kim, V. Malgras, K. R. Reddy, A. C. Ward, J. You, Y. Bando, M. S. A. Hossain and Y. Yamauchi, Small Methods, 2018, 2, 1800050 CrossRef.
- T. Tavangar, M. Karimi, M. Rezakazemi, K. R. Reddy and T. M. Aminabhavi, Chem. Eng. J., 2020, 385, 123787 CrossRef.
- B. Southichak, K. Nakano, M. Nomura, N. Chiba and O. Nishimura, Water Res., 2006, 40, 2295–2302 CrossRef CAS PubMed.
- S. A. Ali, O. C. S. A. Hamouz and N. M. Hassan, J. Hazard. Mater., 2013, 248–249, 47–58 CrossRef CAS PubMed.
- V. K. Gupta, P. I. Ali, Encyclopedia of Surface and Colloid Science, 2002, vol. 01, pp. 149–184 Search PubMed.
- C. Covarrubias, R. García, J. Yánez and R. Arriagada, J. Porous Mater., 2008, 15, 491–498 CrossRef CAS.
- C. Hung, H. Bai and M. Karthik, Sep. Purif. Technol., 2009, 64, 265–272 CrossRef CAS.
- S. Dadfarnia, A. M. H. Shabani, S. E. Moradi and S. Emami, Appl. Surf. Sci., 2015, 330, 85–93 CrossRef CAS.
- D. Mohan and C. U. P. Jr, J. Hazard. Mater., 2006, 137, 762–811 CrossRef CAS PubMed.
- L. Bois, A. Bonhommé, A. Ribes, B. Pais, G. Raffin and F. Tessier, Colloids Surf., A, 2003, 221, 221–230 CrossRef CAS.
- K. F. Lam, X. Chen, C. M. Fong and K. L. Yeung, Chem. Commun., 2008, 112, 2034–2036 RSC.
- Z. Wu, P. A. Webley and D. Zhao, Langmuir, 2010, 26, 10277 CrossRef CAS PubMed.
- N. Bensacia, I. Fechete, S. Moulay, O. Hulea, A. Boos and F. Garin, C. R. Chim., 2014, 17, 869–880 CrossRef CAS.
- R. Kishor and A. K. Ghoshal, Chem. Eng. J., 2015, 262, 882–890 CrossRef CAS.
- J. Wang, Y. Li, Z. Zhang and Z. Hao, Mesoporous KIT-6 Silica—Polydimethylsiloxane (PDMS) Mixed Matrix Membranes for Gas Separation, 2015 Search PubMed.
- K. Soni, B. S. Rana, A. K. Sinha, A. Bhaumik, M. Nandi, M. Kumar and G. M. Dhar, Appl. Catal. B Environ., 2009, 90, 55–63 CrossRef CAS.
- M. Dinari, G. Mohammadnezhad and R. Soltani, RSC Adv., 2016, 6, 11419–11429 RSC.
- F. Kleitz, S. H. Choi and R. Ryoo, Chem. Commun., 2003, 9, 2136–2137 RSC.
- L. Qian, K. Huang, H. Wang, M. C. Kung, H. H. Kung, J. Li, G. Chen and Q. Du, Microporous Mesoporous Mater., 2017, 243, 301–310 CrossRef CAS.
- A. Prabhu, L. Kumaresan, M. Palanichamy and V. Murugesan, Appl. Catal., A, 2009, 360, 59–65 CrossRef CAS.
- W. Wang, X. Yang, Y. Fang and J. Ding, Appl. Energy, 2009, 86, 170–174 CrossRef CAS.
- W. Wang, J. Xiao, X. Wei, J. Ding, X. Wang and C. Song, Appl. Energy, 2014, 113, 334–341 CrossRef CAS.
- M. R. Mello, D. Phanon, G. Q. Silveira, P. L. Llewellyn and C. M. Ronconi, Microporous Mesoporous Mater., 2011, 143, 174–179 CrossRef CAS.
- Y. Jiang, Q. Gao, H. Yu, Y. Chen and F. Deng, Microporous Mesoporous Mater., 2007, 103, 316–324 CrossRef CAS.
- D. Zhang, A. Duan, Z. Zhao and C. Xu, J. Catal., 2010, 274, 273–286 CrossRef CAS.
- S. M. Solberg, A. Dharmesh Kumar and C. C. Landry, J. Phys. Chem. B, 2005, 109, 24331–24337 CrossRef CAS PubMed.
- Y. Xia and R. Mokaya, J. Mater. Chem., 2004, 14, 863–870 RSC.
- B. Singh and V. Polshettiwar, J. Mater. Chem. A, 2016, 4, 7071 RSC.
- T. A. Saleh, Desalin. Water Treat., 2015, 57, 1–15 Search PubMed.
- Q. Yuan, C. Yue, N. Yu, Y. Zhao, W. Yan, X. Li and B. Dong, Mater. Res. Bull., 2014, 49, 279–284 CrossRef CAS.
- V. K. Gupta, M. Gupta and S. Sharma, Water Res., 2001, 35, 1125–1134 CrossRef CAS PubMed.
- S. Wang, K. Wang, C. Dai, H. Shi and J. Li, Chem. Eng. J., 2015, 262, 897–903 CrossRef CAS.
- J. I. Lachowicz, G. R. Depiano, D. Zanda, M. Piludu, E. Sanjust, M. Monduzzi and A. Salis, J. Environ. Chem. Eng., 2019, 7, 103205 CrossRef CAS.
- P. K. Tapaswi, M. S. Moorthy, S. S. Park and C.-S. Ha, J. Solid State Chem., 2014, 211, 191–199 CrossRef CAS.
- P. E. Duru, S. Bektas, m. Gen, S. Patir and A. Denizli, J. Appl. Polym. Sci., 2001, 81, 197–205 CrossRef CAS.
- A. Shahbazi, H. Younesi and A. Badiei, Chem. Eng. J., 2011, 168, 505–518 CrossRef CAS.
- M. Mureseanu, A. Reiss, I. Stefanescu, E. David, V. Parvulescu, G. Renard and V. Hulea, Chemosphere, 2008, 73, 1499–1504 CrossRef CAS PubMed.
- W. Kaewprachum, S. Wongsakulphasatch, W. Kiatkittipong, A. Striolo, C. K. Cheng and S. Assabumrungrat, J. Environ. Chem. Eng., 2020, 8, 102920 CrossRef CAS.
|
| This journal is © The Royal Society of Chemistry 2020 |
Click here to see how this site uses Cookies. View our privacy policy here. 
 Open Access Article
 This Open Access Article is licensed under a Creative Commons Attribution-Non Commercial 3.0 Unported Licence
 *,
Siqi Chen,
Yu Li,
Zeyu He,
Linlin Geng* and
Lei Liao*
*,
Siqi Chen,
Yu Li,
Zeyu He,
Linlin Geng* and
Lei Liao*