 Open Access Article
Mechanistic insights into the acetate-accelerated synthesis of crystalline ceria nanoparticles†
Tamra J. Fisher‡
 a,
Deepa Choudhry‡
 a,
Kaitlynn Derrb,
Soodabeh Azadehranjbarc,
Dan Staskob and
Chin Li Cheung
 *a
*a
aDepartment of Chemistry, University of Nebraska-Lincoln, Lincoln, NE 68588, USA. E-mail: ccheung2@unl.edu
bDepartment of Chemistry, Missouri Western State University, St. Joseph, MO 64507, USA
cDepartment of Mechanical and Materials Engineering, University of Nebraska-Lincoln, Lincoln, NE 68588, USA
First published on 29th May 2020
Abstract
Recent increasing uses of ceria in research and industrial applications have fostered continuing developments of efficient routes to synthesize the material. Here we report our investigation of the effects and the mechanistic roles of lithium acetate to accelerate the growth of crystalline ceria nanoparticles in ozone-mediated synthesis. By increasing the mole ratio of the acetate to cerium nitrate in the reactions, the reaction yields of ceria nanoparticles were observed to increase from ca. 10% to up to over 90% by cerium content in 30 min reactions. Microscopy images and Raman spectra of the as-synthesized nanoparticles revealed that increasing the acetate additions led to a decrease in average particle size and size range but an increase in crystallinity. Through analyzing the organic by-products in the reaction mixtures, the acetate was inferred to base-catalyze the formation of acetals and cerium complexes and accelerate the formation of Ce–O–Ce bonds and hence the growth of ceria nanoparticles through alcohol-like condensation reactions.
1. Introduction
Fluorite-structured cerium oxide (ceria, CeO2−x) is a versatile metal oxide with widespread applications ranging across chemical catalysis,1,2 oxygen sensing,3 solid oxide electrolytes for fuel cells,4 UV blockers,5 resistive-switching memory devices,6 chemical mechanical polishing,7 and biomedical antioxidants.8 The wide range of applications for these materials stems from their intrinsic oxygen vacancy defects (OVDs) and reversible redox cycling of Ce3+ and Ce4+.9,10 These characteristics coupled with the large surface area of nanosized structures have improved upon the catalytic efficiency of ceria, widening its application interests to organic chemical synthesis.11 This wide range of applications has accentuated the need for efficient synthetic routes for ceria nanoparticles. The traditional synthetic routes of sol–gel synthesis, solvothermal synthesis, hydrothermal synthesis, chemical precipitation, and flame spray pyrolysis have been used extensively to produce ceria nanoparticles of various crystallinity, shapes, and particle size distributions.12,13 In general, these techniques require either long reaction times, elevated temperatures, and/or high pressures. Some reported methods employ metal alkoxides and caustic alkalis which necessitate the need for more cost-efficient and safer synthetic procedures. Recently, we reported an ozone-mediated methodology to synthesize ceria nanoparticles (ceria NPs) in ethanol.14 The growth mechanism of NPs was hypothesized to be initialized by the oxidation of ethanol with ozone to produce acetic acid and acetate. These species were postulated to form complexes with cerium ions which then yield NPs.15,16 Though this methodology started to produce NPs within the first 15 s of the reaction and it was comparatively facile over many other synthetic routes, its atypical reaction yield in 30 min was only ca. 10% by cerium content and the total yield only slightly increased even after several hours of continued reaction.Herein we report our study of applying acetate additions to accelerate the ozone-mediated synthesis of ceria NPs in ethanol. By increasing the ratio of lithium acetate to cerium nitrate in the reaction, we successfully increased the reaction yields of ceria NPs in 30 min-reactions by eight folds, from ca. 10% to over 90% by cerium content. Moreover, through electron microscopy, electron diffraction, and Raman spectroscopy, both the crystallinity and the size distribution of as-synthesized NPs were shown to correlate with the additions of acetate in the reaction. Lastly, our identifications of major organic side-products in the reaction mixture further revealed the mechanistic roles of acetates in catalyzing the reactions to form Ce–O–Ce bonds and hence accelerating the growth of ceria NPs.
2. Experimental
2.1 General procedure for the syntheses of ceria nanoparticles
Fluorite-structured Ceria NPs were synthesized by bubbling ozone into ethanol solutions containing different mole ratios of cerium nitrate and lithium acetate. The additions of lithium acetate were found to greatly improve the reaction yields of our previously reported ozone-mediated synthetic method.14 Briefly, a reactant solution was first prepared by dissolving cerium nitrate hexahydrate Ce(NO3)3·6H2O (99.99% REO, Alfa Aesar, Tewksbury, MA) in ethanol with lithium acetate dihydrate. (LiOAc·2H2O 98%, Sigma-Aldrich, Milwaukee, WI) of various mole ratios with respect to Ce(NO3)3·6H2O (hereafter referred as reactants ratio (LiOAc : Ce(NO3)3) = 0![[thin space (1/6-em)]](https://www.rsc.org/images/entities/char_2009.gif) :
:![[thin space (1/6-em)]](https://www.rsc.org/images/entities/char_2009.gif) 1, 1
1, 1![[thin space (1/6-em)]](https://www.rsc.org/images/entities/char_2009.gif) :
:![[thin space (1/6-em)]](https://www.rsc.org/images/entities/char_2009.gif) 1, 2
1, 2![[thin space (1/6-em)]](https://www.rsc.org/images/entities/char_2009.gif) :
:![[thin space (1/6-em)]](https://www.rsc.org/images/entities/char_2009.gif) 1, 3
1, 3![[thin space (1/6-em)]](https://www.rsc.org/images/entities/char_2009.gif) :
:![[thin space (1/6-em)]](https://www.rsc.org/images/entities/char_2009.gif) 1, 4
1, 4![[thin space (1/6-em)]](https://www.rsc.org/images/entities/char_2009.gif) :
:![[thin space (1/6-em)]](https://www.rsc.org/images/entities/char_2009.gif) 1, and 5
1, and 5![[thin space (1/6-em)]](https://www.rsc.org/images/entities/char_2009.gif) :
:![[thin space (1/6-em)]](https://www.rsc.org/images/entities/char_2009.gif) 1). A gas mixture of ozone and oxygen (ultra-dry high purity grade, Matheson Trigas, Lincoln, NE) was bubbled through the solutions for 30 min to yield ceria nanoparticle products. For example, for the preparation with a 1
1). A gas mixture of ozone and oxygen (ultra-dry high purity grade, Matheson Trigas, Lincoln, NE) was bubbled through the solutions for 30 min to yield ceria nanoparticle products. For example, for the preparation with a 1![[thin space (1/6-em)]](https://www.rsc.org/images/entities/char_2009.gif) :
:![[thin space (1/6-em)]](https://www.rsc.org/images/entities/char_2009.gif) 1 mole ratio of LiOAc to Ce(NO3)3, 0.5 g of Ce(NO3)3·6H2O (1.15 mmol), and 0.117 g of LiOAc·2H2O were dissolved in 20 mL of 200 proof ethanol (Decon Laboratories, Montgomery, PA). The colorless salt solution was bubbled with a stream of ozone (0.5 g h−1) generated by passing 200 SCCM of extra dry oxygen (99.6%, Matheson Tri-Gas, Lincoln, NE) through an ozone generator (MP-3000, A2Z Ozone, Louisville, KY) for 30 min. The resulting suspension with orange-red precipitates was centrifuged at 4500 RPM for 20 min. The precipitate was re-suspended in 20 mL of 200 proof ethanol and re-centrifuged. This was repeated in 20 mL Nanopure water (18 MΩ m water from the Synergy® water purification system, VWR, Randor, PA) and recentrifuged again. The resulting orange-red pellet product was dried under vacuum for five hours and air-dried overnight.
1 mole ratio of LiOAc to Ce(NO3)3, 0.5 g of Ce(NO3)3·6H2O (1.15 mmol), and 0.117 g of LiOAc·2H2O were dissolved in 20 mL of 200 proof ethanol (Decon Laboratories, Montgomery, PA). The colorless salt solution was bubbled with a stream of ozone (0.5 g h−1) generated by passing 200 SCCM of extra dry oxygen (99.6%, Matheson Tri-Gas, Lincoln, NE) through an ozone generator (MP-3000, A2Z Ozone, Louisville, KY) for 30 min. The resulting suspension with orange-red precipitates was centrifuged at 4500 RPM for 20 min. The precipitate was re-suspended in 20 mL of 200 proof ethanol and re-centrifuged. This was repeated in 20 mL Nanopure water (18 MΩ m water from the Synergy® water purification system, VWR, Randor, PA) and recentrifuged again. The resulting orange-red pellet product was dried under vacuum for five hours and air-dried overnight.
2.2 Characterization of ceria nanoparticles
The morphology, crystal structure, and size distributions of the as-synthesized NPs with reactant ratios (LiOAc![[thin space (1/6-em)]](https://www.rsc.org/images/entities/char_2009.gif) :
:![[thin space (1/6-em)]](https://www.rsc.org/images/entities/char_2009.gif) Ce(NO3)3) of 0
Ce(NO3)3) of 0![[thin space (1/6-em)]](https://www.rsc.org/images/entities/char_2009.gif) :
:![[thin space (1/6-em)]](https://www.rsc.org/images/entities/char_2009.gif) 1, 1
1, 1![[thin space (1/6-em)]](https://www.rsc.org/images/entities/char_2009.gif) :
:![[thin space (1/6-em)]](https://www.rsc.org/images/entities/char_2009.gif) 1, 2
1, 2![[thin space (1/6-em)]](https://www.rsc.org/images/entities/char_2009.gif) :
:![[thin space (1/6-em)]](https://www.rsc.org/images/entities/char_2009.gif) 1, 3
1, 3![[thin space (1/6-em)]](https://www.rsc.org/images/entities/char_2009.gif) :
:![[thin space (1/6-em)]](https://www.rsc.org/images/entities/char_2009.gif) 1, 4
1, 4![[thin space (1/6-em)]](https://www.rsc.org/images/entities/char_2009.gif) :
:![[thin space (1/6-em)]](https://www.rsc.org/images/entities/char_2009.gif) 1, and 5
1, and 5![[thin space (1/6-em)]](https://www.rsc.org/images/entities/char_2009.gif) :
:![[thin space (1/6-em)]](https://www.rsc.org/images/entities/char_2009.gif) 1 were studied by high-resolution transmission electron microscopy (HRTEM) and selected area electron diffraction (SAED) using an FEI Tecnai Osiris S/TEM (Thermo Fisher Scientific Inc., Hillsboro, OR) operated at 200 kV. The average particle sizes were established based on statistics of 150 crystallites measured from the TEM images using ImageJ.17 The SAED patterns were indexed using ICDD card #00-004-0593 for fluorite-structured CeO2. A DXR Raman microscope (Thermo Fisher Scientific Inc., Madison, WI) equipped with a 564 nm laser was applied to identify the vibration modes of samples.
1 were studied by high-resolution transmission electron microscopy (HRTEM) and selected area electron diffraction (SAED) using an FEI Tecnai Osiris S/TEM (Thermo Fisher Scientific Inc., Hillsboro, OR) operated at 200 kV. The average particle sizes were established based on statistics of 150 crystallites measured from the TEM images using ImageJ.17 The SAED patterns were indexed using ICDD card #00-004-0593 for fluorite-structured CeO2. A DXR Raman microscope (Thermo Fisher Scientific Inc., Madison, WI) equipped with a 564 nm laser was applied to identify the vibration modes of samples.
The elemental compositions of the NPs were identified by energy-dispersive X-ray spectroscopy (EDX) on the FEI Tecnai Osiris S/TEM and trace analysis was conducted using inductively coupled mass spectrometry (ICP-MS). The concentration of cerium and lithium in the as-synthesized NPs samples were determined by ICP-MS (Bruker Aurora M90, Bruker Scientific LLC, Billerica, MA). For each sample, 25 mg were digested in 10 mL of concentrated hydrochloric acid (ACS grade, Sigma-Aldrich, St. Louis, MO) at 180 °C for 5 min. The resulting solutions were diluted from 4X to 1000X with Nanopure water for analysis. Thermogravimetric analysis coupled to Fourier transform infrared spectroscopy (TGA-FTIR, Nicolet iS50 FT-IR spectrometer (Thermo Fisher Scientific Inc., Madison, WI) with TGA 55 thermogravimetric analyzers (TA Instruments, New Castle, DE)) was also performed for the qualitative determination of sample content.
The identification of organic by-products formed during the growth of ceria nanoparticles was accomplished by 1H-NMR performed on a Bruker Avance III-HD 400 MHz nuclear magnetic resonance (NMR) spectrometer (Bruker BioSpin Corporation, Billerica, MA). Samples were prepared by ozonating the ethanolic solutions containing lithium acetate dehydrate and cerium nitrate hexahydrate in the ratio of 4![[thin space (1/6-em)]](https://www.rsc.org/images/entities/char_2009.gif) :
:![[thin space (1/6-em)]](https://www.rsc.org/images/entities/char_2009.gif) 1. Aliquots were collected at 30 min and diluted in CDCl3 (Sigma-Aldrich, Milwaukee, WI) for the 1H-NMR analysis.
1. Aliquots were collected at 30 min and diluted in CDCl3 (Sigma-Aldrich, Milwaukee, WI) for the 1H-NMR analysis.
3. Results and discussion
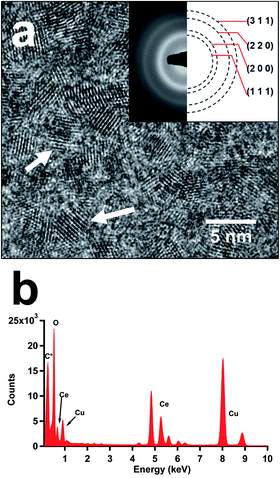
Our modified synthetic methodology with acetate additions produced crystalline ceria nanoparticles (NPs) with average sizes of 1.8 to 2.3 nm. HRTEM imaging illustrated the crystal structure of all as-synthesized samples as fluorite-structured ceria NPs (Fig. 1a and ESI Fig. S1†). The displayed diffraction rings of corresponding SAED patterns were determined to match the (111), (200), (220), and (311) lattice planes of the cubic (Fm![[3 with combining macron]](https://www.rsc.org/images/entities/char_0033_0304.gif) m) phase ceria (Insets in Fig. 1a and ESI Fig. S1†). The EDS analysis of these samples confirmed the presence of cerium and oxygen in all studied samples (Fig. 1b). Though lithium acetate was used in the syntheses, the incorporation of lithium in the as-produced samples was minimal as it was determined to be below 1 at% (on trace metal basis) by ICP-MS. Interestingly, the particle size distributions of ceria NPs particles illustrated shifting of the average particle size and size range correlated to the additions of acetate in their syntheses (Fig. 2). As the LiOAc
m) phase ceria (Insets in Fig. 1a and ESI Fig. S1†). The EDS analysis of these samples confirmed the presence of cerium and oxygen in all studied samples (Fig. 1b). Though lithium acetate was used in the syntheses, the incorporation of lithium in the as-produced samples was minimal as it was determined to be below 1 at% (on trace metal basis) by ICP-MS. Interestingly, the particle size distributions of ceria NPs particles illustrated shifting of the average particle size and size range correlated to the additions of acetate in their syntheses (Fig. 2). As the LiOAc![[thin space (1/6-em)]](https://www.rsc.org/images/entities/char_2009.gif) :
:![[thin space (1/6-em)]](https://www.rsc.org/images/entities/char_2009.gif) Ce(NO3)3 reactants ratio increased from 0
Ce(NO3)3 reactants ratio increased from 0![[thin space (1/6-em)]](https://www.rsc.org/images/entities/char_2009.gif) :
:![[thin space (1/6-em)]](https://www.rsc.org/images/entities/char_2009.gif) 1 to 5
1 to 5![[thin space (1/6-em)]](https://www.rsc.org/images/entities/char_2009.gif) :
:![[thin space (1/6-em)]](https://www.rsc.org/images/entities/char_2009.gif) 1, the average particle size of the corresponding ceria nanoparticles gradually decreased from 2.3 nm to 1.8 nm. Additionally, the size range decreased from approximately 4 nm to 2 nm with increased acetate additions. These observations could both be attributed to the increased availability of carboxylates from acetates near or on the ceria crystallites. The carboxylate functional groups could bind to the surface of ceria crystallites and thereby limiting their growth and decreasing the diffusion rate of cerium ions between growing ceria nanocrystals. This postulation of surface modification effect was corroborated by a similar discussion by Slostowski et al. for their syntheses of ceria nanocrystals in supercritical aliphatic alcohols.18
1, the average particle size of the corresponding ceria nanoparticles gradually decreased from 2.3 nm to 1.8 nm. Additionally, the size range decreased from approximately 4 nm to 2 nm with increased acetate additions. These observations could both be attributed to the increased availability of carboxylates from acetates near or on the ceria crystallites. The carboxylate functional groups could bind to the surface of ceria crystallites and thereby limiting their growth and decreasing the diffusion rate of cerium ions between growing ceria nanocrystals. This postulation of surface modification effect was corroborated by a similar discussion by Slostowski et al. for their syntheses of ceria nanocrystals in supercritical aliphatic alcohols.18
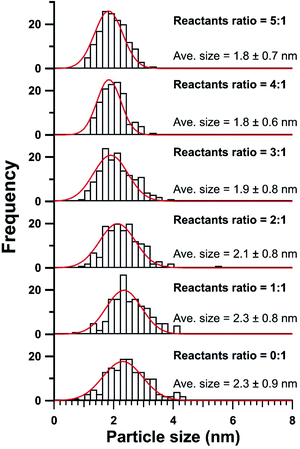 | ||
Fig. 2 Particle size distributions of ceria NPs produced using LiOAc and Ce(NO3)3 with reactants ratios of 0.1, 1![[thin space (1/6-em)]](https://www.rsc.org/images/entities/char_2009.gif) : :![[thin space (1/6-em)]](https://www.rsc.org/images/entities/char_2009.gif) 1, 2 1, 2![[thin space (1/6-em)]](https://www.rsc.org/images/entities/char_2009.gif) : :![[thin space (1/6-em)]](https://www.rsc.org/images/entities/char_2009.gif) 1, 3 1, 3![[thin space (1/6-em)]](https://www.rsc.org/images/entities/char_2009.gif) : :![[thin space (1/6-em)]](https://www.rsc.org/images/entities/char_2009.gif) 1, 4 1, 4![[thin space (1/6-em)]](https://www.rsc.org/images/entities/char_2009.gif) : :![[thin space (1/6-em)]](https://www.rsc.org/images/entities/char_2009.gif) 1, and 5 1, and 5![[thin space (1/6-em)]](https://www.rsc.org/images/entities/char_2009.gif) : :![[thin space (1/6-em)]](https://www.rsc.org/images/entities/char_2009.gif) 1. 1. | ||
The reaction yields of ceria NPs made with lithium acetates were found to be up to 8 times higher than those of our standard ozone-mediated method reported by Bhalkikar et al.14 Our TGA-IR analysis revealed that the as-synthesized samples also contained water and residual organics. As the NP samples were heated to 600 °C, their weights decreased by about 20% with the evolution of water vapor, carbon dioxide, and organic vapor (Fig. 3 and ESI Fig. S2†). Note that acetic acid vapor was identified when the sample was heated at approximately 250 °C, which was close to the normal boiling point of acetic acid (245.5 °C) (Fig. 3b). These remnants were regarded as artifacts of the ambient drying process used in this study to avoid sample sintering. Due to these left-over water and organic content, mass quantification of product yields was found insufficient for this study. Accordingly, ICP-MS was used to measure and compare the cerium content in the ceria NPs to the theoretical one as the product-yield indicator. The ICP-MS results revealed drastically improved synthetic efficiency from the 0![[thin space (1/6-em)]](https://www.rsc.org/images/entities/char_2009.gif) :
:![[thin space (1/6-em)]](https://www.rsc.org/images/entities/char_2009.gif) 1 reactants ratio ceria NP sample (11.6%; synthesis with no acetate additions) to the 3
1 reactants ratio ceria NP sample (11.6%; synthesis with no acetate additions) to the 3![[thin space (1/6-em)]](https://www.rsc.org/images/entities/char_2009.gif) :
:![[thin space (1/6-em)]](https://www.rsc.org/images/entities/char_2009.gif) 1 reactants ratio sample (84.9%), with less than 6% increase for the 4
1 reactants ratio sample (84.9%), with less than 6% increase for the 4![[thin space (1/6-em)]](https://www.rsc.org/images/entities/char_2009.gif) :
:![[thin space (1/6-em)]](https://www.rsc.org/images/entities/char_2009.gif) 1 reactants ratio (85.7%) and 5
1 reactants ratio (85.7%) and 5![[thin space (1/6-em)]](https://www.rsc.org/images/entities/char_2009.gif) :
:![[thin space (1/6-em)]](https://www.rsc.org/images/entities/char_2009.gif) 1 reactants ratio (90.1%) samples (Fig. 4).
1 reactants ratio (90.1%) samples (Fig. 4).
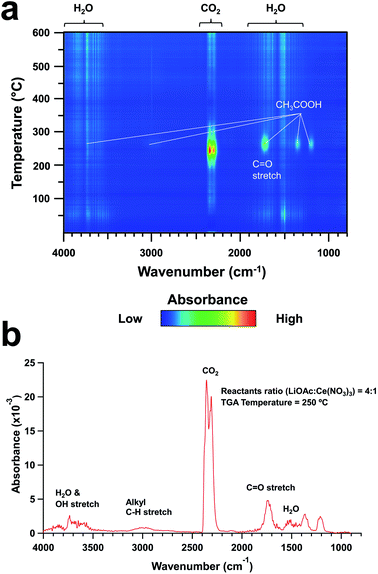 | ||
Fig. 3 TGA-FTIR results for the 4![[thin space (1/6-em)]](https://www.rsc.org/images/entities/char_2009.gif) : :![[thin space (1/6-em)]](https://www.rsc.org/images/entities/char_2009.gif) 1 reactants ratio ceria nanoparticle sample. (a) 2D-plot of FT-IR spectra as a function of sample temperature. (b) FTIR spectrum at 250 °C. 1 reactants ratio ceria nanoparticle sample. (a) 2D-plot of FT-IR spectra as a function of sample temperature. (b) FTIR spectrum at 250 °C. | ||
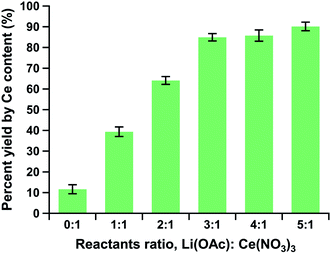 | ||
| Fig. 4 Percentage reaction yields of the ceria NP products by Ce content as a function of reactants ratio. | ||
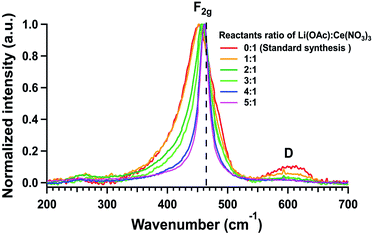
The structural identities of the as-synthesized samples were further confirmed by Raman spectroscopy. All Raman spectra of the samples illustrated the characteristic F2g peaks of fluorite-structured ceria in the region of 450–461 cm−1 (Fig. 5). The red-shift in the F2g peaks, when compared to that of pure ceria nanoparticles at 464 cm−1, was shown to be positively correlated to the degree of disorder and the density of oxygen vacancy defects in fluorite-structured ceria materials.19 This red-shift was observed to decrease with increasing reactants ratio, approaching that of pure ceria. This suggested an increase in crystallinity of the ceria NPs corresponding to the extent of acetate additions. This trend also corroborated well with observed changes in the intensity and width of the defect (D) peak near 590 cm−1. The studied samples displayed a decrease in the D peak intensity with decreasing red-shift but increasing the narrowing of the F2g peak. These overall observations revealed a decrease in the defect density and an increase in crystallinity in the as-synthesized ceria samples with increasing additions of acetate in the syntheses.
To elucidate the roles of acetate in the growth of ceria NPs, we identified major organic by-products in the reactants ratio of 0![[thin space (1/6-em)]](https://www.rsc.org/images/entities/char_2009.gif) :
:![[thin space (1/6-em)]](https://www.rsc.org/images/entities/char_2009.gif) 1 and 4
1 and 4![[thin space (1/6-em)]](https://www.rsc.org/images/entities/char_2009.gif) :
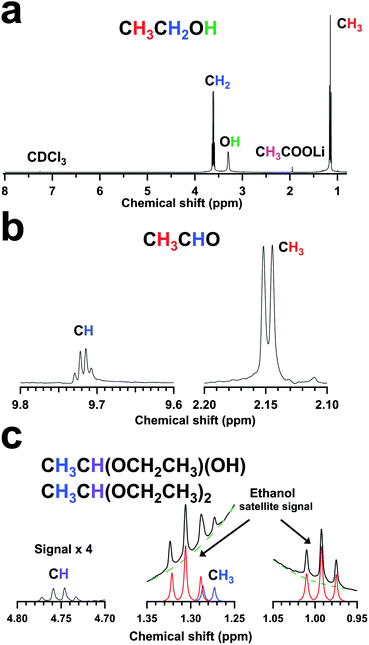
:![[thin space (1/6-em)]](https://www.rsc.org/images/entities/char_2009.gif) 1 samples by NMR (Fig. 6). The NMR spectra of both samples prominently showed the presence of the ethanol (CH3CH2OH) represented by the triplet at 1.15 ppm for the methyl group (CH3), the quartet at 3.61 ppm for the methylene group (CH2), and the singlet at 2.75 ppm for the hydroxyl group (OH) (Fig. 6a). The observed downshifts of this singlet (2.75 ppm) from the typically reported location for ethanol (1.32 ppm) were attributed to the complexation of the hydroxyl oxygen with metal ions.20 The increasing downshift of these singlets in the samples with lithium acetates suggested an increased extent of ethanol-cerium coordination complexes with acetate addition.21 The presence of lithium-bound acetate (CH3COOLi) from lithium acetate was also inferred from the singlet representing the corresponding methyl group (CH3) at 1.95 ppm (Fig. 6a).
1 samples by NMR (Fig. 6). The NMR spectra of both samples prominently showed the presence of the ethanol (CH3CH2OH) represented by the triplet at 1.15 ppm for the methyl group (CH3), the quartet at 3.61 ppm for the methylene group (CH2), and the singlet at 2.75 ppm for the hydroxyl group (OH) (Fig. 6a). The observed downshifts of this singlet (2.75 ppm) from the typically reported location for ethanol (1.32 ppm) were attributed to the complexation of the hydroxyl oxygen with metal ions.20 The increasing downshift of these singlets in the samples with lithium acetates suggested an increased extent of ethanol-cerium coordination complexes with acetate addition.21 The presence of lithium-bound acetate (CH3COOLi) from lithium acetate was also inferred from the singlet representing the corresponding methyl group (CH3) at 1.95 ppm (Fig. 6a).
The NMR spectra also revealed the presence of acetaldehyde, 1-ethoxyethan-1-ol, and 1,1-diethoxyethane (Fig. 6b and c). Acetaldehyde (CH3CHO) was indicated by the doublet at 2.15 ppm for the methyl group (CH3) and the corresponding quartet at 9.72 ppm for the aldehyde group (CHO) (Fig. 6b). 1-Ethoxyethan-1-ol (CH3CH(OCH2CH3)(OH)) and 1,1-diethoxyethane (CH3CH(OCH2CH3)2) were identified by the doublet at 1.28 ppm for the methyl group (CH3) and the characteristic quartet at 4.75 ppm for the methanetriyl group (CH) (Fig. 6c). The doublet overlaps with the downfield triplet satellite signal of ethanol in Fig. 6c and these peaks corresponding to the protons of the ethoxy groups were postulated to be “hidden” with those of the ethanol. Owing to these “hidden” peaks, it was not possible to differentiate between 1,1-diethoxyethane and 1-ethoxyethan-1-ol in the reaction mixture. However, an increased presence of these by-products indicated the involvement of both chemical species in the synthesis of ceria NPs. Ethyl acetate was also observed among the side-products in standard synthesis (reactants ratio 0![[thin space (1/6-em)]](https://www.rsc.org/images/entities/char_2009.gif) :
:![[thin space (1/6-em)]](https://www.rsc.org/images/entities/char_2009.gif) 1), but it only showed up as a minor product (estimated to be <0.1% by 1H-NMR peak integration) in the reaction mixture with larger reactants ratios. The minor quantity of ethyl acetate formed was likely due to the competitive formation of other by-products such as acetaldehyde, 1-ethoxyethan-1-ol, and 1,1-diethoxyethane.22,23
1), but it only showed up as a minor product (estimated to be <0.1% by 1H-NMR peak integration) in the reaction mixture with larger reactants ratios. The minor quantity of ethyl acetate formed was likely due to the competitive formation of other by-products such as acetaldehyde, 1-ethoxyethan-1-ol, and 1,1-diethoxyethane.22,23
According to the NMR studies and our observed drastic increase in reaction yield of ceria NPs in the ozone-mediate synthesis with acetate additions, we proposed the following reaction mechanism mediated by both ozone and the acetate in the CeOx NP synthesis (Fig. 7). Initially, ethanol was oxidized by ozone to produce acetaldehyde and acetic acid24 (eqn 1 and 2). The production of acetic acid facilitated ozone to oxidize Ce+3 to Ce+4,25,26 (eqn 3). The excess acetate acted as a base to catalyze the conversion of acetaldehyde with ethanol to form the hemiacetal, 1-ethoxyethan-1-ol (eqn 4), which then formed complexes with the available cerium ions (eqn 5) (eqn 6). Note that similar to the observations made by Luche and Gemal,27 we could not rule out that the Ce+4 ions might also catalyze the acetalization of acetaldehyde with ethanol. The acetate could also base-catalyze the formation of complexes between ethanol and cerium ions. Comparable to common nonaqueous sol–gel routes to form M–O–M linkages,28 the two types of cerium complexes probably underwent condensation-like reactions and formed the Ce–O–Ce linkages with diethyl acetaldehyde acetal as the by-product (2% with respect to ethanol) (eqn 6). Hence, the excess acetate, ethanol, and oxidized ethanol by-products all together accelerated the formation of Ce–O–Ce linkages through alcohol-like condensation reactions and promoted the growth of increasingly crystalline ceria NPs. Note that although Li ions were in large excess, the major role of Li ions was to increase the solubility of acetate, and hence the concentration of acetate in our reactant solutions, for facilitating the ceria NPs syntheses. While we cannot discount the possibility of Li ions affecting the stabilization of the reaction intermediates, we do not think that Li ions strongly influence the crystallization of ceria NPs. This is because, regardless of the large concentration variations of Li ions in our examined reactions, the trace incorporations of Li ions (all <1 at%) in our as-synthesized ceria NPs were distinctly trend-less. As such, the trend of observed changes in the crystallinity of ceria NPs was probably not correlated to the concentration of Li ions.
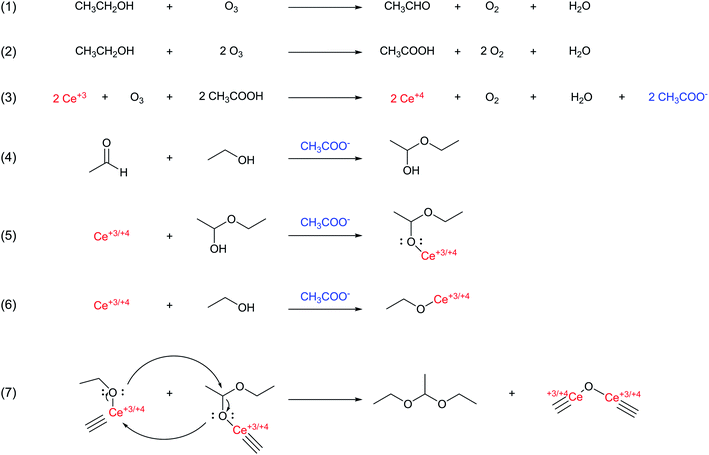 | ||
| Fig. 7 Proposed reaction pathways for the formation of Ce–O–Ce linkages catalyzed by lithium acetate through alcohol-like condensation reactions. | ||
4. Conclusions
The additions of lithium acetate to the ozone-mediated synthesis of fluorite-structured ceria nanoparticles were determined to improve both the synthesis efficiency and crystallinity of the products. The reaction yield of nanoparticles was enhanced to 90.1% based on Ce content, up to an 8-fold improvement compared to conditions without acetate additions (11.6% based on Ce content). By increasing the additions of excess acetate to the reaction, both the average particle size and size distribution of the nanoparticles were observed to decrease while their crystallinity was found to increase. The excess acetate was postulated to substantially functionalize the surface of the ceria NPs and hence effectively limiting the NP growth by decreasing the diffusion rate of cerium ions between the growing crystallites. NMR analysis of the acetate-rich reaction mixtures revealed significant quantities of aldehyde, 1-ethoxyethan-1-ol, and 1,1-diethoxyethane. Based on these findings, the excess acetate and cerium ions were hypothesized to mechanistically assist the reactions by catalyzing the production of the hemiacetal, 1-ethoxyethan-1-ol, from ethanol and aldehyde formed from the ozonation of ethanol. The acetate was also postulated to promote the formation of ethanol and hemiacetal complexes with cerium ions. These complexes then underwent alcohol-like condensation reactions to form the Ce–O–Ce linkages and 1,1-diethoxyethane, which consequently accelerate the growth of crystalline ceria NPs. We expect that our discovered applications of excess acetate to accelerate the growth of ceria NPs in the ozone-mediated reaction can be applied to other similar ozone-mediated syntheses of metal oxide nanoparticles.Conflicts of interest
There are no conflicts to declare.Acknowledgements
This work was supported in part by the Nebraska Public Power District through the Nebraska Center for Energy Sciences Research at the University of Nebraska-Lincoln (UNL) and the National Science Foundation (CHE-1362916, CHE-1757957). The sample characterization was performed in part in the Nebraska Nanoscale Facility: National Nanotechnology Coordinated Infrastructure and the Nebraska Center for Materials and Nanoscience, which are supported by the National Science Foundation under Award ECCS:1542182, and the Nebraska Research Initiative. We thank Dr Joseph Brewer and Josh Beaudoin of Rare Earth Salts for their help with the ICP-MS analyses and Dr Martha Morton at UNL for her help with the NMR analyses.Notes and references
- K. Chang, H. Zhang, M.-j. Cheng and Q. Lu, ACS Catal., 2020, 10, 613–631 CrossRef CAS.
- T. V. M. Sreekanth, P. C. Nagajyothi, G. R. Reddy, J. Shim and K. Yoo, Sci. Rep., 2019, 9, 14477 CrossRef PubMed.
- N. Izu, S. Nishizaki, W. Shin, T. Itoh, M. Nishibori and I. Matsubara, Sensors, 2009, 9, 8884–8895 CrossRef CAS PubMed.
- N. Jaiswal, K. Tanwar, R. Suman, D. Kumar, S. Upadhyay and O. Parkash, J. Alloys Compd., 2019, 781, 984–1005 CrossRef CAS.
- D. Cardillo, M. Weiss, M. Tehei, T. Devers, A. Rosenfeld and K. Konstantinov, RSC Adv., 2016, 6, 65397–65402 RSC.
- L. Sun, X. Hao, Q. Meng, L. Wang, F. Liu and M. Zhou, Adv. Electron. Mater., 2019, 5, 1900271 Search PubMed.
- M. Krishnan, J. W. Nalaskowski and L. M. Cook, Chem. Rev., 2010, 110, 178–204 CrossRef CAS PubMed.
- H. J. Kwon, M.-Y. Cha, D. Kim, D. K. Kim, M. Soh, K. Shin, T. Hyeon and I. Mook-Jung, ACS Nano, 2016, 10, 2860–2870 CrossRef CAS PubMed.
- M. Coduri, S. Checchia, M. Longhi, D. Ceresoli and M. Scavini, Front. Chem., 2018, 6, 526 CrossRef CAS PubMed.
- T. Montini, M. Melchionna, M. Monai and P. Fornasiero, Chem. Rev., 2016, 116, 5987–6041 CrossRef CAS PubMed.
- L. Vivier and D. Duprez, ChemSusChem, 2010, 3, 654–678 CrossRef CAS PubMed.
- H. Oh and S. Kim, J. Aerosol Sci., 2007, 38, 1185–1196 CrossRef CAS.
- Catalysis by Ceria and Related Materials, ed. A. Trovarelli and P. Fornasiero, Imperial College Press, London, 2013 Search PubMed.
- A. Bhalkikar, T.-S. Wu, C. M. Marin, T. J. Fisher, M. Wang, I. H. Wells, A. Sarella, Y.-L. Soo and C. L. Cheung, Nanoscale, 2018, 10, 9822–9829 RSC.
- M. E. Azenha, H. D. Burrows, S. M. Fonseca, M. L. Ramos, J. Rovisco, J. S. de Melo, A. J. F. N. Sobral and K. Kogej, New J. Chem., 2008, 32, 1531–1535 RSC.
- T. Ghoshal, P. G. Fleming, J. D. Holmes and M. A. Morris, J. Mater. Chem., 2012, 22, 22949–22957 RSC.
- C. A. Schneider, W. S. Rasband and K. W. Eliceiri, Nat. Methods, 2012, 9, 671–675 CrossRef CAS PubMed.
- C. Slostowski, S. Marre, O. Babot, T. Toupance and C. Aymonier, Langmuir, 2012, 28, 16656–16663 CrossRef CAS PubMed.
- A. Filtschew, K. Hofmann and C. Hess, J. Phys. Chem. C, 2016, 120, 6694–6703 CrossRef CAS.
- G. R. Fulmer, A. J. M. Miller, N. H. Sherden, H. E. Gottlieb, A. Nudelman, B. M. Stoltz, J. E. Bercaw and K. I. Goldberg, Organometallics, 2010, 29, 2176–2179 Search PubMed.
- C.-H. Huang and J. R. Morrow, Inorg. Chem., 2009, 48, 7237–7243 CrossRef CAS PubMed.
- H. Zhang, W. Zhang, M. Zhao, P. Yang and Z. Zhu, Chem. Commun., 2017, 53, 1518–1521 RSC.
- M. a. R. Capeletti, L. Balzano, G. de la Puente, M. Laborde and U. Sedran, Appl. Catal., A, 2000, 198, L1–L4 CrossRef CAS.
- S. Rakovski and D. Cherneva, Int. J. Chem. Kinet., 1990, 22, 321–329 CrossRef CAS.
- J. P. Caire, F. Laurent, S. Cullie, F. Dalard, J. M. Fulconis and H. Delagrange, J. Appl. Electrochem., 2003, 33, 703–708 CrossRef CAS.
- S. Singh, A. N. Bhaskarwar, T. Vincent and P. K. Wattal, J. Radioanal. Nucl. Chem., 2016, 309, 691–700 CAS.
- J.-L. Luche and A. L. Gemal, Chem. Commun., 1978, 22, 976–977 RSC.
- M. Niederberger, Acc. Chem. Res., 2007, 40, 793–800 CrossRef CAS PubMed.
Footnotes |
| † Electronic supplementary information (ESI) available: Microscopy images, electron diffraction patterns, and thermogravimetric analysis data of samples. See DOI: 10.1039/d0ra02309d |
| ‡ These two authors contributed equally to the manuscript. |
| This journal is © The Royal Society of Chemistry 2020 |

