 Open Access Article
Surface modification of biomaterials based on cocoa shell with improved nitrate and Cr(VI) removal†
P. Nkuigue Fotsing*a,
E. Djoufac Woumfoa,
S. Mezghichb,
M. Mignotb,
N. Mofaddelb,
F. Le Derfb and
J. Vieillard b
b
aLaboratory of Applied Inorganic Chemistry, Faculty of Sciences, University of Yaoundé I, P.O. Box 812, Yaoundé, Cameroon. E-mail: fotsing_p@yahoo.fr
bNormandie Univ., UNIROUEN, INSA Rouen, CNRS, COBRA (UMR 6014), 55, rue Saint Germain, 27000 Evreux, France
First published on 27th May 2020
Abstract
The present work addresses the development of simple, low-cost and eco-friendly cocoa-shell-based materials for efficient removal of heavy metal hexavalent chromium (Cr(VI)), and toxic nitrate (NO3−) from aqueous solution. A conventional treatment process was used to purify cocoa shell (CS) into an adsorbent, followed by chemical grafting of dendrimers to promote its surface properties for nitrate and Cr(VI) removal. The morphology, surface charge, structure and stability of the new adsorbent were investigated by scanning electron microscopy, Fourier transform infrared and UV-visible spectroscopies, zeta potential, X-ray photoelectron spectrometry, and differential scanning calorimetry. The successful chemical grafting of the dendrimer (polyethyleneimine, PEI) onto purified CS was confirmed. CS-T-PEI-P proved to be a very efficient candidate for the removal of nitrate and chromium(VI). Removal of the two pollutants at different initial concentrations and pH values was studied and discussed. Sorption of chromium and nitrate was found to obey 2nd-order kinetics and a Freundlich-type isotherm, affording an uptake adsorption of 16.92 mg g−1 for NO3− and 24.78 mg g−1 for Cr(VI). These results open promising prospects for its potential applications as a low cost catalyst in wastewater treatment.
1. Introduction
Widespread industrial activities and urbanization have increased the critical problem of the availability of drinkable water, and resulted in dangerous pollution of the surficial drinking water resources.1 Numerous pollutants such as dyes, pharmaceuticals, phenolic molecules and heavy metals in the water supplies are hazardous, can have carcinogenic effects, and can cause several symptoms such as acute diarrhea, skin irritation, or severe headaches.2,3 Particularly, nitrate and heavy metal are considered as carcinogenic and very toxic pollutants that can cause cancer of the digestive tract, nephritis and gastrointestinal ulceration.4Despite the interesting role of nitrogen (N) for living organisms, organic nitrogen such as nitrate (NO3−), include a threat to the ecosystems and public health, due to its high concentrations contributing to eutrophication and various diseases, such as infant methemoglobinemia [2]. The same danger, even more can be caused by the metal iron based on hexavalent chromium (Cr(VI)), considering its easily absorption by the body and to invade the human organs through the digestive, respiratory, and mucous membrane.
This is why a special, urgently interest could be devoted to adopt efficient technologies to remove both Cr(VI) and (NO3−) from contaminated water, including low-pressure membrane filtration, ion exchange, chemical precipitation, reverse osmosis, and biological treatment.5
Recently, water treatments have involved so far numerous technologies including both physical and chemical processes like reverse osmosis, chemical reduction with iron nanoparticles, the adsorption and biological denitrification.6,7
Most of these methods show practical limitations in the removal of nitrate and Cr(VI), especially, the poor stability of membrane filtration has limited its application in industry. Unlike the high operating costs, ion exchange and reverse osmosis are not economically attractive because of their high operating costs.8,9 Compared to these remediation techniques, adsorption and advanced oxidation techniques are simple, cheap and effective technologies.4,10–13 Therefore, there is an increasing demand for preparing new adsorbents with surface functional groups and high adsorption capacity. Adsorption is considered as the most promising procedure for the removal of heavy metal ions because it is simple and cost-effective. This is why, recently, a special interest was devoted to develop an ecofriendly materials with enhanced adsorption properties.14–16
Regarding to its poor economic feasibility, limited applicability and effectiveness, and a short lifetime often linked to low and expensive regeneration capacities, the adsorbents are considered a good candidate for removing both (NO3−) and Cr(VI) from water.
Among the wide variety of materials used or investigated for adsorption of (NO3−) and Cr(VI), activated carbon, metal oxide, graphene oxide, zeolites and fibrous materials are of great interest for some environmental purposes. An interesting alternative consists in using biomass which has a natural composition, low costs and ecofriendly. Particularly, biomass-based adsorbents, are used for sustainable applications to attenuate the impacts of wastewater treatments.
The cocoa industry generates a large amount of waste byproduct each year. Cocoa-shell (CS) as biomass has recently been considered as an adsorbent of interest for a variety of environmental applications and drawn the researchers' attention for heavy metal removal from wastewater. Reportedly, CS as a raw biomass material have already been found to exhibit adsorptive properties toward gas.
Innovative technologies have led to major developments in preparing, for instance, functional biomass as adsorbent with easy-care properties, stability and low toxicity.
Up to now, García, J. C. et al. demonstrated that dilute alkali can damage the structure of cellulose, hemicelluloses, and lignin in wheat straw.17 Wu, M. examined the effects of various modification methods on wheat straw biadsorbents via microwave-assisted alkalization and microwave-assisted acid oxidation.18 Huang, Y. et al. studied the chemically activation of dewaxed cornstalk by nitrilotriacetic acid anhydride.19 In other works, dendrimer-based hyper-branched polymers, and chitosan are employed to provide useful information on the state of adsorbents and on how they enhance the surface properties of the materials.20 Polymer grafted-biomass has been investigated as a suitable technique to upgrade the physicochemical properties of such types of CS minerals.21 In addition, such a study can also enrich the knowledge of the adsorption process for environmental remediation. Reports about the use of CS as a support for such applications are scarce, and information about the structure of the different CS supported dendrimers are scarce too. One of the commonly studied polymers integrated with biomass into a composite is chitosan. The compositing process results in a hybrid material of enhanced textural and adsorption properties for effective decontaminations of organic and inorganic pollutants.22–24
This paper reports a simple, low-cost and environment-friendly protocol for the preparation and functionalization of cocoa-shell-based biomass using conventional physical treatments and chemical grafting of dendrimers. The purpose of this work was to investigate the surface properties and discuss in detail the application of such materials for heavy metal (hexavalent chromium) and nitrate removal from aqueous solution. The structure and morphology of synthesized materials were studied by UV-Vis spectroscopy, Fourier transform infrared spectroscopy, field emission scanning electron microscopy, zeta potential and X-ray photoelectron spectroscopy. The effect of the adsorbent concentration, pH and time were investigated to postulate a mechanism.
2. Material and methods
2.1. Chemicals
Potassium dichromate (K2Cr2O7, 99%), potassium nitrate (KNO3, 99%), sulfuric acid (95%), absolute ethanol (EtOH, 99%) methanol (MeOH, 99%), 1.5-diphenylcarbazide (C13H14N4O, 98%), branched polyethyleneimine (PEI, average Mw of 25![[thin space (1/6-em)]](https://www.rsc.org/images/entities/char_2009.gif) 000), potassium chloride (99%), hydrochloric acid (37%), acetic acid (CH3COOH, 96%), sodium hydroxide (98%), ethylenediaminetetraacetic acid dissodium salt (C10H14N2Na2O8, 2H2O, 99%), sodium nitrate (NaNO3, 99%), salicylic acid (C7H5NaO3, 99%), and sodium azide (NaN3, 99.5%) were purchased from Merck (France) and used as supplied. All the solutions were prepared using double distilled water (Milli Q, Merck, Millipore).
000), potassium chloride (99%), hydrochloric acid (37%), acetic acid (CH3COOH, 96%), sodium hydroxide (98%), ethylenediaminetetraacetic acid dissodium salt (C10H14N2Na2O8, 2H2O, 99%), sodium nitrate (NaNO3, 99%), salicylic acid (C7H5NaO3, 99%), and sodium azide (NaN3, 99.5%) were purchased from Merck (France) and used as supplied. All the solutions were prepared using double distilled water (Milli Q, Merck, Millipore).
2.2. Cocoa cortex preparation and functionalization
The functional CS-T-PEI-P materials were synthesized as follows (Scheme 1). Firstly, cocoa-shell (CS) was collected from a local farm managed by the IRAD (Institute of Agricultural Research for Development) at Yaoundé, Cameroon. Cocoa shell was cut, washed with acidic water (HCl, 1 M) to remove organic matter, sun-dried for 5 days, and then heated at 70 °C overnight to remove moisture. Finally, it was ground and sifted at 160 μm and the resulting treated CS was named CS-T. Secondly, CS-T was modified with branched polyethyleneimine (PEI) by the impregnation method using the procedure described by Xu et al.25,26 Briefly, 30% of PEI was dissolved in 70 mL of methanol for 15 min. Then, the desired amount of CS-T was added to the solution. The slurry was continuously stirred for 3 hours at 23 °C. The PEI-modified adsorbent was filtered, washed several times using distilled water and then the resulting CS-T-PEI was dried at 50 °C overnight. Finally, CS-T-PEI (10 g L−1) was acidified using HCl (0.5 M) solution for 2 h at 23 °C to protonate the amino groups leading to positively charged ammonium moieties.27,28 The protonated material, designated as CS-T-PEI-P was recovered by filtration, washed several times with distilled water and dried at 50 °C overnight.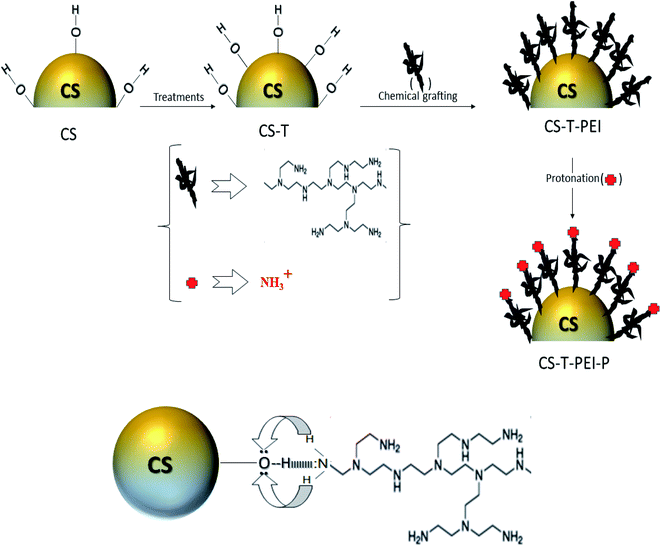 | ||
| Scheme 1 Schematic illustration of the preparation of CS-T-PEI-P and the possible interactions between dendrimers and CS adsorbent. | ||
2.3. Material characterization
The physicochemical properties of CS-T, CS-T-PEI and CS-T-PEI-P were characterized by scanning electron microscopy (SEM), Fourier transform infrared (FTIR) analysis, and differential scanning calorimetry (DSC). SEM micrographs of the samples were obtained using a ZEISS EVO 15 electron microscope after metallization of different samples by a gold layer at 18 mA for 360 s using a Biorad E5200 device. The functional groups present in CS-T, CS-T-PEI and CS-T-PEI-P were investigated by FTIR analysis using a Tensor 27 (Bruker) spectrometer with a ZnSe crystal over the 4000–500 cm−1 wavenumber range. 20 scans were recorded for each spectrum with a resolution of 4 cm−1. DSC of the samples was carried out with a DSC-131 Setaram with a 20 °C–500 °C temperature range and a heating rate of 10°C min−1. The zeta potential of CS-T, CS-T-PEI and CS-T-PEI-P dispersions was measured via electrophoretic light scattering (ELS) combined with phase analysis light scattering (PALS) using a Malvern Zetasizer Nano ZS setup. Measurements were performed with suspensions of 0.1 g of the different adsorbents in 10 mL of distilled water. The pH at point of zero charge (pHpzc) of CS-T, CS-T-PEI and CS-T-PEI-P was determined by the solid addition method.29,30 The pH value-of each sample was determined using a Consort C 863 electronic multi-parameter analyzer. The initial pH values (pHi) of 50 mL of 0.1 mol L−1 of NaNO3 solution were roughly adjusted in the 1.0–12.0 pH range by using 0.1 mol L−1 of HCl and NaOH. Then, 0.1 g of each sample was added to previously prepared NaNO3 solutions, and shaken for 3 h until reaching equilibrium at ambient temperature for 48 h. Then, the final pH (pHf) of the solutions was measured and pHpzc was determined as ΔpH = 0 from a plot of (pHf − pHi) versus pHi.2.4. Adsorption experiments
The adsorption performance of functionalized CS was evaluated in the batch adsorption of NO3− and Cr(VI) at 23 °C. 0.2 g of CS-T-PEI-P were mixed with different concentrations of NO3− and Cr(VI) solutions in flasks (from 50 to 400 mg L−1). Then, the mixtures were shaken in a thermostatic shaker at 300 rpm until equilibrium was reached. Afterwards, the suspensions were filtered on 0.45 μm-filter paper under vacuum, and the concentrations of NO3− and Cr(VI) in the filtrate were determined calorimetrically using a UV-Vis spectrophotometer (SHIMADZU UV-1640). The Cr(VI) concentrations were in the filtrate was measured at a maximum wavelength of 540 nm after complexation with 1,5-diphenylcarbazide,31,32 while the NO3− concentrations were measured at a wavelength adjusted to 415 nm and using the sodium salicylate method.33 The pH was adjusted by adding small quantities of concentrated (0.1 M) HCl or NaOH solution. The adsorption kinetic was studied using 0.2 g of adsorbent in 50 mL of the NO3− and Cr(VI) ion solutions (natural pH) with varying initial pollutant concentrations (50, 100 and 150 mg L−1) in 100 mL Erlenmeyer flasks. The suspensions were stirred during 5 to 420 min and 5 to 540 min for NO3− and Cr(VI) respectively. After a pre-determined time, the solution was filtered and then analyzed quantitatively. The equilibrium adsorption isotherms were performed to determine the maximum adsorption capacity (qmax) for NO3−/Cr(VI) at 23 ± 2 °C. Modified CS (0.2 g) was mixed with 50 mL of solutions at different initial concentrations of the pollutants ranging between 50 and 400 mg L−1 at natural pH. The suspensions were stirred until equilibrium times of 240 and 420 min were reached for NO3− and Cr(VI) respectively. The amounts of Cr(VI) or NO3− adsorbed at equilibrium (qe) were calculated using eqn (1):
 | (1) |
The adsorption yields E (%) were estimated using eqn (2):
 | (2) |
The effect of the pH on nitrate and Cr(VI) adsorption was investigated at 23 ± 2 °C in the initial 2.0–12.0 pH range. Cr(VI) solution was prepared at 100 mg L−1 and the pH was adjusted by adding 0.1 M HCl or 0.1 M NaOH. Adsorbent (0.2 g) was added into each solution and reacted until the equilibrium times 240 and 420 min for nitrate and Cr(VI), respectively.
2.5. Desorption and regeneration experiments
The desorption experiments were performed using 0.1 M NaOH solution as eluent to estimate the reversibility of functionalized CS and recovery of NO3− and Cr(VI) ions.34 The adsorbents were first equilibrated with NO3− and Cr(VI) ions in aqueous solution with an initial concentration of 100 mg L−1, and then the desorption test was initiated by mixing in the presence of NaOH solution until equilibrium time of 4 h and 7 h for NO3− and Cr(VI), respectively. After the desorption test, the adsorbents were thoroughly washed with distilled water and reused in the next cycle of adsorption experiments. The desorption and regeneration experiments were carried out at 23 ± 2 °C. The amounts of desorbed NO3− and Cr(VI) ions (Qdes) and efficiency (% of desorption) were determined by eqn (3) and (4), respectively:
 | (3) |
 | (4) |
3. Results and discussion
3.1. Surface morphology and structure
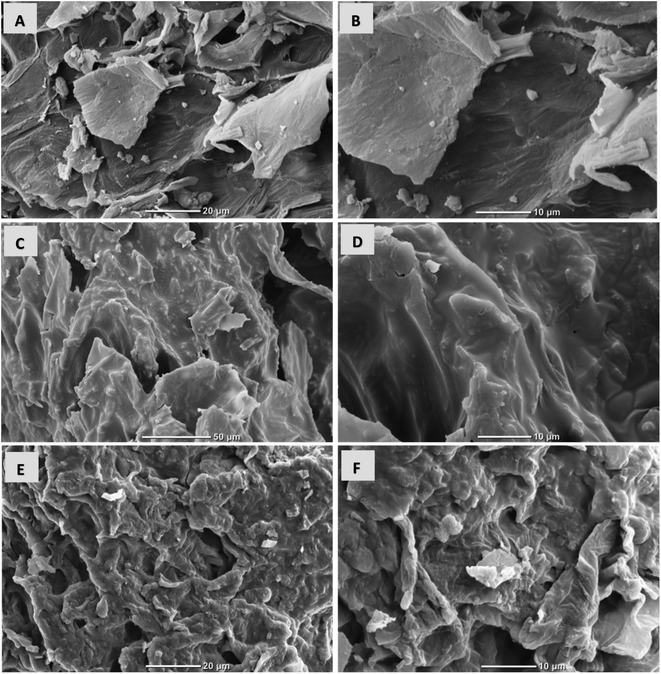
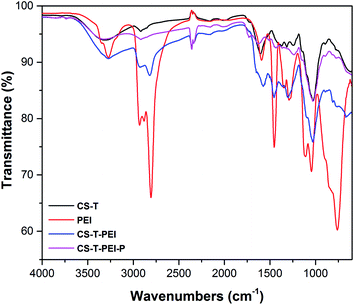
SEM images of CS-T, CS-T-PEI and CS-T-PEI-P are shown in Fig. 1. The treated cocoa shell (CS-T) exhibits a lamellar structure with the smooth cell walls without mesopores and macropores. The lamellar structure of CS are attributed to the irregularly shaped lignocellulosic layers in which cellulose fibers can be distinguished from the lignin sheath. Comparing CS-T with CS-T-PEI, the surface becomes rough and cracked due to the decomposition of the components during chemical grafting of PEI and the drying at 50 °C. As seen in Fig. 1E and F, after modification, adsorbent exhibited serious shrinkage and porous structure of the adsorbent collapsed as the result of shrinkage.The IR spectra of CS-T, CS-T-PEI and CS-T-PEI-P are given in Fig. 2. The characteristic peaks of CS-T appeared at 3308 cm−1 and 2918 cm−1 and were assigned to the –OH and C–H stretching vibrations of cellulose, hemicellulose and lignin.35 The peak at 1374 cm−1 was attributed to the C–H bending vibration, and the absorption band at 1150 cm−1 corresponded to the C–O asymmetric stretching vibration. The peaks at 1732 and 1023 cm−1 corresponded to the stretching vibrations of the C![[double bond, length as m-dash]](https://www.rsc.org/images/entities/char_e001.gif) O and C–O groups of hemicellulose and cellulose.36 Compared with the spectrum of pristine CS-T, more peaks occurred in the spectra of PEI-modified CS-T. The peaks of the PEI spectrum at 2934–2810 cm−1 and 3280–1588 cm−1 were visible only on CS-T-PEI and CS-T-PEI-P and were attributed to the –CH, –CH2– and N–H stretching vibration of the amide bond, respectively.34,37 The peaks of the O–H stretching vibration and N–H stretching vibration shifted to 3268 cm−1 and their intensity increased significantly.36,38 This suggests that no covalent bond was formed between CS and PEI. Reportedly, different strength of CS–O interaction with amines may be involved, resulting in a complex hydrogen-bonding network and residual water molecules from the synthesis. Therefore CS covering by PEI appears to rather involve ionic and hydrogen bridges interactions. Similar interaction type has already been reported for organic macromolecules bearing terminal groups with high affinity towards metal oxide.39–42 New peaks at 2926 and 2824 cm−1 were attributed to the C–H stretching vibration of –CH and –CH2– from PEI.43,44 The strong peak at 1458 cm−1 visible on PEI and CS–PEI was ascribed to the stretching vibration of the C–N–H bond.45 The peaks at 1572 cm−1, 1302 cm−1 and 1100 cm−1 corresponding to the bending of amino groups (N–H) from PEI were also visible in the spectrum of CS-T-PEI.34,46 These results clearly indicate that the macromolecular chains of PEI were successfully impregnated to the CS-T surface. After acidic treatment, the increase of the peak intensity at 3320 cm−1 was associated to the stretching vibration of NH3+ whereas the peaks at 1730, 1648 and 1450 cm−1 were assigned to the symmetric and asymmetric stretching vibration of N–H.37
O and C–O groups of hemicellulose and cellulose.36 Compared with the spectrum of pristine CS-T, more peaks occurred in the spectra of PEI-modified CS-T. The peaks of the PEI spectrum at 2934–2810 cm−1 and 3280–1588 cm−1 were visible only on CS-T-PEI and CS-T-PEI-P and were attributed to the –CH, –CH2– and N–H stretching vibration of the amide bond, respectively.34,37 The peaks of the O–H stretching vibration and N–H stretching vibration shifted to 3268 cm−1 and their intensity increased significantly.36,38 This suggests that no covalent bond was formed between CS and PEI. Reportedly, different strength of CS–O interaction with amines may be involved, resulting in a complex hydrogen-bonding network and residual water molecules from the synthesis. Therefore CS covering by PEI appears to rather involve ionic and hydrogen bridges interactions. Similar interaction type has already been reported for organic macromolecules bearing terminal groups with high affinity towards metal oxide.39–42 New peaks at 2926 and 2824 cm−1 were attributed to the C–H stretching vibration of –CH and –CH2– from PEI.43,44 The strong peak at 1458 cm−1 visible on PEI and CS–PEI was ascribed to the stretching vibration of the C–N–H bond.45 The peaks at 1572 cm−1, 1302 cm−1 and 1100 cm−1 corresponding to the bending of amino groups (N–H) from PEI were also visible in the spectrum of CS-T-PEI.34,46 These results clearly indicate that the macromolecular chains of PEI were successfully impregnated to the CS-T surface. After acidic treatment, the increase of the peak intensity at 3320 cm−1 was associated to the stretching vibration of NH3+ whereas the peaks at 1730, 1648 and 1450 cm−1 were assigned to the symmetric and asymmetric stretching vibration of N–H.37
To ensure the proper grafting of dendrimers and identify any interaction that occurred during processing, the treated and untreated adsorbents were analyzed chemically by XPS. The broad-scan spectra and elemental quantifications are presented in Fig. S1† and Table 1. C, O and N were the main chemical species present in the samples. The occurrence of S in the scans was probably due to contamination when the samples were handled. The amine, oxygen and carbon percentages in the CS samples were 2.43%, 23.09% and 40.98%, respectively. After dendrimer grafting, XPS analysis revealed an increase in the carbon (from 40.98 to 42.86%) and nitrogen (from 2% to 16.45%) concentration, while the amount of oxygen is sharply decreased from 23.09 to 7.64%, suggesting that oxygen are well covered with amine. After protonation, the nitrogen concentration was decreased indicating that no covalent bond was formed between CS and PEI. Reportedly, different strength of CS–O interaction with amines may be involved, resulting in a complex hydrogen-bonding network. In addition, the decreases of nitrogen and carbon concentration are attributed to the mean acidic condition that destabilize the amine and the CS structure, and then reduce the carbon quantity.
| Samples | Atomic composition (%) | ||
|---|---|---|---|
| C | O | N | |
| CS-T | 40.98 | 23.09 | 2.43 |
| CS-T-PEI | 42.86 | 7.64 | 16.45 |
| CS-T-PEI-P | 19.37 | 20.90 | 3.03 |
Regarding to the XPS curve of CS-T-PEI-P, peaks corresponding to the C 1s orbital can be deconvoluted into two peaks referred to the C–N bonds around 288 eV.47Furthermore, the increased C–NH2 peak could be ascribed to the successful amine functionalization of CS. However, for CS-T-PEI-P, the N 1s spectra revealed a peak that could be separated into two peaks at approximately 399.5 and 401 eV. These peaks were assigned to C–NH and –NH2/NH3+ bonds, respectively.47 The N 1s binding energy was lower after chemical coating of the dendrimer. This was explained by the contribution of the lone electrons from NH3+ to increase the surface electron density of CS-T-PEI and CS-T-PEI-P, confirming protonation.48
3.2. Thermal stability and surface properties
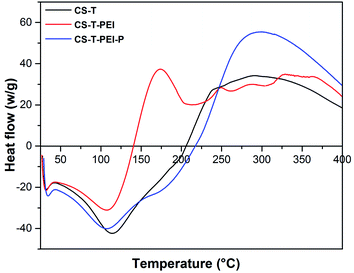
DSC analysis in the 25–400 °C temperature range was also performed to investigate the thermal stability of modified CS (Fig. 3). The endothermic peak observed at around 109 °C was attributed to evaporation of free water from all samples.35 The DSC curve of CS-T displayed a broad exothermic peak between 230 and 280 °C, which corresponded to the degradation of cellulose, lignin and hemicellulose.49–51 3 exothermic peaks at 175, 250 and 326 °C corresponding to impregnated amine degradation were observed on CS-T-PEI-P.37 Interestingly, a visible slight of both exothermic and endothermic peaks was observed for CS-T-PEI-P curve. Here, this slight toward the lower temperature, is a signal not only for the presence of PEI, but also for the improvement of the thermal stability. Therefore, PEI and PEI-P treatment increased the thermal stability of cocoa shells in the 140–400 °C range. All results were supported SEM and IR data, also in good agreement with literature.49Zeta potential analysis also provided important information about the surface charge density of the material. The average zeta potential for pristine CS-T was negative at −29.80 mV, probably resulting from the charge contribution of cellulose, hemicellulose and lignin.35,49 After PEI coating, the zeta potential shifted from −29.8 to 7.3 mV. The increase in zeta potential revealed a strong modification of the surface, which can be explained by the positive charge of the PEI layer present on the cocoa cortex surface. HCl post-activation also changed the surface charge after the protonation step, the zeta potential increased from 7.3 to 18.6 mV, suggesting that some protons could still be entrapped in the CS-T-PEI-P structure.
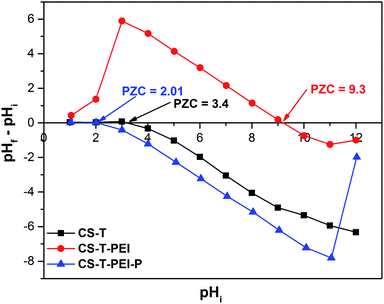
The electrokinetic properties of the sorbent were investigated to elucidate the mechanism of the reaction between CS-T-PEI-P and nitrate or Cr(VI). The pH at point zero charge of CS-T, CS-T-PEI and CS-T-PEI-P were measured at different initial pH values (1.0–12.0) (Fig. 4). The pHpzc is the pH at which the amount of negative charges on the adsorbent surface just equals the amount of positive charges.30 The pHpzc values of CS-T and CS-T-PEI were 3.4 and 9.3, respectively. The pHpzc of CS-T-PEI was significantly higher than that of CS-T owing to the basic nature of the amino groups on the CS-T-PEI surface.50,52 This value was higher than that of PEI-modified rice husk ash (9.0)52 and PEI-modified corn stalks (6.5),50 suggesting a greater amount of basic groups present on CS-T-PEI. Therefore, pHpzc confirmed the grafting of amino groups on the CS-T surface, in accordance with DSC, SEM and FTIR analysis, and indicated that CS-T-PEI could sequestrate Cr(VI) and nitrate by electrostatic interaction. After acidic activation, pHpzc value is reduced from 9.3 for CS-T-PEI to 2.01 for CS-T-PEI-P indicating the acidic behavior of the surface (H+ donor). This may be attributed to the protonation of the amine groups on the CS-T-PEI-P surface.53
3.3. Parameter effects and surface interactions
The adsorption properties of the materials were studied for the removal of Cr(VI), and nitrate. All materials had affinity towards the adsorption of nitrate and chromate (Fig. 5). Interestingly, post-treatment of CS played a role in the enhancement of NO3− and Cr(VI) adsorption. The grafting of PEI and the protonation steps particularly increased the adsorption properties of the materials. Therefore, our functionalization method can be employed as an efficient way to increase the adsorption capacity for removing pollutants.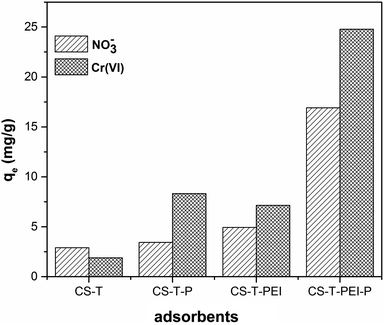 | ||
| Fig. 5 Adsorption of nitrate and chromate onto different adsorbents (Ci = 100 mg L−1, V = 50 mL, time of contact 6 h, 300 rpm, mads = 0.2 g, 23 °C and initial pH = 2). | ||
The sorption of nitrate and Cr(VI) onto CS-T-PEI-P as a function of the pH is shown in Fig. S2.† For nitrate, the adsorption capacity of CS-T-PEI-P increased from pH 2.0 to 5.0, with a maximum experimental adsorption capacity of 16.71 mg g−1 at pH 5.0. Further increases up to pH 10.0 remained close to the maximum value and then decrease drastically above pH 11.0. Other studies have reported maximum nitrate adsorption at lower pH values, for example 31 mg g−1 at pH 4.5.54 These differences might be due to the interference of Cl− ions (from the HCl solution used to adjust the pH) which occupied the adsorbent surface and compete with nitrate.55 At higher pH values, competition between OH− and NO3− may have occurred, resulting in decreased NO3− adsorption, and causing electrostatic repulsion between the surface and NO3− ions.56,57 For Cr(VI), no significant change occurred in terms of Cr(VI) removal capacity in the 2.0–11.0 pH range, indicating that the adsorption process was almost independent of initial pH.58 In these cases, the experimental adsorption capacity decreased from 24.98 to 24.10 mg g−1, and the corresponding removal rate decreased from 99.93 to 96.40%. Various anionic forms of Cr(VI) were present in the solution, including chromate CrO4− at alkaline pH, and other anionic forms (HCrO4−, Cr2O72−, CrO4−) at acidic pH.50,59 Amino groups on CS-T-PEI reacted with H+ after acidic treatment, producing –NH3+ on the surface, and this group strongly adsorbed Cr(VI) through electrostatic attraction.50,59 The adsorption capacity and the corresponding removal rate decreased drastically when the initial pH was greater than 11.0. This poor capacity of CS-T-PEI-P may be attributed to the increasing competition for sites between OH− and Cr(VI).60
The adsorption equilibrium time is defined as the time required for the pollutant concentration to reach a constant value. The kinetic plots of the studied developed in this work are presented in Fig. S3 and S4.†
Natural cocoa cortex was a poor candidate for nitrate and Cr(VI) adsorption. Only 1.9 mg g−1 and 2.9 mg g−1 of ions were adsorbed respectively. HCl treatment of CS-T multiplied by almost 8 the amount of adsorbed Cr(VI). However, the increase was limited for nitrate adsorption. PEI coating on CS-T was also a good strategy to increase the amount of adsorbed Cr(VI) but the adsorption yield of nitrate still remained limited. The synthesis of CS-T-PEI-P yielded the best adsorbent based on cocoa cortex. More than 24 mg g−1 of Cr(VI) and 16 mg g−1 of nitrate were adsorbed by CS-T-PEI-P, confirming that this composite is promising for pollutant removal (Table 2).
| Adsorbents | QNO3− (mg g−1) | QCr(VI) (mg g−1) |
|---|---|---|
| CS-T | 2.90 | 1.89 |
| CS-T-P | 3.43 | 8.32 |
| CS-T-PEI | 4.94 | 7.15 |
| CS-T-PEI-P | 16.92 | 24.78 |
3.4. Kinetic studies
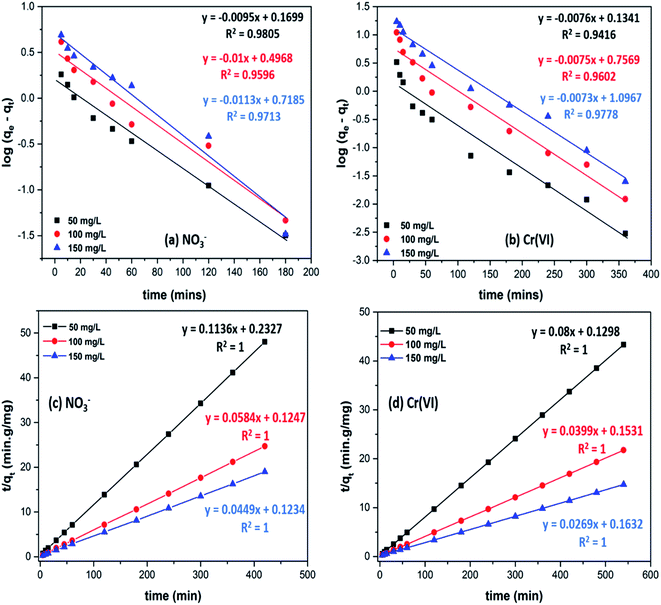
Adsorption kinetics are proposed for understanding the mechanism involved in the adsorption process (Fig. 6 and S3†). Numerous theoretical models provide an insight into the mechanism whereby the adsorbate accumulates on the biosorbent surface.60,61 To study the adsorption kinetics of nitrate and chromium(VI) onto CS-T-PEI-P, experimental datas were simulated by Lagergren pseudo-first order model (eqn (S5)†), pseudo-second order model (eqn (S6)†), Elovich equation (eqn (S7)†) and the intra-particle diffusion model (eqn (S8)†).50,62–64 The adsorption kinetics constants and correlation coefficients of nitrate and chromium(VI) adsorption onto CS-T-PEI-P are shown in Table S1.† Experimental data were best fitted with the pseudo-second order with a correlation coefficient of around 1. According to the pseudo-second order equation, the qe,cal values (8.80, 17.12 and 22.27 mg g−1 for NO3− and 12.50, 25.06 and 37.17 mg g−1) for Cr(VI) were markedly similar to the experimental values (qe,exp = 8.76, 17.04 and 22.12 mg g−1 for NO3− and 12.45, 24.82 and 36.63 mg g−1) for Cr(VI). These results suggest that the process controlling the adsorption rate may be chemical sorption involving valency forces through sharing or exchange of electrons between biosorbent and adsorbate.56,65Diffusion from the solid–liquid interface to the interior of the solid particles plays a very important role in adsorption. Fig. 6b plots qt versus t0.5 where the curve did not pass through the origin. It indicates that although intra-particle diffusion was involved in the sorption process, it was not the only rate-limiting step, and boundary layer diffusion controlled sorption. Other kinetic processes occurred simultaneously and contributed to the sorption mechanism.60,66
Several isotherm equations are available for analyzing experimental data. Four important isotherms were selected for this study, namely the Freundlich (eqn (S9)†), Langmuir (eqn (S10)†), Temkin (eqn (S11)†) and Dubinin–Radushkevich (eqn (S12)–(S14)†) models.68–71 The equilibrium data for adsorption of Cr(VI) and nitrate were fitted to the previous model. They are presented in Fig. S4 and S5.† The theoretical parameters of the isotherms were determined from and listed with the regression coefficients in Tables S1 and S2.†
The Freundlich isotherm best described the adsorption of NO3− and Cr(VI) onto CS-T-PEI-P, suggesting (Fig. S6†) multilayer adsorption.38,72,73 However, monolayer adsorption may also have played determining role in pollutants adsorption onto CS-T-PEI-P because the values of the correlation coefficient were close to 1. The maximum monolayer adsorption capacity for NO3− and Cr(VI) onto CS-T-PEI-P was estimated from Langmuir model at 86.956 mg g−1 for NO3− and 94.340 mg g−1 for Cr(VI). The largest amounts of adsorbed NO3− and Cr(VI) molecules recorded during the first step of the adsorption process (Fig. S6†). The maximum monolayer adsorption capacities (qmax) for NO3− and Cr(VI) adsorption onto CS-T-PEI-P were compared with the qmax of other adsorbents available in the literature (Table 3). CS-T-PEI-P appeared highly competitive, with higher performance than other adsorbents previously reported in the literature.
| Biosorbent name | Functionalization | Capacity (mg g−1) | Reference |
|---|---|---|---|
| NO3− | |||
| Modified granular activated carbon | [3-(Methacryloylamino)propyl]-trimethylammonium chloride | 26 | 75 |
| Virgin reed | Triethylamine | 118.9 | 76 |
| Corn stalks | Ethylenediamine | 65.359 (298K) | 56 |
| Sugarcane bagasse biochar | Ethylenediamine | 28.21 | 54 |
| PEG/chitosan and PVA/chitosan | Polyethylene glycol and polyvinyl alcohol | 50.68–35.03 | 20 |
| Modified steel slag | Aluminium hydroxide | 16.396 | 77 |
| Corn stalks | Diethylamine | 13.6054 | 78 |
| Modified cocoa cortex | PEI–HCl | 86.956 | This study |
![[thin space (1/6-em)]](https://www.rsc.org/images/entities/char_2009.gif) |
|||
| Cr(VI) | |||
| Modified granular activated carbon | [3-(Methacryloylamino)propyl]-trimethylammonium chloride | 81.00 | 75 |
| Sugarcane bagasse | Iron(III)-impregnated | 13.72 | 58 |
| Brown algae | Hydrochloric acid | 52.631 | 79 |
| Virgin reed | Triethylamine | 135.00 | 76 |
| Coarse sugarcane bagasse (biochar) | Amino-terminated hyperbranched polymer | 75.36 | 73 |
| Masau stone | Diethylenetriamine | 87.32 | 80 |
| Spent substrate (Auricularia auricular) | Cetyl trimethyl ammonium bromide and immobilized by sodium alginate | 27.25 | 81 |
| Modified cocoa cortex | PEI–HCl | 94.340 | This study |
The Freundlich model constants nF were 1.460 and 2.864 for NO3− and Cr(VI), respectively reflecting that the adsorption process between NO3− and Cr(VI) with CS-T-PEI-P was favorable (1 < n < 10).38,45 The correlation with the Freundlich model supported the existence of electrostatic interactions between NO3− and Cr(VI) on the one hand–NH3+ of CS-T-PEI-P on the other hand.72 The adsorption energy (E) values estimated from Dubinin–Radushkevich (D–R) isotherms were 0.090 and 2.610 kJ mol−1 for NO3− and Cr(VI), respectively, suggesting that NO3− and Cr(VI) were sorbed onto CS-T-PEI-P by physisorption.74
![[thin space (1/6-em)]](https://www.rsc.org/images/entities/char_2009.gif) kc vs. 1/T and presented in Table S3.†
kc vs. 1/T and presented in Table S3.†The negative values of ΔG° at all temperatures for nitrate (−1.566, −1.318, −0.963 and −0.608 kJ mol−1) and chromate (−12.10, −13.963, −16.624 and −19.285 kJ mol−1) indicated that the adsorption process was spontaneous. For nitrate, the spontaneity of the adsorption process decreased when temperature increased whereas for chromium ions it increased when temperature increased. In the case of nitrate, the negative value of ΔH° (−12.071 kJ mol−1) suggested that the reaction was exothermic, further confirming that higher temperature was not favorable for nitrate adsorption. The negative value of entropy change ΔS° (−35.488 J K−1 mol−1) reflected the affinity of NO3− for CS-T-PEI-P. It indicated variation in CS-T-PEI-P structure and decreasing randomness at the adsorbent–aqueous solution.82,83 The standard enthalpy and entropy values of Cr(VI) were 66.677 kJ mol−1 and 266.139 J K−1 mol−1, respectively. The positive value of ΔH° proved that the adsorption of Cr(VI) onto CS-T-PEI-P was endothermic, further confirming that higher temperature was favorable for Cr(VI) adsorption. The value of ΔS° was positive suggesting the increase of randomness at the solid–solution interface during the adsorption of Cr(VI) ions on the active site of the adsorbent.25,75
3.5. Desorption and regeneration studies
For industrial application, sorbents have to be recoverable and reusable with a limited loss of efficiency. We conducted desorption experiments using 0.1 M NaOH solution with different contact times. The desorption kinetics of CS-T-PEI-P for NO3− and Cr(VI) are shown in Fig. 7. The desorption process was rapid, and the maximum yield was reached after 180 minutes for NO3− (corresponding to 84% of desorption) and 200 minutes for Cr(VI) (corresponding to 70% of desorption). The regeneration studies of CS-T-PEI-P were conducted over 5 cycles (Fig. 8). After 5 consecutive adsorption–desorption cycles, the adsorption capacities was reduced from 16.88 to 12.95 mg g−1 (from 67.51 to 51.81%) for nitrate removal and from 24.82 to 19.23 mg g−1 (from 99.30 to 61.16%) for Cr(VI) removal. This slight decrease is due to the loss of adsorbent particles, during the filtration and recover steps. However, the presence of considerable amount of amine at the CS surface endorses the potential reusability. The different data indicated that CS-T-PEI-P had good recyclability and reusability.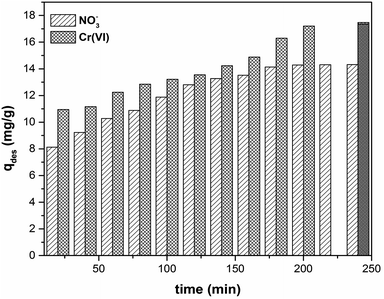 | ||
| Fig. 7 Desorption of NO3− and Cr(VI) from CS-T-PEI-P (Ci = 100 mg L−1, V = 50 mL, mads = 0.2 g, initial pH, RT, 300 rpm). | ||
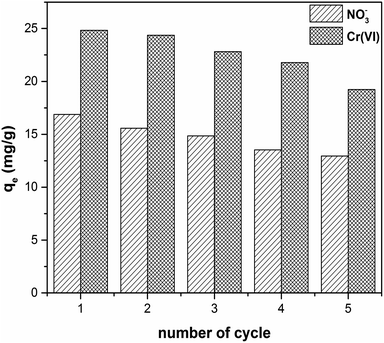 | ||
| Fig. 8 Reusability of CS-T-PEI-P for NO3− and Cr(VI) removal in five successive adsorption/desorption cycles (Ci = 100 mg L−1, V = 50 mL, mads = 0.2 g, initial pH, RT, 300 rpm). | ||
4. Conclusion
In summary, this work introduces a facile approach to functionalize biomaterials based on cocoa shells, using physical treatment, chemical grafting of dendrimer and protonation. The resulting materials CS-T-PEI-P were fully characterized and the surface properties, thermal stability and morphology were investigated. CS covering by PEI appears to rather involve ionic and hydrogen bridges interactions with high stability. The synergistic effect of protonate dendrimer on a CS surface become a promising candidate as adsorbent of hexavalent chromium and nitrate ions from aqueous solution. Experimental parameters such as pH, equilibration time, pollutant concentration and temperature were optimized. The removal phenomena followed by Freundlich model and the sorption reaction was well fitted to be pseudo-second order kinetic model. The maximum monolayer adsorption capacities achieved 86.956 mg g−1 for NO3− and 94.340 mg g−1 for Cr(VI). Results on desorption and regeneration studies proved that the new functionalized support based on cocoa-shell has good recyclability and reusability.Author contribution
P. Nkuigue Fotsing: investigation and writing original draft, Prof. E. Djoufac Woumfo: conceptualization and supervision, Dr S. Mezghich: investigation, Dr M. Mignot: resources and validation, N. Mofaddel: validation, F. Le Derf: funding administration, J. Vieillard: project administration, supervision, writing review and editing.Conflicts of interest
There are no conflicts to declare.Acknowledgements
This work was partially supported by INSA Rouen, Normandy Rouen University, CNRS, Labex SynORg (ANR-11-LABX-0029), the French Embassy in Cameroon (879327A), the Haute Normandie Region (CRUNCH and SéSa networks) and Grand Evreux Agglomération.References
- C. J. Vörösmarty, et al., Nature, 2010, 467, 555 CrossRef PubMed.
- M. M. Ayad and A. A. El-Nasr, J. Phys. Chem. C, 2010, 114, 14377–14383 CrossRef CAS.
- J. Lin, et al., Bioresour. Technol., 2010, 101, 34–40 CrossRef CAS PubMed.
- M. R. Abukhadra, et al., Ecotoxicol. Environ. Saf., 2018, 157, 358–368 CrossRef CAS PubMed.
- N. K. Lazaridis and D. D. Asouhidou, Water Res., 2003, 37, 2875–2882 CrossRef CAS PubMed.
- N. D. Suzaimi, et al., J. Environ. Chem. Eng., 2019, 7, 103235 CrossRef.
- C. V. Lazaratou, et al., Appl. Clay Sci., 2020, 185, 105377 CrossRef.
- J. Hu, et al., Langmuir, 2005, 21, 11173–11179 CrossRef CAS PubMed.
- H. Liu, et al., Water Res., 2011, 45, 145–154 CrossRef CAS PubMed.
- J. Cao, et al., Chem. Eng. J., 2018, 353, 126–137 CrossRef CAS.
- W. Xiong, et al., Chemosphere, 2018, 210, 1061–1069 CrossRef CAS PubMed.
- M. R. Abukhadra, et al., Adv. Powder Technol., 2018, 29, 2501–2511 CrossRef CAS.
- M. Yang, et al., J. Colloid Interface Sci., 2017, 506, 669–677 CrossRef CAS PubMed.
- M. Hua, et al., J. Hazard. Mater., 2012, 211–212, 317–331 CrossRef CAS PubMed.
- F. Mohamed, et al., Sci. Total Environ., 2018, 640–641, 352–363 CrossRef CAS PubMed.
- C. Zhou, et al., ACS Sustainable Chem. Eng., 2018, 6, 4174–4184 CrossRef CAS.
- J. C. García, et al., Biochem. Eng. J., 2013, 71, 127–133 CrossRef.
- M. Wu, et al., Int. J. Environ. Res. Public Health, 2019, 16, 205 CrossRef PubMed.
- Y. Huang, et al., RSC Adv., 2015, 5, 11475–11484 RSC.
- A. Rajeswari, et al., J. Water Process Eng., 2016, 9, 123–134 CrossRef.
- E. M. S. Azzam, et al., Int. J. Biol. Macromol., 2016, 89, 507–517 CrossRef CAS PubMed.
- V. N. Tirtom, et al., Desalin. Water Treat., 2012, 39, 76–82 CAS.
- Q. Liu, et al., Int. J. Biol. Macromol., 2015, 72, 1129–1135 CrossRef CAS PubMed.
- B. N. Narayanan, et al., Mater. Sci. Eng., B, 2010, 168, 242–244 CrossRef CAS.
- M. S. Sajab, et al., Bioresour. Technol., 2013, 128, 571–577 CrossRef CAS PubMed.
- X. Xu, et al., Energy Fuels, 2002, 16, 1463–1469 CrossRef CAS.
- M. Arora, et al., Cold Reg. Sci. Technol., 2010, 62, 92–97 CrossRef.
- K. Jaafari, et al., Water SA, 2001, 27, 9–14 CAS.
- E. Kiefer, et al., Environ. Sci. Technol., 1997, 31, 759–764 CrossRef CAS.
- A. E. Ofomaja, et al., J. Hazard. Mater., 2009, 168, 909–917 CrossRef CAS PubMed.
- J. Maity and S. K. Ray, Int. J. Biol. Macromol., 2016, 89, 246–255 CrossRef CAS PubMed.
- S. Chen, et al., Chem. Eng. J., 2011, 168, 909–917 CrossRef CAS.
- A. M. E. Khalil, et al., Chem. Eng. J., 2017, 309, 349–365 CrossRef CAS.
- Y. Ma, et al., Bioresour. Technol., 2014, 169, 403–408 CrossRef CAS PubMed.
- J. Vieillard, et al., Chem. Eng. J., 2018, 342, 420–428 CrossRef CAS.
- N. B. Mohamed, et al., Chem. Eng. Trans., 2017, 56, 103–108 Search PubMed.
- Y. Liu, et al., RSC Adv., 2013, 3, 18803–18810 RSC.
- L. You, et al., Int. J. Biol. Macromol., 2018, 107, 1620–1628 CrossRef CAS PubMed.
- Y. Coppel, et al., Chem.–Eur. J., 2012, 18, 5384–5393 CrossRef CAS PubMed.
- N. Bouazizi, et al., Int. J. Hydrogen Energy, 2016, 41, 11232–11241 CrossRef CAS.
- R. D. Bach, et al., J. Adhes. Sci. Technol., 1994, 8, 249–259 CrossRef CAS.
- P. Joshi, et al., Phys. Chem. Chem. Phys., 2011, 13, 476–479 RSC.
- Y. Wang, et al., Mater. Chem. Phys., 2018, 207, 105–113 CrossRef CAS.
- H. He, et al., Sci. Rep., 2017, 7, 3913 CrossRef PubMed.
- W. Zhan, et al., RSC Adv., 2018, 8, 18723–18733 RSC.
- N. Rao, et al., Energy Fuels, 2018, 32, 670–677 CrossRef CAS.
- C. Hu, et al., J. Colloid Interface Sci., 2019, 553, 372–381 CrossRef CAS PubMed.
- Y.-H. Ding, et al., Dalton Trans., 2018, 47, 684–692 RSC.
- R. Bargougui, et al., J. Environ. Chem. Eng., 2018, 6, 325–331 CrossRef CAS.
- W.-H. Chen and P.-C. Kuo, Energy, 2011, 36, 6451–6460 CrossRef CAS.
- R. Ianchis, et al., J. Nanopart. Res., 2012, 14, 1233 CrossRef.
- A. Imyim and E. Prapalimrungsi, J. Hazard. Mater., 2010, 184, 775–781 CrossRef CAS PubMed.
- S. Deng and Y. P. Ting, Environ. Sci. Technol., 2005, 39, 8490–8496 CrossRef CAS PubMed.
- L. Divband Hafshejani, et al., Ecol. Eng., 2016, 95, 101–111 CrossRef.
- M. A. Khan, et al., Sep. Sci. Technol., 2011, 46, 2575–2584 CrossRef CAS.
- W. Song, et al., J. Hazard. Mater., 2016, 304, 280–290 CrossRef CAS PubMed.
- S. Jain, et al., J. Environ. Chem. Eng., 2015, 3, 2342–2349 CrossRef CAS.
- Y. Zhu, et al., Int. J. Environ. Sci. Technol., 2012, 9, 463–472 CrossRef CAS.
- P. C. Okafor, et al., Int. J. Electrochem. Sci., 2012, 7, 12354–12369 CAS.
- Q.-Q. Zhong, et al., Carbohydr. Polym., 2014, 111, 788–796 CrossRef CAS PubMed.
- S. S. Gupta and K. G. Bhattacharyya, Adv. Colloid Interface Sci., 2011, 162, 39–58 CrossRef PubMed.
- S. Lagergren, K. Sven. Vetenskapsakad. Handl., 1898, 24, 1–39 Search PubMed.
- Y. S. Ho and G. McKay, Process Biochem., 1999, 34, 451–465 CrossRef CAS.
- J. W. J. Weber and J. C. Morris, J. Sanit. Eng. Div., Am. Soc. Civ. Eng., 1963, 89, 31–59 Search PubMed.
- Y. Li, et al., Cellulose, 2018, 25, 4757–4769 CrossRef CAS.
- K. Nithya, et al., Desalin. Water Treat., 2016, 57, 25097–25113 CrossRef CAS.
- T. Zang, et al., Ecol. Eng., 2017, 99, 358–365 CrossRef.
- H. M. F. Freundlich, J. Phys. Chem., 1906, 57, 385–470 CAS.
- I. Langmuir, J. Am. Chem. Soc., 1916, 38, 2221–2295 CrossRef CAS.
- M. Temkin and V. Pyzhev, Acta Physicochim. URSS, 1940, 12, 327–356 CAS.
- M. M. Dubinin and L. V. Radushkevich, Proc. Acad. Sci. Phys. Chem. Sec. USSR, 1947, 55, 331–333 Search PubMed.
- D.-M. Guo, et al., RSC Adv., 2017, 7, 54039–54052 RSC.
- L. Xia, et al., Polymers, 2018, 10, 931 CrossRef PubMed.
- A. A. Inyinbor, et al., Water Resources and Industry, 2016, 15, 14–27 CrossRef.
- D.-W. Cho, et al., Chem. Eng. J., 2011, 175, 298–305 CrossRef CAS.
- Z. Ren, et al., J. Colloid Interface Sci., 2016, 468, 313–323 CrossRef CAS PubMed.
- L. Yang, et al., Water, 2017, 757, 1–17 CrossRef PubMed.
- C. Fan and Y. Zhang, J. Geochem. Explor., 2018, 188, 95–100 CrossRef CAS.
- T. Ainane, et al., J. Mater. Environ. Sci., 2014, 5, 975–982 CAS.
- A. B. Albadarin, et al., J. Environ. Manage., 2017, 204, 365–374 CrossRef CAS PubMed.
- C. Zhang, et al., RSC Adv., 2017, 7, 34182–34191 RSC.
- T. Wu, et al., Water Res., 2016, 93, 30–37 CrossRef CAS PubMed.
- Y. Wu, et al., J. Taiwan Inst. Chem. Eng., 2016, 66, 191–199 CrossRef CAS.
Footnote |
| † Electronic supplementary information (ESI) available. See DOI: 10.1039/d0ra03027a |
| This journal is © The Royal Society of Chemistry 2020 |

