 Open Access Article
Study of a color-tunable long afterglow phosphor Gd1.5Y1.5Ga3Al2O12:Tb3+: luminescence properties and mechanism†
Tengfei Ma‡
ab,
Haifeng Li‡a,
Su Zhang*a,
Wenzhi Sunc,
Zhiqiang Chengb,
Ran Panga,
Jing Feng a,
Lihong Jianga,
Da Lia and
Chengyu Li
 *a
*a
aState Key Laboratory of Rare Earth Resources Utilization, Changchun Institute of Applied Chemistry, Chinese Academy of Sciences, Changchun 130022, P. R. China. E-mail: zhangsu@ciac.ac.cn; cyli@ciac.ac.cn
bShandong Industrial Ceramic Research & Design Institute Co., Ltd, Zibo 255000, Shandong Province, P. R. China
cSchool of Materials Science and Engineering, Liaocheng University, Liaocheng 252059, P. R. China
First published on 27th July 2020
Abstract
Long afterglow phosphors play a significant role in practical applications. However, due to their complex electronic structures, it is difficult to obtain tunable long afterglow phosphors. Herein, a novel long afterglow phosphor, Gd1.5Y1.5Ga3Al2O12:Tb3+, was successfully synthesized. Its detailed structural information was extracted via the Rietveld method, and its corresponding optical properties were further systematically explored via photoluminescence (PL), phosphorescence and thermoluminescence (TL) spectroscopy. Both the photoluminescence and long afterglow properties showed tunable behavior with a variation in the concentration of Tb3+. The investigation of the tunability of its photoluminescence and long afterglow properties revealed that the cross-relaxation energy transfer mechanism contributes to its tunable character. Meanwhile, long-lasting phosphorescence could be observed for a few hours by the naked eye in a dark environment after discontinuing the UV irradiation. Due to the potential existence of the photo-excited (Tb3+)+, the  defect clusters were proposed, with oxygen vacancies acting as electron trapping centers and (Tb3+)+ attracting holes. Finally, an appropriate mechanism for the tunable long afterglow emission was proposed.
1. Introduction
Long afterglow phosphors (LAPs), compared with the common photoluminescence phosphors, have particular luminescent characteristics, which can absorb either visible or ultraviolet light initially, and subsequently release the stored energy in the form of a persistent photon emission at ambient temperature after the removal of the excitation source.1–3 Thus, based on their inherent properties for energy storage, LAPs have been widely employed in the fields of emergency lighting, displays and alternating current white LEDs, and also show potential applications in various fields, such as rewritable three-dimensional optical memory and image storage, medical diagnostics and in vivo bio-imaging, high-energy irradiation dosimeters, and persistent photocatalysis.1,4–10Since the discovery of the green persistent phosphors SrAl2O4:Eu2+,Dy3+ by Matsuzawa et al. in 1996,9 extensive research on different long afterglow phosphors has been conducted with the purpose of tuning their emission colors, extending their persistent luminescence lifetimes and rationalizing the mechanism of their persistent luminescence. In general, the long afterglow properties rely on the defects in phosphors, which can trap electrons or holes during the excitation process, and then release them at emission centers under thermal stimulation, resulting in phosphorescence emission. Thus, producing appropriate defects in the host, and subsequently improving its capability of storing the incident energy are mainly realized through inequivalent substitution, i.e. doped ions as luminescence centers, especially lanthanide ions or transition metal ions, which occupy the sites of the matrix ions with a different valence. In addition, to further enhance the optical intensity of LAPs, another type of ion is usually incorporated into the host as an assistant activator to modify its defects and improve its afterglow properties. Thus, the colors of LAPs are determined by the characteristics of their emission centers, while the intensity and persistent time are regulated by the defects created or improved by inequivalent doping. Thus, based on this method, numerous LAPs such as Ca14Mg2(SiO4)8: Eu2+,Dy3+,11 Sr2MgSi2O7: Eu2+,Dy3+,12 Ca9Bi(PO4)7: Eu2+,Dy3+,13 Zn2P2O7: Tm3+,Mn2+,14 Ba5Si8O21: Eu2+,Dy3+,15 CaAl2O4: Eu2+,Nd3+,16,17 and SrAl2O4: Eu2+,Dy3+,9,18 have been successfully designed and synthesized. The colors of their long afterglow originate from the luminescent centers of the Eu2+ or Mn2+ dopants, which strongly depend on the crystal-field effect of the host lattice, while the defects produced or improved by the inequivalent doping serve as auxiliary centers to control the afterglow intensity and the persistent time.
However, besides co-doping, a long persistent emission is commonly observed in LAPs with only one activator such as CdSiO3: Tb3+,19 CdSiO3: Dy3+,4 CaMgSi2O6: Mn2+,20 Zn3Ga2Ge2O10: Cr3+,1 Gd3Al2Ga3O12: Ce3+,5 KGaGeO4: Bi3+,21 Ca3Ti2O7: Pr3+,22 and Ca2SnO4: Tm3+,23 Zn1.98Li0.02P2O7: Yb3+,24 and CaSnO4:Tb3+.25 In the forbidden band of these phosphors, some discrete energy levels exist, which are pertinent to the defects accounting for their emission. The long phosphorescence is attributed to the possible interpretation that trap carriers are generated at certain defect sites during the excitation process and thermal excitation promotes the occurrence of their de-trapping action at room temperature, followed by energy transfer from the traps to the emissive centers, resulting in an afterglow emission. In terms of the functionality of doped ions, they not only act as activators, but serve as charge traps. As is known, the special structures of the energy levels of some lanthanide elements enable them to be activators of LAPs,26 such as cerium, praseodymium, samarium, europium, terbium, dysprosium, and ytterbium. Accordingly, Tb3+ ions have been widely used as promising green-emitting activators because of their dominant emission at about 543 nm, which is derived from the 5D4 → 7F5 electron transition,19,27 and Table 1 shows some of the Tb3+-doped long afterglow phosphors. However, to date, Tb3+-doped LLPs with tunable persistent emission have rarely been reported.
| No. | Host | EXa (nm/—) | EMb | TPc (eV) | Ref. |
|---|---|---|---|---|---|
| a EX is the excitation wavelength or excitation source.b EM is the emission color of the long afterglow.c TP is the trap depth (eV).d — means not report or non-existent. | |||||
| 1 | La2O2CO3 | 258 | Green | 0.848 | 28 |
| 2 | Cs2NaYF6 | X-ray | UV | —d | 29 |
| 3 | Ca2SnO4 | 255 | Green | — | 30 |
| 4 | Na2CaSn2Ge3O12 | 249 | White | — | 31 |
| 5 | Y3Al2Ga3O12 | UV | White | 0.8 | 32 |
| 6 | Li2SrSiO4 | 290 | Green | — | 33 |
| 7 | SrLaGaO4 | 274 | Green | 0.62 | 34 |
| 8 | Li2Ca0.4Sr0.6SiO4 | 284 | Green | 0.43 | 35 |
| 9 | Sr3TaAl3Si2O14 | 254 | Green | 0.7 | 36 |
| 10 | Ca3TaAl3Si2O14 | 254 | Green | 0.54 | 37 |
| 11 | Li2CaGeO4 | 254 | Blue | — | 38 |
| 12 | CdSiO3 | UV | Green | 0.66 | 19 |
| 13 | CaWO4 | 254 | Green | 0.74 | 39 |
| 14 | CaZnGe2O6 | 236 | Green | — | 40 |
| 15 | Y2O2S | 254 | Green/white | 0.68 | 41 |
In terms of the possible reason why Tb3+-doped color tunable LAPs are rare, it is challenging to find a feasible host for Tb3+ ions to actualize the emergence of long-lasting phosphorescence. Yttrium aluminum garnet, Y3Al5O12 (YAG),42 the most typical representative of the garnet family, coupled with the dopant Ce3+, has been widely used as the host in the commercial LED market due to its simple and low cost fabrication, stable chemical and physical properties, and color stability during the operation period.43 To modify its luminescent properties, such as light yield, luminescence lifetime, and thermal stability, and to augment its ionizing radiation absorption efficiency, the Y and Al cations are usually substituted by larger and heavier ions, such as Gd and Ga, respectively, to form multicomponent garnets.42 A recent study showed that the light yield of (Y, Gd)3(Ga, Al)5O12:Ce3+ can exceed 44![[thin space (1/6-em)]](https://www.rsc.org/images/entities/char_2009.gif) 000 photon per MeV, which is almost twice that of YAG:Ce3+.44 However, despite the advantages of multicomponent garnets, Y1.5Gd1.5Ga3Al2O12-based long afterglow phosphors have been rarely reported to date. Herein, a novel LAP, Y1.5Gd1.5Ga3Al2O12:Tb3+, with a tunable afterglow emission was successfully developed by employing the terbium ion as an activator. Furthermore, the highlight of this work is the realization of a tunable long afterglow color from blue to yellow via the change in the concentration of doped Tb3+ ions. In addition, the structure, photoluminescence, persistent luminescence and thermoluminescence properties of the as-prepared samples were investigated systematically. Finally, a feasible afterglow mechanism driving this intriguing long afterglow behavior was proposed and discussed in detail.
000 photon per MeV, which is almost twice that of YAG:Ce3+.44 However, despite the advantages of multicomponent garnets, Y1.5Gd1.5Ga3Al2O12-based long afterglow phosphors have been rarely reported to date. Herein, a novel LAP, Y1.5Gd1.5Ga3Al2O12:Tb3+, with a tunable afterglow emission was successfully developed by employing the terbium ion as an activator. Furthermore, the highlight of this work is the realization of a tunable long afterglow color from blue to yellow via the change in the concentration of doped Tb3+ ions. In addition, the structure, photoluminescence, persistent luminescence and thermoluminescence properties of the as-prepared samples were investigated systematically. Finally, a feasible afterglow mechanism driving this intriguing long afterglow behavior was proposed and discussed in detail.
2. Experimental
2.1 Materials and synthesis
In this work, a series of Gd1.5−xY1.5Ga3Al2O12:xTb3+ (GYGA:xTb3+, x = 0, 0.001, 0.005, 0.01, 0.02, 0.04, 0.06, and 0.08) phosphors was synthesized using the conventional high-temperature solid-state reaction. The starting materials were Gd2O3 (A. R.,), Y2O3 (A. R.), Ga2O3 (A. R.), Al2O3 (A. R.) and Tb4O7 (A. R.), which were pretreated at 180 °C for 3 h to remove the absorbed water. Subsequently, the raw materials were weighed at a stoichiometric ratio, and then mixed and ground thoroughly in an agate mortar. Then the homogeneous mixtures were transferred to a crucible, and finally sintered at 1550 °C for 5 h in an air atmosphere. After cooling to room temperature (RT) naturally and grinding again, the obtained powders were further calcined at 850 °C for 6 h in a CO-based reducing atmosphere. Eventually, the re-sintered samples were ground for further measurements after cooling into RT normally.2.2 Characterization
Powder X-ray diffraction (XRD) profiles for phase identification were collected using a D8 Focus diffractometer operating at 40 kV and 40 mA with graphite-monochromated Cu Kα radiation (λ = 0.15405 nm) at a scanning rate of 10° min−1 in the 2θ range of 10° to 120°. The Rietveld refinement analysis was performed using the GSAS-II program.45 The photoluminescence excitation (PLE) and photoluminescence spectra (PL) of the phosphors were measured using a Hitachi F-7000 spectrophotometer with the excitation source of a 150 W xenon lamp and a 340 nanometer filter under a working voltage of 700 V. Decay curves were also measured using the same instrument after the samples were irradiated under 254 nm UV light for 1 min. Long afterglow emission spectra were measured using an Ocean Optics fiber optic spectrometer QE65 Pro. The three-dimension thermo-luminescence (3D-TL) and phosphorescence emission spectra at different temperatures were measured with a homemade instrument mainly consisting of a CCD detector and heating apparatus. The samples were placed in a homemade sample holder and heated from room temperature to 573 K at a speed of 10 K per second, and the data for the thermoluminescence (TL) curves was obtained from the 3D-TL emission spectra with a data transferring technique using computer software. All measurements were performed at room temperature except that for the TL curves.3. Results and discussion
3.1 Phase identification and crystal structure
Powder X-ray diffraction (pXRD) was conducted to verify the phase purity of the as-prepared samples. Fig. 1 displays the representative XRD patterns of the GYGA:xTb3+ phosphors (x = 0, 0.005, 0.01, 0.04, and 0.08). Since Gd1.5Y1.5Ga3Al2O12 and Y3Ga3Al2O12 are isostructural,44 herein, Y3Ga3Al2O12 (JCPDS card no. 89-6660) was used as the reference data. It is conspicuous that the XRD patterns of the samples could be precisely indexed to the standard peaks of Y3Ga3Al2O12, suggesting that all the samples were pure and that the Tb3+ ions were successfully incorporated into the host lattice without introducing significant changes in the crystal structure. In the case of site occupancy, based on the effective ionic radii (r) of cations under different coordination numbers (CN), as reported by Shannon,46 it is suggested that the Tb3+ ions replaced the Gd3+ ions (CN = 8, r = 1.053 Å) due to the comparable radius of Tb3+ (CN = 8, r = 1.04 Å).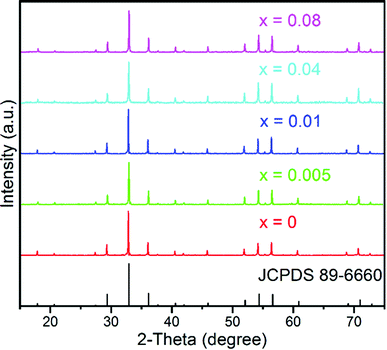 | ||
| Fig. 1 Representative XRD patterns of the GYGA:xTb3+ samples (x = 0, 0.005, 0.01, 0.04 and 0.08) and the reference data of Y3Ga3Al2O12 (JCPDS no. 89-6660). | ||
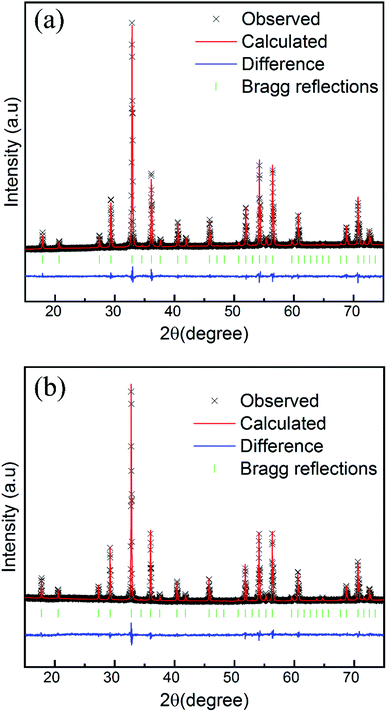
To obtain detailed structural information and further compare the possible changes induced by the dopant, Rietveld refinement was performed for the representative samples of GYGA and GYGA:0.08Tb3+. The refinement results of GYGA and GYGA:0.08Tb3+ are demonstrated in Fig. 2(a) and (b), respectively, and the corresponding lattice parameters and the refinement evaluation coefficients are listed in Table 2. The goodness-of-fit refinement further verified the phase purity of GYGA and GYGA:Tb3+ crystallizing in the cubic structure with the space group of Ia![[3 with combining macron]](https://www.rsc.org/images/entities/char_0033_0304.gif) d. Compared with that of GYGA, the slight decrease in the lattice parameters of GYGA:0.08Tb3+ further supports the proposed occupancy of Tb3+ in the Ga3+ site.
d. Compared with that of GYGA, the slight decrease in the lattice parameters of GYGA:0.08Tb3+ further supports the proposed occupancy of Tb3+ in the Ga3+ site.
| Formula | GYGA | GYGA:0.08Tb3+ |
| Space group | Ia![[3 with combining macron]](https://www.rsc.org/images/entities/char_0033_0304.gif) d d |
Ia![[3 with combining macron]](https://www.rsc.org/images/entities/char_0033_0304.gif) d d |
| a = b = c (Å) | 12.21316(2) | 12.20658(7) |
| α = β = γ (°) | 90 | 90 |
| Units, Z | 8 | 8 |
| Volume (V, Å3) | 1821.659(0) | 1818.528(6) |
| R(F2) (%) | 8.34 | 11.95 |
| Rp (%) | 2.68 | 3.03 |
| Rwp (%) | 3.53 | 3.90 |
| Goodness of fit | 1.53 | 1.48 |
3.2 Photoluminescence properties of GYGA:xTb3+
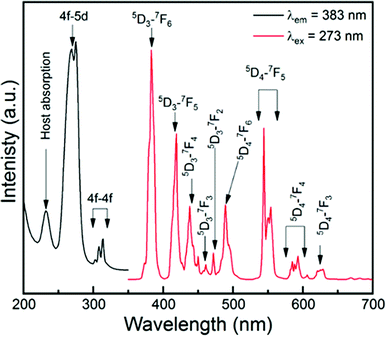
Fig. 3 shows the PLE and PL spectra of the GYGA:0.01Tb3+ sample monitored at 383 nm emission and under 270 nm excitation. The PLE spectrum (black part) in Fig. 3 illustrates several excited peaks arising from different transitions. The first broad band centered at around 231.2 nm is attributed to the host absorption of Gd1.5Y1.5Ga3Al2O12 due to the intrinsic existence of an F+ center.47 Generally, the 4f → 5d transition of Tb3+ ions, such as 7F6 → 7E and 7F6 → 9E, stems from either the high-spin or low-spin splitting of the lowest 5d sublevel, leading to different excitations.48 Here, the peak at 275.1 nm was assigned to the 7F6 → 7E (spin-allowed) transition with a higher intensity, while that centered at 268.2 nm originated from the 7F6 → 9E (spin-forbidden) transition with lower intensity. In addition, the multiple peaks in the region of 299.3–319.6 nm are attributed to the intra 4f → 4f transitions of the Tb3+ ions.The PL spectrum (red one) in Fig. 3 demonstrates the characteristic emission of Tb3+ due to the corresponding f–f transition under the excitation of 270 nm. The emission spectrum displayed both UV-blue and green-yellow emission in the regions of 350–478 nm and 478–650 nm, which are attributed to the intra f–f transitions of Tb3+: 5D3 → 7FJ and 5D4 → 7FJ, respectively. Specifically, the blue emission peaks located at 383.2, 419.0, 438.2, and 461.2 and 472.2 nm are ascribed to the 5D3 → 7FJ (J = 6, 5, 4, 3, 2) transitions, while the green and yellow emission peaks at 489.6, 547.9, 589.6 and 625.4 nm resulted from the 5D4 → 7FJ (J = 6, 5, 4, 3) transitions, respectively.
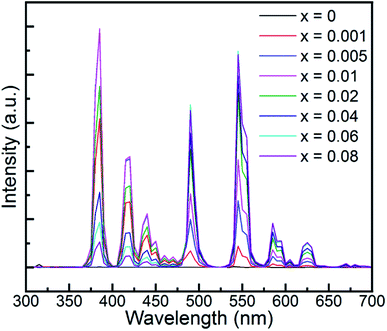
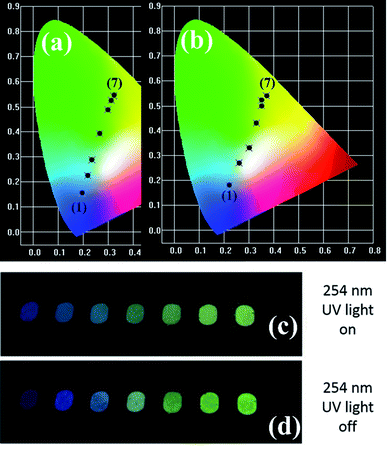
It is well known that the PL emission is related with the dopant concentration. Thus, to explore the impact of the content of Tb3+, the PL spectra of the samples with varying Tb3+ concentrations are depicted in Fig. 4. It is obvious that the intensity of the UV and blue colour part increased with the augmentation of the doped Tb3+ and then decreased beyond the critical concentration of 0.01, whereas the counterpart of the green and yellow colour region increased monotonically with an increase in the amount of Tb3+ up to 0.06, and then declined. In addition, the corresponding photoluminescence CIE chromaticity coordinates of GYGA:xTb3+ (x = 0.001–0.08) were obtained and listed in Table S1.† Fig. 7(a) plots the CIE chromaticity diagram with the obtained coordinates. It can be observed that the emission color varied from bluish to yellow with an increase in the concentration of the dopant Tb3+. Furthermore, the corresponding photoluminescence photographs of GYGA:xTb3+ exhibited in Fig. 7(c) further unambiguously demonstrated the tunable PL emission.
To quantitatively demonstrate this concentration-dependent emission property, the integral intensity of the UV and blue colour part and the green yellow region were calculated and delineated in Fig. 5 with as a function of the doped Tb3+ concentration. It is evident that the integrated intensity of the UV and blue colour part reached the maximum at the Tb3+ concentration of 0.01, and then decreased gradually. In contrast, the integral intensity of the green and yellow colour region increased monotonically and reached the peak up to the Tb3+ content of 0.06 and then diminished. The quantified variation in the PL intensity associated with the concentration of Tb3+ is consistent with the above qualitative description. The variation trend of the intensity indicates that the tunable colour could be realized by introducing different amount of dopants. In addition, the evolution trend also uncovered the concentration quenching behaviour due to the cross-relaxation energy transfer mechanism characteristic for Tb3+-doped phosphors.49 The fact that the energy difference between 5D3 and 5D4 matches that between 7F0 and 7F6 leads to substantial energy transfer via the cross relaxation mechanism as follows:
| 5D3 (Tb3+) + 7F6 (Tb3+) → 5D4 (Tb3+) + 7F0 (Tb3+) |
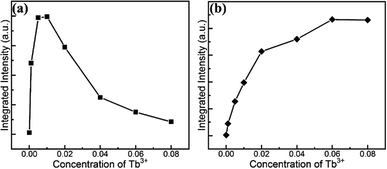 | ||
| Fig. 5 Dependence of integrated PL intensity of UV and blue part (a) and green and yellow region (b) on the doped Tb3+ concentration in GYGA:xTb3+. | ||
Meanwhile, the cross-relaxation process, which strongly depends on the distance of two neighboring ions and is inversely related with the dopant concentration, occurs between two nearest adjacent ions. When the molar content of Tb3+ was less than 0.01, the main PL emission arose from the transition of 5D3 → 7FJ because of the low possibility of the occurrence of cross relaxation behavior between Tb3+ ions due to the large distance. However, the transitions from the 5D3 level vanished due to the increment rate of the concentration quenching with an increase in the Tb3+ concentration beyond 0.01. Subsequently, the emission derived from the 5D4 level transitions dominated up to 0.06. Finally, both emissions diminished because of the general quenching scenario originating from the excess Tb3+ in the host.
3.3 Long afterglow properties of GYGA:xTb3+
Fig. 6 demonstrates the long afterglow spectra of GYGA:xTb3+ (x = 0.001–0.08) after excitation for 1 min under a 254 nm UV light. It is interesting that the long afterglow spectra of GYGA:xTb3+ resembled the PL spectra of GYGA:xTb3+ in terms of the shape and position, as shown in Fig. 4, revealing that the long afterglow of GYGA:xTb3+ is also attributable to the 5D3/5D4 → 7FJ transitions of Tb3+. In addition, it is obvious that the long afterglow emission evolved with Tb3+ content. Specifically, the long afterglow emission originating from the 5D3 → 7FJ transition reached the maximum at x = 0.01, and then was reduced beyond that. In contrast, the intensity of the emission due to the 5D4 → 7FJ transition was monotonically enhanced up to x = 0.06 and then decreased. Analogous to the PL spectra, the long afterglow emission also exhibited a variation in behavior between the 5D3 → 7FJ transition and 5D4 → 7FJ transition related with Tb3+ concentration. This phenomenon indicates that the long afterglow emission was also affected by the concentration quenching caused by the cross-relaxation energy-transfer process. Based on the long afterglow spectra, the corresponding CIE chromaticity coordinates of the GYGA:xTb3+ (x = 0.001–0.08) samples were calculated, as tabulated in Table S1,† and labelled in CIE chromaticity diagram in Fig. 7(b). It can be observed that the long afterglow color varied from bluish to white to yellow by increasing the concentration of the dopant Tb3+. In addition, the corresponding long afterglow photographs of GYGA:xTb3+ shown in Fig. 7(d) further unambiguously demonstrate the tunable long afterglow emission.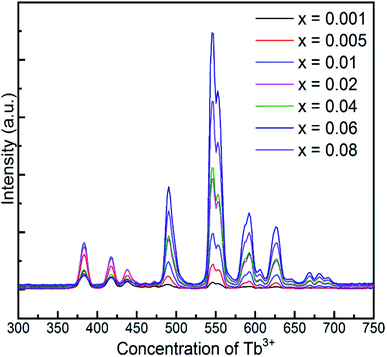 | ||
| Fig. 6 Long afterglow spectra of GYGA:xTb3+ (x = 0.001–0.08) collected after the irradiation of the samples under a 254 nm UV light for 1 min. | ||
3.4 Decay of long afterglow of GYGA:xTb3+
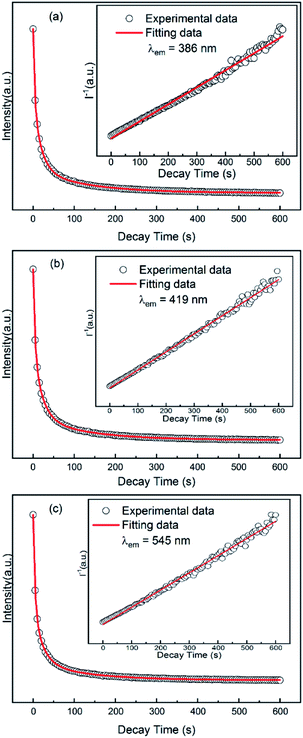
To investigate the long afterglow decay process, the decay property of the GYGA:xTb3+ samples was evaluated by measuring the long afterglow decay curve under three different monitored wavelengths (λ = 386, 419, and 545 nm) under the irradiated wavelength of 254 nm. Among the samples, that with a Tb3+ concentration of x = 0.01 displayed a white long afterglow emission, which lasted for more than 1.5 h in the limit of light perception of dark-adapted human eyes after the removal of 254 nm irradiation. Therefore, the GYGA:0.01Tb3+ sample was chosen as the representative for the decay assessment. Fig. 8 displays the decay curves of GYGA:0.01Tb3+. Generally, exponential functions are always used to fit the long afterglow decay curves to obtain the phosphorescence decay time. Also, second or third exponential functions were customarily employed in previous reports. After comparison, a third-exponential decay equation was found to better describe the decay curves than the second one, as follows:14
I = A1![[thin space (1/6-em)]](https://www.rsc.org/images/entities/char_2009.gif) exp(−t/τ1) + A2 exp(−t/τ1) + A2![[thin space (1/6-em)]](https://www.rsc.org/images/entities/char_2009.gif) exp(−t/τ2) + A3 exp(−t/τ2) + A3![[thin space (1/6-em)]](https://www.rsc.org/images/entities/char_2009.gif) exp(−t/τ3) exp(−t/τ3)
| (1) |
| Sample | GYGA:0.01Tb3+ | |||||
|---|---|---|---|---|---|---|
| λem (nm) | A1 | τ1 (s) | A2 | τ2 (s) | A3 | τ3 (s) |
| 386 | 2350.2 | 3.5 | 2379.3 | 18.8 | 794.2 | 126.7 |
| 419 | 2468.3 | 4.2 | 2164.7 | 21.4 | 709.6 | 128.0 |
| 545 | 2206.5 | 4.2 | 1344.1 | 22.4 | 432.4 | 128.9 |
In addition, the function of the reciprocal afterglow intensity (I−1) versus time (t) was also explored, as shown in the insets of Fig. 8. The I−1–t curves during the whole time range can be well fitted by straight lines (red lines). The linear relationship between I−1 and t indicates the long afterglow emission of YAGG:Tb3+ probably occurs via a tunneling-related process,38 which will be discussed later.
3.5 Thermoluminescence properties of GYGA:xTb3+
Generally, long persistent phosphorescence mainly originates from the release of energy stored in traps such as defects. The outstanding difference in the long afterglow emission from PL reveals a different pathway in the energy transition, indicating that the traps play a significant role in long afterglow emission. Thus, considering this significance, it is pivotal to explore the traps to understand the long-lasting phosphorescence. Generally, thermoluminescence (TL) spectroscopy has been widely employed to investigate the defects and traps produced in insulators or semiconductors by UV light and used for energy storage in LAPs. Hence, the TL spectra of the GYGA:xTb3+ phosphors were measured with a 3D-TL spectrometer under the same conditions as that for the long afterglow spectra. Fig. S1† depicts the representative 3D-TL spectrum of the GYGA:0.01Tb3+ sample, in which the TL intensity is plotted against the temperature and wavelength. The spectrum illustrates the TL emission at diverse temperatures and TL curves at different wavelengths. The shape and position instead of the intensity from the TL spectrum at disparate temperatures for the GYGA:0.01Tb3+ phosphor are analogous to the corresponding ones in the long afterglow emission spectra shown in Fig. 6, which corroborates that the TL emission of the sample is due to the f–f transitions of the Tb3+ dopant. Likewise, the shapes of the TL curves at different wavelengths are congruous. For further analysis, the TL curves as a function of temperature were generated and discussed in the following section.Fig. 9 demonstrates the TL curve of the representative GYGA:0.01Tb3+ phosphor. As can be observed, the two broad TL bands ranging from 300 K to 570 K indicate that the trap levels accounting for the phosphorescence spanned a wide range of energies, leading to the potential generation of traps with various depths.15 To comprehensively investigate the TL property and further obtain the trap depth, the TL curve was first deconvoluted based on the Gaussian function by the curve-fitting technique, and finally was found to be composed of two broad bands at 351 K (P1) and 511 K (P2), respectively, indicating the existence of two trap centers accounting for the long afterglow emission. In general, the trap centers can be deduced by the TL peaks, which can be used to evaluate the depth of the trap level via the temperature position. Usually, the depth of the trap level is proportional to the temperature of the TL peak, i.e. the higher the temperature of the TL peak, the deeper the corresponding trap level. Therefore, based on the deconvolution curves, it can be deduced that there were two types of charge-trapping defects with different trap depths in this long afterglow phosphor. As is well known, an appropriate trap depth is critical for potential long afterglow materials. If the depth of the trap is too shallow, the trapped charges are easily released, resulting in a short persistence time and fast decay of the long afterglow emission. On the other hand, if it is too deep for the captured charges to escape at room temperature, no long afterglow will be observed by the naked eye. It is generally acknowledged that TL bands from 320 to 400 K signify the appropriate depth of traps for the occurrence of long, persistent emission. Moreover, TL peaks close to (or slightly above) room temperature are generally expected to favor the long afterglow emission.52 Therefore, the 351 K TL band is proposed to play a dominant role in the long afterglow emission. In addition, the traps of a phosphor considered as a storage material should be relatively deep to restrain the thermally stimulated release of trapped carriers, whereas that of an afterglow phosphor should be shallower.53 Considering this, it is possible that the GYGA:Tb3+ phosphor can be potentially used as both a light-stimulated (storage) and long afterglow phosphor.
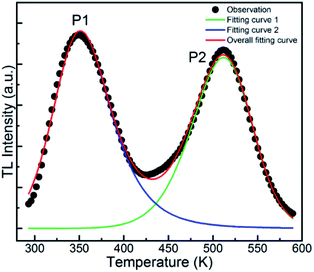 | ||
| Fig. 9 TL curve (black dots) of the GYGA:0.01Tb3+ sample associated with the overall fitting curve (red) and fitting curves 1 (blue) and 2 (green). | ||
Despite the deduced depth of the trap centers from the TL curve, the details of trap centers were still absent. This issue can be overcome by implementing the fitting process for the TL curve based on the previous proposed general order function given by the following equations:54
 | (2) |
| Peak | Tm (K) | S (s−1) | E (eV) | n0 (cm−3) | l |
|---|---|---|---|---|---|
| P1 | 351 | 6.1 × 10⁷ | 0.60 | 2.23 × 10⁸ | 2.00 |
| P2 | 511 | 1.2 × 10⁷ | 0.81 | 1.89 × 10⁸ | 1.26 |
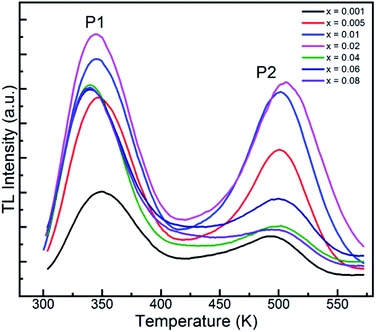
As is known, the trap centers, which are essential for the long afterglow emission, are usually introduced by dopants. Thus, to explore the relationship between the dopant concentration and the traps, the TL curves with varying Tb3+ contents were measured, as shown in Fig. 10. It is evident that the two similar peaks in the TL curves for all the GYGA:xTb3+ samples imply nearly the same defects for all the samples. For peak 1, its intensity increased with an increase in the Tb3+ concentration and reached apex at x = 0.02 and then non-monotonically decreased with a further increment in Tb3+. Concurrently, the peak position shifted to a lower temperature region induced by the augmented amount of Tb3+ dopant. In terms of peak 2, its intensity exhibited a the similar trend as peak 1 with an increase in the amount of Tb3+. Contrary with the evolution of the position of peak 1, the position of peak 2 first underwent a higher temperature shift up to x = 0.02, and then shifted back with a further enhancement in the content of doped Tb3+; however, with the final position almost recovering to the original state. The different evolution in the position of peak 1 and peak 2 indicates the role of the doping concentration in contributing to the formation of two trap centers. The lower temperature-shift behavior of peak 1 also implies the predominant role of peak 1 in the long afterglow emission, in agreement with the generic rule that traps with a feasible depth of less than 373 K promote the occurrence of the long afterglow emission. Fig. S2† shows the integrated area of the TL spectra of GYGA:xTb3+ as a function of doped Tb3+ concentration. It is obvious that the integrated intensity increased gradually up to x = 0.02, and then decreased. Generally, the integrated area covered under each TL curve denotes the gross number of charge carriers in the corresponding trap.15 Specifically, the amount of stored energy should to some extent correspond to the integral intensity of the TL curves. Thus, based on the above discussed long afterglow emission with the maximum intensity at approximately x = 0.06, the evolution of the long afterglow emission is inconsistent with that of TL curves. This phenomenon is possibly because the long-lasting persistent phosphorescent behavior is non-linearly related with the amount of charge carriers, where the stored energy may experience non-radiative decay.
3.6 Mechanism of long afterglow emission of GYGA:xTb3+
In terms of the mechanism of the long-lasting persistent phosphorous emission, generally, the energy of the incident light is partly stored by the carrier charges (holes or electrons) during the excitation period and then some of the stored energy is released under thermal activation, resulting in the characteristic long afterglow emission. In addition, the long duration of the release of captured electrons and holes enables the long afterglow emission. Dopant substituting ions that have similar radii give rise to defects. These deficiencies serve as hole or electron traps to capture holes or electrons in the excitation process. Hence, it is worth noting that traps play a crucial role in the long afterglow emission.As discussed in the experimental part, the high temperature reducing-atmosphere preparation of the long afterglow phosphor GYGA:Tb3+ could introduce intrinsic defects of oxygen vacancies  with positive charges, which could act as electron trapping centers to form an F+ center or an F center by attracting one electron or two, similar to the previous reports.55,56 Since the depth of the trapping potential for the electrons in the F+ centers in oxides is deeper than that in F centers due to one positive charge in the former,57 this can be interpreted by the two peaks with different trapping depths from the thermoluminescence curve. Besides oxygen vacancies, metal vacancies
  such as
  ,
,  ,
,  and
and  displaying negative charges would also be introduced by the high-temperature synthesis. These defects allow the charges to be balanced and maintain electronic neutrality since the substitution of Tb3+ with Gd3+ introduces no net charge deficit or surplus because they have the same formal charge. In addition, the high temperature could escalate the migration of various species present in the material, promoting the occurrence of the aggregation of defects, and subsequently contributing to the formation of defect clusters, as reported previously.58 Based on the previous study on the stabilization of point defects and their agglomeration using ionization potential (IP) by Clabau et al., the capability of a dopant cation to delocalize its electron density to stabilize an empty anion vacancy increases with the reduction of its IP.59,60 Thus, a dopant cation with a lower IP with respect to that of the host cation it replaces should have a stronger tendency to attract an anion vacancy, and, hence stabilize the energy of the associated trapped electron. The comparison of IP shows that the IP of Tb3+ is lower than that of Gd3+,61 indicating the proximity of the dopant Tb3+ to the anion vacancy
  for the stabilization. On the other hand, the proposed existence of the excited state of Tb4+ upon excitation of Tb3+ (4f8 → 4f75d1) under UV reflects that the electrons promoted to the 5d orbitals under excitation could be trapped by oxygen vacancies.59 Meanwhile, the contraction of the 4f orbitals of Tb3+ indicates the impossibility of direct electron–hole recombination and requires oxygen vacancies, as an energy-transfer bridge, close to the emission centers.59 Therefore, it is reasonable to speculate that the inevitable point defects would agglomerate spatially during the high-temperature calcination, forming
  defect clusters with Tb3+ in the close vicinity of
  , similar to the previous reports,52 which act as electron trapping centers with Tb3+ as the emission center. Meanwhile, the formation of clustered defects further favors the occurrence of the tunneling process, which relies on the distance between the involved centers.51,62
Thus, based on the aforementioned discussion, a possible and reasonable mechanism contributing to the afterglow of GYGA:Tb3+ is proposed, as schematically illustrated in Fig. 11. Under ultraviolet light (254 nm) excitation, the electrons located in the ground state of the Tb3+ ions are excited from the occupied 4f orbitals to the empty 5d states with the formation of photo-excited (Tb3+)+ ions (the photo-excited Tb3+ is termed (Tb3+)+ to discriminate from Tb4+ derived from the thermal processes), which is similar to the previous report63 (process 1). Some electrons in the 5d states of the photo-excited (Tb3+)+ ion relax to the 5D3 level, leading to the characteristic PL emission of Tb3+ (process 2). The residual electrons can then be trapped by the oxygen vacancies  via the tunneling process, forming F+/F centers with different trapping potential depths (process 3). The thermal energy due to the ambient temperature after the UV irradiation is switched off leads to the detrapping process, promoting the first tunneling of the stored electrons in the oxygen vacancies
  to the 5D3 level of the photo-excited (Tb3+)+ ion (process 4). The variation in the trapping potential enables the detrapping process at different temperatures, as stated above. These electrons then undergo a series of characteristic f–f transitions with the concurrent afterglow emission and the reduction of (Tb3+)+ to Tb3+. During this process, the electron transition between 5D3 and 5D4 is significantly affected by the cross-relaxation, which relies on the concentration of the Tb3+ dopant. With an increase in the Tb3+ content, a tunable long-lasting phosphorescence from bluish to white to yellow can be obtained owing to the enlarged cross-relaxation process.
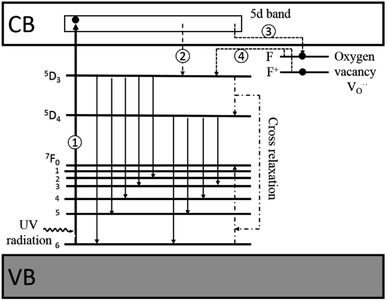 | ||
| Fig. 11 Schematic diagram of the afterglow mechanism for GYGA:Tb3+. Note: VB = valence band, and CB = conduction band. | ||
4. Conclusions
A series of novel long afterglow phosphors Gd1.5Y1.5Ga3Al2O12:Tb3+ was successfully synthesized via a high-temperature solid-state reaction. The structural analysis demonstrated the complete incorporation of the Tb3+ dopants into the host without generating impurities. Under the irradiation of ultraviolet light, both the photoluminescence and long afterglow spectra displayed the characteristic emission of Tb3+ ions due to the 5DJ (J = 3, 4) → 7FJ (J = 4, 5, 6) transitions with tunable emission color due to the cross-relaxation energy transfer triggered by the concentration change in Tb3+. In addition, the long lasting phosphorescence could be observed for a few hours by the naked eyes in the dark environment after discontinuing exposure to ultraviolet light. The TL peaks located at 351 K and 551 K were employed to analyze the depths of the traps, which are 0.6 eV and 0.81 eV, designated as the F and F+ center, respectively, with the former being the dominant in the afterglow emission. The formation of defect clusters with the existence of photo-excited (Tb3+)+ and electron-trapping anion vacancies contributes to the emergence of the long afterglow emission, whereby a tunable long-lasting phosphorescence from bluish to white to yellow can be obtained through the electron transition between 5D3 and 5D4 modified by the cross-relaxation related with the concentration of Tb3+.
Conflicts of interest
There are no conflicts to declare.Acknowledgements
The research is financially supported by the National Key R&D program of China (Grant No. 2019YFA0709102); Youth Innovation Promotion Association, CAS (No. 2017272); the Key Program of the Frontier Science of the Chinese Academy of Sciences (Grant No. YZDY-SSW-JSC018); the Fund for Creative Research Groups (Grant No. 21221061); 2016 Taishan industry Leading talents project.Notes and references
- Z.-w. Pan, Y.-Y. Lu and F. Liu, Nat. Mater., 2012, 11, 58–63 CrossRef CAS PubMed.
- K. van den Eeckhout, D. Poelman and P. F. Smet, Materials, 2013, 6, 2789–2818 CrossRef CAS PubMed.
- Y. J. Liang, F. Liu, Y. F. Chen, X. J. Wang, K. N. Sun and Z. Pan, Light Sci. Appl., 2016, 5, e16124 CrossRef CAS PubMed.
- Y. Liu, B. Lei and C. Shi, Chem. Mater., 2005, 17, 2108–2113 CrossRef CAS.
- H. Lin, B. Wang, J. Xu, R. Zhang, H. Chen, Y. Yu and Y. Wang, ACS Appl. Mater. Interfaces, 2014, 6, 21264–21269 CrossRef CAS PubMed.
- J. Hye Oh, S. Ji Yang and Y. Rag Do, Light Sci. Appl., 2014, 3, e141 CrossRef.
- C. C. Lin, Z. R. Xiao, G.-Y. Guo, T.-S. Chan and R.-S. Liu, J. Am. Chem. Soc., 2010, 132, 3020–3028 CrossRef CAS PubMed.
- Y. Jia, W. Sun, R. Pang, T. Ma, D. Li, H. Li, S. Zhang, J. Fu, L. Jiang and C. Li, Mater. Des., 2016, 90, 218–224 CrossRef CAS.
- T. Matsuzawa, Y. Aoki, N. Takeuchi and Y. Murayama, J. Electrochem. Soc., 1996, 143, 2670–2673 CrossRef CAS.
- J. Kuang and Y. Liu, J. Electrochem. Soc., 2006, 153, G245–G247 CrossRef CAS.
- W. Sun, Y. Jia, R. Zhao, H. Li, J. Fu, L. Jiang, S. Zhang, R. Pang and C. Li, Opt. Mater., 2014, 36, 1841–1845 CrossRef CAS.
- P. Dorenbos, Phys. Status Solidi B, 2005, 242, R7–R9 CrossRef CAS.
- Y. Jia, H. Li, R. Zhao, W. Sun, Q. Su, R. Pang and C. Li, Opt. Mater., 2014, 36, 1781–1786 CrossRef CAS.
- R. Pang, Y. Jia, R. Zhao, H. Li, J. Fu, W. Sun, L. Jiang, S. Zhang, C. Li and Q. Su, Dalton Trans., 2014, 43, 9661–9668 RSC.
- P. Wang, X. Xu, D. Zhou, X. Yu and J. Qiu, Inorg. Chem., 2015, 54, 1690–1697 CrossRef CAS PubMed.
- C. Chang, J. Xu, L. Jiang, D. Mao and W. Ying, Mater. Chem. Phys., 2006, 98, 509–513 CrossRef CAS.
- A. H. Wako, B. F. Dejene and H. C. Swart, Phys. B, 2014, 439, 153–159 CrossRef CAS.
- H. N. Luitel, T. Watari, R. Chand, T. Torikai and M. Yada, J. Mater., 2013, 2013, 10 Search PubMed.
- L. C. V. Rodrigues, H. F. Brito, J. Hölsä, R. Stefani, M. C. F. C. Felinto, M. Lastusaari, T. Laamanen and L. A. O. Nunes, Journal of Physical Chemistry C, 2012, 116, 11232–11240 CrossRef CAS.
- A. Bessière, A. Lecointre, K. R. Priolkar and D. Gourier, J. Mater. Chem., 2012, 22, 19039 RSC.
- W. Sun, R. Pang, H. Li, D. Li, L. Jiang, S. Zhang, J. Fu and C. Li, J. Mater. Chem. C, 2017, 5, 1346–1355 RSC.
- B. Wang, H. Lin, J. Xu, H. Chen, Z. Lin, F. Huang and Y. Wang, Inorg. Chem., 2015, 54, 11299–11306 CrossRef CAS PubMed.
- H. F. Li, W. Z. Sun, Y. L. Jia, T. F. Ma, J. P. Fu, D. Li, S. Zhang, L. H. Jiang, R. Pang and C. Y. Li, Chem. Asian J., 2015, 10, 2361–2367 CrossRef CAS PubMed.
- H. Li, R. Pang, S. Zhang, L. Lv, J. Feng, L. Jiang, D. Li, C. Li and H. Zhang, Dalton Trans., 2018, 47, 9814–9823 RSC.
- Y. Jin, Y. Hu, L. Chen, X. Wang, G. Ju and Z. Mu, J. Lumin., 2013, 138, 83–88 CrossRef CAS.
- W. M. Yen, S. Shionoya and H. Yamamoto, Phosphor Hand-book, CRC Press, 1995 Search PubMed.
- J. Trojan-Piegza, E. Zych, J. Hölsä and J. Niittykoski, J. Phys. Chem. C, 2009, 113, 20493–20498 CrossRef CAS.
- X. Dou, Y. Li, R. Kang, H. Lian and Z. Li, RSC Adv., 2020, 10, 17180–17184 RSC.
- Z. Li, H. Li and H.-T. Sun, J. Rare Earths, 2020, 38, 124–129 CrossRef CAS.
- J. Ma, Y. Chen, X. Wang, S. Cao and Q. Chen, Opt. Mater., 2018, 85, 86–90 CrossRef CAS.
- X. Zhou, G. Ju, Y. Li, Y. Jin, H. Wu and Y. Hu, Ceram. Int., 2018, 44, 18809–18816 CrossRef CAS.
- S. Zhang, Z. Mu, Y. Lv, L. Fan, Y. Li, G. Ju and Y. Hu, J. Alloys Compd., 2017, 729, 418–425 CrossRef CAS.
- X. Li, C. Liang, S. Guo, Y. Xiao and C. Chang, J. Lumin., 2017, 188, 199–203 CrossRef CAS.
- X. Fu, S. Zheng, J. Shi, Y. Li and H. Zhang, J. Lumin., 2017, 184, 199–204 CrossRef CAS.
- X. Li, D. Zhang, Y. Chen and C. Chang, Ceram. Int., 2017, 43, 1677–1681 CrossRef CAS.
- F. Xue, Y. Hu, G. Ju, L. Chen, M. He, T. Wang, Y. Jin, S. Zhang and J. Lin, Appl. Phys. A, 2016, 122, 612 CrossRef.
- F. Xue, Y. Hu, L. Chen, T. Wang and G. Ju, J. Mater. Sci.: Mater. Electron., 2016, 27, 8486–8492 CrossRef CAS.
- Y. Jin and Y. Hu, Mater. Res. Bull., 2015, 61, 16–21 CrossRef CAS.
- H. Wu, Y. Hu, F. Kang, L. Chen, X. Wang, G. Ju and Z. Mu, Mater. Res. Bull., 2011, 46, 2489–2493 CrossRef CAS.
- C. Liu, G. Che, Z. Xu and Q. Wang, J. Alloys Compd., 2009, 474, 250–253 CrossRef CAS.
- B. Liu, C. Shi and Z. Qi, J. Phys. Chem. Solids, 2006, 67, 1674–1677 CrossRef CAS.
- A. Nakatsuka, A. Yoshiasa and T. Yamanaka, Acta Crystallogr., Sect. B: Struct. Sci., 1999, 55, 266–272 CrossRef PubMed.
- M. Kottaisamy, P. Thiyagarajan, J. Mishra and M. S. Ramachandra Rao, Mater. Res. Bull., 2008, 43, 1657–1663 CrossRef CAS.
- K. Kamada, T. Yanagida, J. Pejchal, M. Nikl, T. Endo, K. Tsutumi, Y. Fujimoto, A. Fukabori and A. Yoshikawa, J. Phys. D: Appl. Phys., 2011, 44, 505104 CrossRef.
- B. H. Toby and R. B. Von Dreele, J. Appl. Crystallogr., 2013, 46, 544–549 CrossRef CAS.
- R. Shannon, Acta Crystallogr., Sect. A: Cryst. Phys., Diffr., Theor. Gen. Crystallogr., 1976, 32, 751–767 CrossRef.
- S. Zhang, C. Li, R. Pang, L. Jiang, L. Shi and Q. Su, J. Lumin., 2011, 131, 2730–2734 CrossRef CAS.
- S. Xia, T. Chen and C. Duan, J. Rare Earths, 2006, 24, 400–407 CrossRef.
- B. Zhang, S. Ying, L. Han, J. Zhang and B. Chen, RSC Adv., 2018, 8, 25378–25386 RSC.
- J. Xu, Z. Ju, X. Gao, Y. An, X. Tang and W. Liu, Inorg. Chem., 2013, 52, 13875–13881 CrossRef CAS PubMed.
- C. J. Delbecq, Y. Toyozawa and P. H. Yuster, Phys. Rev. B, 1974, 9, 4497–4505 CrossRef CAS.
- J. Trojan-Piegza, J. Niittykoski, J. Hölsä and E. Zych, Chem. Mater., 2008, 20, 2252–2261 CrossRef CAS.
- S. Schweizer, Phys. Status Solidi A, 2001, 187, 335–393 CrossRef CAS.
- S. W. S. McKeever, in Thermoluminescence of Solids, ed. S. W. S. McKeever, Cambridge University Press, Cambridge, 1985, p. Eq. (3.16) Search PubMed.
- T. Kinoshita and H. Hosono, J. Non-Cryst. Solids, 2000, 274, 257–263 CrossRef CAS.
- H. Hosono, N. Asada and Y. Abe, J. Appl. Phys., 1990, 67, 2840–2847 CrossRef CAS.
- T. Kinoshita, M. Yamazaki, H. Kawazoe and H. Hosono, J. Appl. Phys., 1999, 86, 3729–3733 CrossRef CAS.
- Z. Pan, Y. Y. Lu and F. Liu, Nat. Mater., 2011, 11, 58–63 CrossRef PubMed.
- F. Clabau, X. Rocquefelte, T. Le Mercier, P. Deniard, S. Jobic and M. H. Whangbo, Chem. Mater., 2006, 18, 3212–3220 CrossRef CAS.
- F. Clabau, X. Rocquefelte, S. Jobic, P. Deniard, M. H. Whangbo, A. Garcia and T. Le Mercier, Chem. Mater., 2005, 17, 3904–3912 CrossRef CAS.
- V. J. Emsley, Clarendon Press, Oxford, 1989, 1989.
- J. Sánchez-Benítez, A. de Andrés, M. Marchal, E. Cordoncillo, M. V. Regi and P. Escribano, J. Solid State Chem., 2003, 171, 273–277 CrossRef.
- H. Hosono, T. Kinoshita, H. Kawazoe, M. Yamazaki, Y. Yamamoto and N. Sawanobori, J. Phys.: Condens. Matter, 1998, 10, 9541–9547 CrossRef CAS.
Footnotes |
| † Electronic supplementary information (ESI) available. See DOI: 10.1039/d0ra02942d |
| ‡ These authors contributed equally. |
| This journal is © The Royal Society of Chemistry 2020 |

