 Open Access Article
Study on the properties of perovskite materials under light and different temperatures and electric fields based on DFT
Xin-Feng
Diao
 *abc,
Yan-lin
Tang
*a,
De-Yong
Xiong
b,
Ping-Rui
Wang
b,
Li-ke
Gao
a,
Tian-yu
Tang
a,
Xiao-Nan
Wei
a,
Hai-Rong
Zhang
b,
Xu-Pu wu
b and
Shen-Tong
Ji
b
aSchool of Physics, Guizhou University, Guiyang, 550025, China. E-mail: tylgzu@163.com; diaoxinfeng77@126.com
bSchool of Physics and Electronic Sciences, Guizhou Normal College, Guiyang 550018, China
cSchool of Big Data and Information Engineering, Guizhou University, Guiyang 550025, China
First published on 2nd June 2020
Abstract
The photoelectric conversion efficiency of perovskite solar cells has improved rapidly, but their stability is poor, which is an important factor that restricts their commercial production. This paper studies the physical and chemical stability of perovskite solar cells based on first principles. It is well known that methylamido lead iodide compounds and methylamino lead iodide compounds are easily degraded into NH2CH![[double bond, length as m-dash]](https://www.rsc.org/images/entities/char_e001.gif) NH2I, CH3NH3I and PbI2. First, the chemical stability of the above two perovskite-type solar cell materials is discussed by calculating the binding energy. Then, their phonon scattering lines, state density and thermodynamic properties are calculated and analyzed, and the work functions of different types of crystals along different planes such as [1 0 0], [0 1 0 0], [0 0 1] and [1 1 1] are calculated. The results show that the work function of the methylamine iodized lead compound is greater than that of the methylamidine iodized lead compound, which means that the electrons of the methylamidine iodized lead compound escape more easily and the carrier transfer efficiency is higher under the same conditions. Finally, the effects of different temperatures, different electric fields and light on the two kinds of crystal materials are analyzed. This provides theoretical guidance for us to improve the stability of perovskite materials experimentally.
NH2I, CH3NH3I and PbI2. First, the chemical stability of the above two perovskite-type solar cell materials is discussed by calculating the binding energy. Then, their phonon scattering lines, state density and thermodynamic properties are calculated and analyzed, and the work functions of different types of crystals along different planes such as [1 0 0], [0 1 0 0], [0 0 1] and [1 1 1] are calculated. The results show that the work function of the methylamine iodized lead compound is greater than that of the methylamidine iodized lead compound, which means that the electrons of the methylamidine iodized lead compound escape more easily and the carrier transfer efficiency is higher under the same conditions. Finally, the effects of different temperatures, different electric fields and light on the two kinds of crystal materials are analyzed. This provides theoretical guidance for us to improve the stability of perovskite materials experimentally.
1 Introduction
In recent years, the increasing demand for photovoltaic products has brought opportunities for new photovoltaic technologies. So far, the development of solar cells has gone through three generations: silicon-based cells, multi-component composite thin film cells, organic thin film solar cells and dye-sensitized solar cells. Perovskite solar cells (PSCs), as the third generation of solar cells, have attracted wide attention due to the continuous improvement of power conversion efficiency (PCE), low material cost and simple manufacturing process.1–6 PSC, which first appeared in 2009 with an efficiency of 3.8%, has achieved a laboratory-scale photoelectric conversion efficiency of 25.2%.7–10 Perovskite solar cells have a broad development prospect, but the main reason perovskite solar cells cannot be used on a large scale is the battery stability. At present, perovskite-type solar cells can only work for several months under active conditions, while conventional silicon cells can work for more than 25 years. How to improve the stability of perovskite batteries and make them as good as commercial polysilicon solar cells is the most important problem in the field of perovskite solar cells. The instability of organic–inorganic hybrid perovskite, such as the volatilization of organic cations in (MAPbI3)·CH3NH3PbI3 and (FAPbI3)·NH2CH![[double bond, length as m-dash]](https://www.rsc.org/images/entities/char_e001.gif) NH2PbI3 under thermal stress, has become a major limiting factor for its long-term practical application. Ze Wang etc.11 studied the effects of ambient temperature and humidity on the chemical stability of perovskites, and found that the degradation reaction CH3NH3PbI3 → CH3NH3I + PbI2 and CH3NH3I → CH3NH2 + HI would occur when MAPbI3 was exposed to light illumination and different temperatures. Nick Aristidou and his colleagues12 investigated the moisture stability mechanisms of perovskite solar cell materials in a mixture of water and oxygen. In fact, it is not known whether the iodine and hydrogen atoms in the perovskite materials are more readily dissociated to form PbI2 and HI ions. In this paper, the formation energy in the degradation reaction is calculated based on the first principle, which can help us analyze which dissociation reaction is easier to carry out. That's something you can't do experimentally. At the same time, the phonon dispersion spectrum, density of states and thermodynamic properties of the crystals are calculated and analyzed. The work functions of different types of crystals along different planes [1 0 0] [0 1 0][0 0 1] [1 1 1] are also calculated. Finally, the effects of different temperature, different electric field and light on the two kinds of crystal materials are analyzed. This provides theoretical guidance for us to improve the stability of perovskite materials experimentally.
NH2PbI3 under thermal stress, has become a major limiting factor for its long-term practical application. Ze Wang etc.11 studied the effects of ambient temperature and humidity on the chemical stability of perovskites, and found that the degradation reaction CH3NH3PbI3 → CH3NH3I + PbI2 and CH3NH3I → CH3NH2 + HI would occur when MAPbI3 was exposed to light illumination and different temperatures. Nick Aristidou and his colleagues12 investigated the moisture stability mechanisms of perovskite solar cell materials in a mixture of water and oxygen. In fact, it is not known whether the iodine and hydrogen atoms in the perovskite materials are more readily dissociated to form PbI2 and HI ions. In this paper, the formation energy in the degradation reaction is calculated based on the first principle, which can help us analyze which dissociation reaction is easier to carry out. That's something you can't do experimentally. At the same time, the phonon dispersion spectrum, density of states and thermodynamic properties of the crystals are calculated and analyzed. The work functions of different types of crystals along different planes [1 0 0] [0 1 0][0 0 1] [1 1 1] are also calculated. Finally, the effects of different temperature, different electric field and light on the two kinds of crystal materials are analyzed. This provides theoretical guidance for us to improve the stability of perovskite materials experimentally.
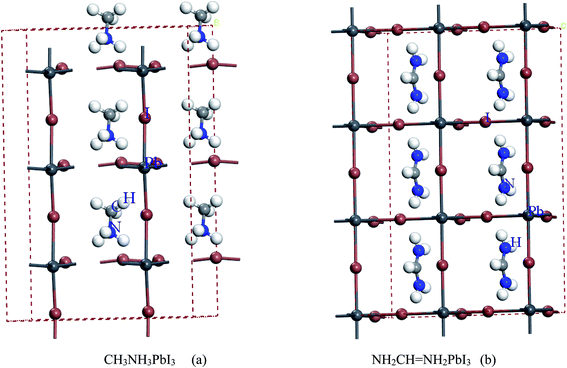
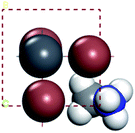
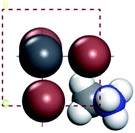
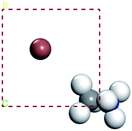
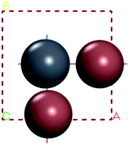
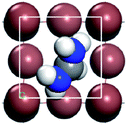
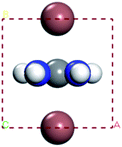
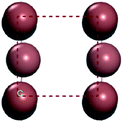
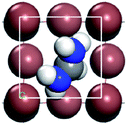
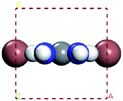
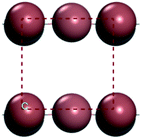
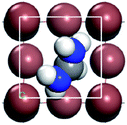
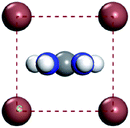
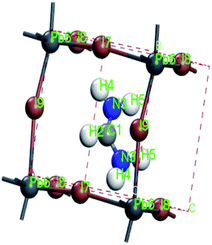
For convenient observation of crystal structure, we build the supercells of two crystals with 2 × 3 × 1 mesh which was shown as Fig. 1, and the lattice parameters are as following: (a) a = 12.58 Å, b = 18.69 Å, c = 6.37 Å, α = 90.00°, β = 88.74°, γ = 89.98°, (b) a = 12.82 Å, b = 19.01 Å, c = 6.27 Å, α = β = γ = 90°. Space group crystal system of two crystals are triclinic.
2 Computational methods
In this paper, two perovskite crystal materials NH2CH![[double bond, length as m-dash]](https://www.rsc.org/images/entities/char_e001.gif) NH2PbI3 and CH3NH3PbI3 were calculated based on DFT method, and the simulation package (CASTEP and Dmol3) was used to complete the calculation. The part from 3.1 to 3.4 in this paper is calculated by the CASTEP module.13–15 The exchange–correlation effects were still treated by Perdew–Burke–Ernzerh (PBE) of function in the generalized gradient approximation (GGA).16,17 The cut-off energy of plane wave basis set is 340 eV, and the SCF (self-consistent field) tolerance of the total energy change of each atom is set as 1 × 10⁻⁵ eV per atom. The maximum force of each atom is less than 0.01 eV Å−1 and the optimization is less than 0.0005 Å. The existence of tightly bound core electrons is represented by supersoft pseudopotential.18,19 The integral of Brillouin region is replaced by the discrete summation of a set of special K points using Monkhorst–pack scheme. And in the part 3.5, the study on the properties of applying electric field to crystals are calculated by Dmol3 package. And the details of the calculations were as follows: the exchange–correlation effects were treated by Generalized Gradient Approximation (GGA) version of Perdew–Wang-1991(PW91),20 and the basis set was 3.5 double numerical plus d-functions basis (DND), the qualities were selected as “fine”.
NH2PbI3 and CH3NH3PbI3 were calculated based on DFT method, and the simulation package (CASTEP and Dmol3) was used to complete the calculation. The part from 3.1 to 3.4 in this paper is calculated by the CASTEP module.13–15 The exchange–correlation effects were still treated by Perdew–Burke–Ernzerh (PBE) of function in the generalized gradient approximation (GGA).16,17 The cut-off energy of plane wave basis set is 340 eV, and the SCF (self-consistent field) tolerance of the total energy change of each atom is set as 1 × 10⁻⁵ eV per atom. The maximum force of each atom is less than 0.01 eV Å−1 and the optimization is less than 0.0005 Å. The existence of tightly bound core electrons is represented by supersoft pseudopotential.18,19 The integral of Brillouin region is replaced by the discrete summation of a set of special K points using Monkhorst–pack scheme. And in the part 3.5, the study on the properties of applying electric field to crystals are calculated by Dmol3 package. And the details of the calculations were as follows: the exchange–correlation effects were treated by Generalized Gradient Approximation (GGA) version of Perdew–Wang-1991(PW91),20 and the basis set was 3.5 double numerical plus d-functions basis (DND), the qualities were selected as “fine”.
3 Results and discussion
3.1. Thermal stability studies
With the improvement of the understanding of the instability of component materials under the conditions of humidity, heat, light and oxygen, more researches have been carried out on the long-term stability of perovskite materials.21–28 Perovskite materials degrade rapidly when exposed to humid environment.29–34 Our previous work35 has explored the structural stability of perovskite crystal and its adsorption properties for water molecules. Many papers36–39 reported that the perovskite materials CH3NH3PbI3 and NH2CH![[double bond, length as m-dash]](https://www.rsc.org/images/entities/char_e001.gif) NH2PbI3 will decompose into CH3NH2, NH2CH
NH2PbI3 will decompose into CH3NH2, NH2CH![[double bond, length as m-dash]](https://www.rsc.org/images/entities/char_e001.gif) NH, PbI2 and HI at above 150 °C. The decomposition of perovskite is the reverse reaction of perovskite formation, and the instability caused by humidity and heat generally exists in organic–inorganic hybrid perovskite. The current mixed perovskite is facing another challenge: they are unstable to light.40–44 The possible mechanism of decomposition on exposure to light is as follows
NH, PbI2 and HI at above 150 °C. The decomposition of perovskite is the reverse reaction of perovskite formation, and the instability caused by humidity and heat generally exists in organic–inorganic hybrid perovskite. The current mixed perovskite is facing another challenge: they are unstable to light.40–44 The possible mechanism of decomposition on exposure to light is as follows | (1) |
 | (2) |
In the superlattices of MAPbI3 and FAPbI3, there is one lead (Pb) atom, three iodine(I) atoms and one group. However, the dissociation energies of I atoms at different positions are not equal. We can use formation energy to express its stability. If the absolute value of crystal formation energy is small, it indicates that its stability is poor. The formula of formation energy can be written as follows:
| ΔE = ECH3NH3PbI3 − ECH3NH3I − EPbI2 | (3) |
It can be seen from Table 1 that CH3NH3PbI3 absorbing light and heat is decomposed into CH3NH2I and PbI2. The energy required to dissociate ions at different positions of the crystal is not equal, and its magnitude is −1.28 eV, −1.44 eV and −1.40 eV, respectively. The results show that the first form of degradation is more likely to occur. For NH2CH![[double bond, length as m-dash]](https://www.rsc.org/images/entities/char_e001.gif) NH2PbI3 crystal, the formation energy can be expressed as:
NH2PbI3 crystal, the formation energy can be expressed as:
| ΔE = ECH3NH3I − ECH3NH2 − EHI | (4) |
We know that NH2CH![[double bond, length as m-dash]](https://www.rsc.org/images/entities/char_e001.gif) NH2PbI3 absorbs energy to decomposed into NH2CH
NH2PbI3 absorbs energy to decomposed into NH2CH![[double bond, length as m-dash]](https://www.rsc.org/images/entities/char_e001.gif) NH2I and PbI2. The dissociation of I and Pb atoms at different locations requires different energies to form PbI2. The greater the absolute value of the energy required for dissociation, the more difficult the reaction. Table 2 shows that these three reaction formation energies are −1.28 eV, −0.95 eV and −1.53 eV, respectively. The result shows that the second form of degradation is easier to occur, while the third form of degradation is the most difficult.
NH2I and PbI2. The dissociation of I and Pb atoms at different locations requires different energies to form PbI2. The greater the absolute value of the energy required for dissociation, the more difficult the reaction. Table 2 shows that these three reaction formation energies are −1.28 eV, −0.95 eV and −1.53 eV, respectively. The result shows that the second form of degradation is easier to occur, while the third form of degradation is the most difficult.
![[double bond, length as m-dash]](https://www.rsc.org/images/entities/char_e001.gif) NH2PbI3
NH2PbI3
The possible mechanism of further decomposition on exposure to the environments of light illumination, different temperatures which is as follows11:
 | (5) |
 | (6) |
We further analyzed the dissociation energies required for ion separation at different sites to help us explore which chemical reactions are more likely to occur. The different hydrogen (H) and iodine (I) atoms in the crystal are labeled as follows. Consider the combination of hydrogen (H) ions and iodine (I) atoms in different positions to form HI as a product. The difficulty of this reaction is determined by calculating the formation energies of the reactants and products.
| ΔE = ECH3NH3I − ECH3NH2 − EHI or ΔE = ECH3NH3I − ECH2NH3 − EHI | (7) |
ΔE = ENH2CH![[double bond, length as m-dash]](https://www.rsc.org/images/entities/char_e001.gif) NH2I − ENH2CH NH2I − ENH2CH![[double bond, length as m-dash]](https://www.rsc.org/images/entities/char_e001.gif) NH − EHI or ΔE = ENH2CH NH − EHI or ΔE = ENH2CH![[double bond, length as m-dash]](https://www.rsc.org/images/entities/char_e001.gif) NH2I − ENH2C NH2I − ENH2C![[double bond, length as m-dash]](https://www.rsc.org/images/entities/char_e001.gif) NH2 − EHI NH2 − EHI | (8) |
![[double bond, length as m-dash]](https://www.rsc.org/images/entities/char_e001.gif) NH2I are the optimized energy of reactants, and ENH2CH
NH2I are the optimized energy of reactants, and ENH2CH![[double bond, length as m-dash]](https://www.rsc.org/images/entities/char_e001.gif) NH, ECH3NH2, EHI, are the optimized energy of products.
NH, ECH3NH2, EHI, are the optimized energy of products.
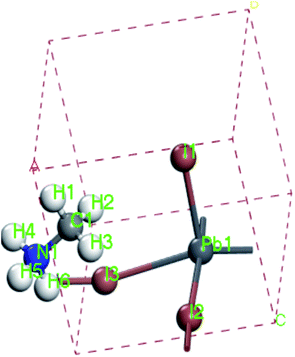
In this part, we can discuss the possibility of its further degradation reaction by calculating its formation energy, and the results shown in Tables 3 and 4. For convenience, we have numbered each atom in the crystal, as shown in left figure in the table. The superscript number of the element indicates the position number of the atom in the crystal, such as H1I1.
![[double bond, length as m-dash]](https://www.rsc.org/images/entities/char_e001.gif) NH2I
NH2I
The results show that the combination of H4, H5, and H6 with iodide (I) ions is unstable, and it is easier to decompose into H+ and I− ions. From the left figure of Table 3, it can be seen that the hydrogen atom at positions 4, 5 and 6 is outside the supercell. The HI formed by iodine is unstable. This kind of iodine amine compound is easier to dissociate and has poor stability. The font color in Table 3 is blue, indicating that the product HI is unstable. They are easy to generate as H2 and I2
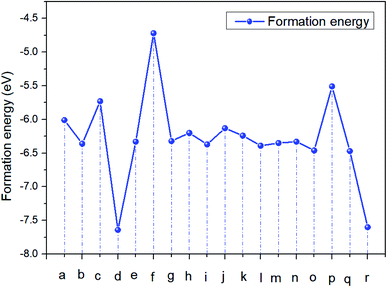
It can be seen from Fig. 2 this reaction of CH2NH3 + H2I3 is easier to carry out, and I2 and H2 gas will continue to be generated. And then the easier degraded reactions were (c) CH2NH3 + H1I3 and (p) CH3NH2 + H6I1.
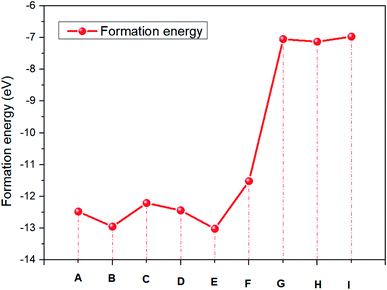
Compared with the energy required for various degradation reactions in Table 4, the energy required for further dissociation of amidine iodide is in the order of (I) < (G) < (H) < (F) < (C) < (D) < (A) < (B) < (E). The reactions of (G), (H) and (I) are more likely to occur. This result is even more obvious in Fig. 3. And the degradation reaction of eqn (6) is more difficult than that of eqn (5).
For convenience, we define eqn (1) and (2) as first-order degradation reactions and eqn (5) and (6) as second-order degradation reactions. It can be seen that the energy required for the primary degradation reaction is 1.56 eV, while the energy required for the secondary degradation reaction is greater than 6.24 eV, indicating that the secondary degradation reaction is more difficult than the primary degradation reaction.
3.2. Research on thermodynamic properties
In order to further study the stability of these two kinds of crystals, we optimized their phonon dispersion spectrum and distribution curve of phonon density of state, as shown in Fig. 4. First of all, the structure is optimized by using the CASTEP package, then the phonon dispersion spectrum, density of states and thermodynamic properties of two kinds of crystals are calculated and obtained.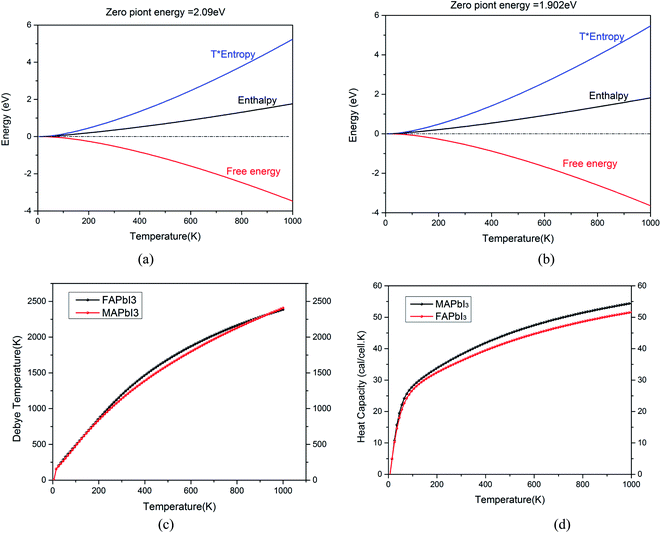 | ||
Fig. 4 (a) Thermodynamic properties of CH3NH3PbI3, (b) thermodynamic properties of NH2CH![[double bond, length as m-dash]](https://www.rsc.org/images/entities/char_e001.gif) NH2PbI3, (c) Debye temperature of two crystals, (d) heat capacity of two crystals. NH2PbI3, (c) Debye temperature of two crystals, (d) heat capacity of two crystals. | ||
In Fig. 4 (a) and (b), zero point energy of CH3NH3PbI3 is 2.09 eV, which is slightly larger than that of NH2CH![[double bond, length as m-dash]](https://www.rsc.org/images/entities/char_e001.gif) NH2PbI3 (1.902 eV). The free energy of the two crystals decreases with the increase of temperature. Their enthalpy increases with the increase of temperature. Fig. 4(c) shows that the Debye temperature corresponds to the highest frequency of lattice vibration. It is actually a characteristic quantity of the strongest bond between crystals. Which can reflect the size of the bonding force between atoms. The Debye temperature of different materials is different, the melting point is high, that is, the stronger the atomic bond of the material is, the higher the Debye temperature is. It can be seen from Fig. 4(d) that the change trend of the bond energy between atoms of the two crystals is basically the same with the increase of temperature. The binding capacity of NH2CH
NH2PbI3 (1.902 eV). The free energy of the two crystals decreases with the increase of temperature. Their enthalpy increases with the increase of temperature. Fig. 4(c) shows that the Debye temperature corresponds to the highest frequency of lattice vibration. It is actually a characteristic quantity of the strongest bond between crystals. Which can reflect the size of the bonding force between atoms. The Debye temperature of different materials is different, the melting point is high, that is, the stronger the atomic bond of the material is, the higher the Debye temperature is. It can be seen from Fig. 4(d) that the change trend of the bond energy between atoms of the two crystals is basically the same with the increase of temperature. The binding capacity of NH2CH![[double bond, length as m-dash]](https://www.rsc.org/images/entities/char_e001.gif) NH2PbI3 is slightly higher than CH3NH3PbI3. The heat capacity of NH2CH
NH2PbI3 is slightly higher than CH3NH3PbI3. The heat capacity of NH2CH![[double bond, length as m-dash]](https://www.rsc.org/images/entities/char_e001.gif) NH2PbI3 is lower than that of CH3NH3PbI3.
NH2PbI3 is lower than that of CH3NH3PbI3.
3.3. Phonon spectrum of crystals
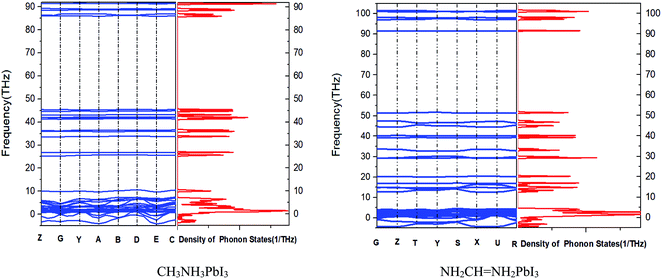
It can be inferred from Fig. 5 that CH3NH3PbI3 and NH2CH![[double bond, length as m-dash]](https://www.rsc.org/images/entities/char_e001.gif) NH2PbI3 are unstable because they have imaginary frequencies in the phonon spectrum, which is consistent with their small formation energy (see Tables 1 and 2). Also it tells us that phonon spectrum band gap of CH3NH3PbI3 is similar as that of NH2CH
NH2PbI3 are unstable because they have imaginary frequencies in the phonon spectrum, which is consistent with their small formation energy (see Tables 1 and 2). Also it tells us that phonon spectrum band gap of CH3NH3PbI3 is similar as that of NH2CH![[double bond, length as m-dash]](https://www.rsc.org/images/entities/char_e001.gif) NH2PbI3. However, the frequency of MAPbI3 is between 45 and 85 THz, and the frequency of FAPbI3 is between 52 and 92 THz. We know that with the decrease of the moment of inertia of the oscillator, the natural frequency of the oscillator will increase and the position frequency of the local resonance band gap will also increase. The position frequency of the local resonance band gap caused by the rotating oscillator is close to the fixed frequency of the oscillator. However, different from the linear displacement oscillator, with the decrease of the dimensionless mass, the band width shows an increasing trend. And rotational inertia of FAPbI3 is smaller than that of MAPbI3.
NH2PbI3. However, the frequency of MAPbI3 is between 45 and 85 THz, and the frequency of FAPbI3 is between 52 and 92 THz. We know that with the decrease of the moment of inertia of the oscillator, the natural frequency of the oscillator will increase and the position frequency of the local resonance band gap will also increase. The position frequency of the local resonance band gap caused by the rotating oscillator is close to the fixed frequency of the oscillator. However, different from the linear displacement oscillator, with the decrease of the dimensionless mass, the band width shows an increasing trend. And rotational inertia of FAPbI3 is smaller than that of MAPbI3.
3.4. Calculation of work function
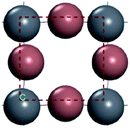
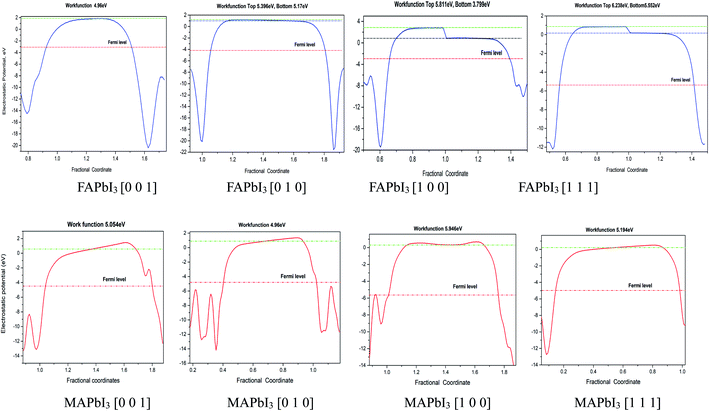
In our calculations, the metal slab is placed in the center of a cell and a 20 Å vacuum is introduced along the z direction. In the following, our approach to calculate the electrochemical potential and the total energy will be given in detail. In order to calculate the electrochemical potential (U) of a system, the following equations can be used according to the definition of absolute electrochemical potential. The work function reflects the minimum energy required for electrons to move from the interior of a solid to the surface of the object, , where EVAC is the energy of a static electron in a vacuum and EF is Fermi level. Since the work function W depends on the crystal structure and crystal orientation, the crystal structure of the bulk material should be optimized before the two-dimensional array is constructed. So we build two kinds of crystals along different surface [0 0 1][0 1 0][1 0 0][1 1 1]. And a vacuum layer with a thickness of 20 Å, fix the surface atoms, and optimize the crystal structure, then calculate the corresponding work function, as shown in the following Fig. 6:
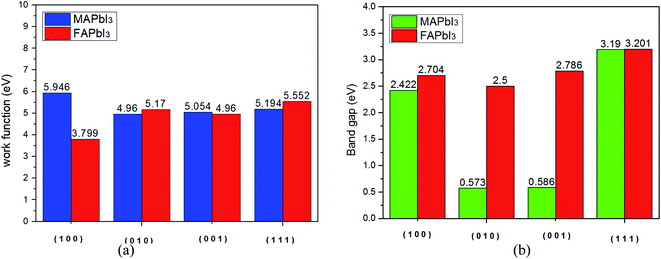
For comparison purposes, I constructed a vacuum layer (20 Å) for FAPbI3 and MAPbI3 crystal. In the calculation results of FAPbI3, the electrostatic energy values of the vacuum top electron and the vacuum bottom electron appear on the plane [1 0 0] and [1 1 1] respectively. Its operating function is between 5.811–3.799 eV and 6.238–5.552 eV. In MAPbI3, the work function has no obvious fluctuation, and the surface work function is 5.054 eV, 4.96 eV, 5.946 eV, 5.194 eV at surface [0 0 1], [0 1 0], [1 0 0], [1 1 1], respectively. Also we can find that the work function of MAPbI3 is greater than that of FAPbI3 for [1 0 0] plane, the work functions in other planes for FAPbI3 and MAPbI3 crystal are similar, as shown in the Fig. 7.
From Fig. 8(a), we find that the work function of FAPbI3 has a minimum value (3.799 eV) along the [1 0 0] plane, while the work function of MAPbI3 is the minimum value in the [0 1 0] plane. We further explored the changes of band gap on different cutting planes, which were [1 0 0], [0 1 0], [0 0 1], and [1 1 1], and calculated the corresponding band gap using CASTEP module. As can be seen from Fig. 8(b), the band gap of MAPbI3 varies greatly along different cleavage planes, while the band gap of FAPbI3 varies little.
3.5. Perovskite crystal stability at different temperatures
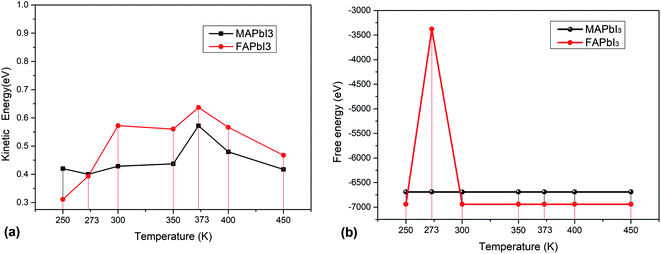
As solar cells, they are exposed to the sun all year round and their temperature varies greatly. It is necessary to analyze the influence of temperature on perovskite materials. We can now focus on the analysis of different environments (250 K, 273 K, 300 K 350 K, 373 K, 400 K, 450 K) to calculate their free energy and kinetic energy to analyze the change of crystal stability at different temperatures. The result shows as Fig. 9(a) and (b).For macroscopic systems such as crystals, the principle follows the lowest free energy F = U−TS, where U is the potential energy and TS is the kinetic energy. Fig. 10 tells us that MAPbI3 obtain the minimum kinetic energy at a temperature of 273 K (0 °C) and the maximum value at 373 K (100 °C). FAPbI3 also achieved a maximum at 373 K (100 °C). And FAPbI3 suddenly increased to −3379.80 eV at 273 K (0 °C), which means that the stability of this crystal decreased at 0 °C. The free energy for MAPbI3 does not change much at different temperatures.
3.6. Apply an electric field in different directions
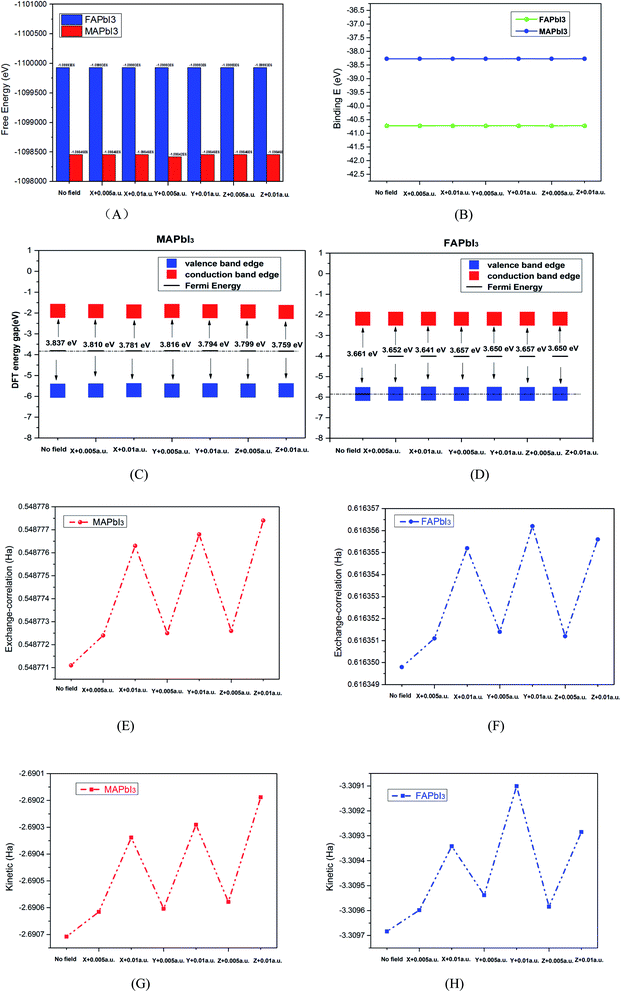
Perovskite solar cells always work at a certain voltage, so we discuss the effect of electric field on the crystal stability in different directions. Because the CASETP package of material Studio software cannot analyze the application electric field during calculation, but the Dmol3 package can apply an electric field to the bulk crystal. In this part, we use the Dmol3 package for calculation, and the parameter setting is described in part 2. After applying the electric field 0.005 a.u or 0.01 a.u. in the x, y and z directions, the corresponding free energy, bond energy, exchange energy, kinetic energy of the system molecule, Fermi energy level, conduction band and valence state are obtained (1 a.u. ≈ 5.14 × 10¹¹ V m−1).The calculation results are shown in Fig. 10(A–H). It can be seen from Fig. 10(A) that the system free energy of crystal FAPbI3 is higher than that of MAPbI3. Fig. 10(B) shows that the bond energy of FAPbI3 is lower than that of MAPbI3. Because the bonding energy is lower, its stability is relatively poor, and the naturally the free energy is high, which is consistent with the theory of solid physics. Fig. 10(E–H) shows that the free energy and bond energy of the electric field have little change after the application of the electric field, which means that the electric field has little influence on its stability. However, after the electric field is applied, its Fermi level position increases slightly, as shown in Fig. 10(C) and (D). The Fermi energy level increases with the increase of voltage. When the electric field is applied along the z-axis, the change is more obvious. From the point of view of molecular kinetic energy and exchange energy of the system, the energy increases significantly after the application of electric field, and increases with the increase of voltage.
4 Conclusion
In this paper, the stability of two important organic–inorganic perovskite solar cell materials, FAPbI3 and MAPbI3, under different light, temperature and electric field were studied in detail. Firstly, the chemical degradation reactions of the two organic–inorganic perovskite crystals materialwere studied under heat condition. Moreover, the photoactive layer of CH3NH3PbI3 and NH2CH
![[double bond, length as m-dash]](https://www.rsc.org/images/entities/char_e001.gif) NH2PbI3 can be rapidly decomposed into a Al2O3 mesoporous structures under light and drying conditions, generating products such as CH3NH2, NH2CH
NH2PbI3 can be rapidly decomposed into a Al2O3 mesoporous structures under light and drying conditions, generating products such as CH3NH2, NH2CH![[double bond, length as m-dash]](https://www.rsc.org/images/entities/char_e001.gif) NH2, HI and I2. Since iodine (I) atoms in different parts of the crystal need different energies to react with hydrogen, which reaction form is more likely to occur can be determined according to the energy required for the reaction. By calculating the formation energy, it is found that CH3NH3PbI3 is more likely to undergo the first type of degradation reaction, while NH2CH
NH2, HI and I2. Since iodine (I) atoms in different parts of the crystal need different energies to react with hydrogen, which reaction form is more likely to occur can be determined according to the energy required for the reaction. By calculating the formation energy, it is found that CH3NH3PbI3 is more likely to undergo the first type of degradation reaction, while NH2CH![[double bond, length as m-dash]](https://www.rsc.org/images/entities/char_e001.gif) NH2PbI3 is more likely to undergo the second type of degradation reaction. The above results cannot be specifically determined by experiments. Furthermore, 18 possible CH3NH3I degradation reactions and 9 possible NH2CH
NH2PbI3 is more likely to undergo the second type of degradation reaction. The above results cannot be specifically determined by experiments. Furthermore, 18 possible CH3NH3I degradation reactions and 9 possible NH2CH![[double bond, length as m-dash]](https://www.rsc.org/images/entities/char_e001.gif) NH2I degradation schemes were analyzed. The calculation results show that the hydrogen atoms H4, H5, and H6 are not stable in combination with iodine ions, and are easier decompose into H+ and I− ions. It can be seen from the figure that the reactions of (G), (H) and (I) are more likely to occur when the hydrogen atoms at positions 4, 5 and 6 are outside the supercell unit.
NH2I degradation schemes were analyzed. The calculation results show that the hydrogen atoms H4, H5, and H6 are not stable in combination with iodine ions, and are easier decompose into H+ and I− ions. It can be seen from the figure that the reactions of (G), (H) and (I) are more likely to occur when the hydrogen atoms at positions 4, 5 and 6 are outside the supercell unit.
Then, the phonon dispersion spectrum, thermodynamic properties, and work functions of the two crystals are discussed. The phonon dispersion curve shows that the moment of inertia of FAPbI3 is smaller than that of MAPbI3. The FAPbI3 system has the maximum free energy and kinetic energy at 373 K (100 °C), but the free energy of MAPbI3 does not change much at different temperatures. The free energy of FAPbI3 suddenly increases to −3379.80 eV at 273 K (0 °C), which means that it has the lowest temperature dependence at 0 °C. The work function of MAPbI3 is greater than that of FAPbI3 for [1 0 0] plane, which means that the electrons of FAPbI3 are easier to escape and its carrier transfer efficiency is higher with the same conditions. In other planes, the work functions of the two crystals are similar.
Finally, the stability of the two kinds of crystals under different temperature and electric field is discussed. The free energy of crystal FAPbI3 is higher than that of MAPbI3. When the electric field is applied, the free energy and bond energy of the two crystals do not change significantly, which means that the electric field has little influence on their stability. However, the molecular kinetic energy and exchange energy of the two crystalline materials increase obviously and increase with the increase of the voltage. This provides theoretical guidance for us to improve the stability of perovskite materials experimentally.
Conflicts of interest
There are no conflicts to declare.Acknowledgements
This work is supported by the National Natural Science Foundation of China Program (Grant No. 11164004), Guizhou Provincial Photonic Science and Technology Innovation team (Qianke Joint talents team [2015]4017), the Industrial Research Project of Guizhou Province (GY[2012]3060), the Growth Foundation for Young Scientists of Guizhou Provincial Department of Education (Grant no. QJH KY [2018]265), Special Laboratory Fund of Guizhou Education Department of Education (GY[2014]217), First class discipline education science construction project of Guizhou Education University [2019YLXK C05]References
- A. Kojima, K. Teshima, Y. Shirai and T. Miyasaka, Organometal Halide Perovskites as Visible-Light Sensitizers for Photovoltaic Cells, J. Am. Chem. Soc., 2009, 131(17), 6050–6051, DOI:10.1021/ja809598r.
- H. S. Kim, C. R. Lee, J. H. Im, K. B. Lee, T. Moehl and A. Marchioro, et al., Lead Iodide Perovskite Sensitized All-Solid-State Submicron Thin Film Mesoscopic Solar Cell with Efficiency Exceeding 9%, Sci. Rep., 2012, 2(1), 591, DOI:10.1038/srep00591.
- S. Alessandro, M. Igor and M. Joachim, Short-range ion dynamics in methylammonium lead iodide by multinuclear solid state NMR and 127 I NQR, Phys. Chem. Chem. Phys., 2018, 20(30), 20043–20055, 10.1039/C8CP01535J.
- M. M. Lee, J. Teuscher, T. Miyasaka, T. N. Murakami and H. J. Snaith, Efficient Hybrid Solar Cells Based on Meso-Superstructured Organometal Halide Perovskites, Science, 2012, 338(6107), 643–647 CrossRef CAS PubMed.
- J. F. Yang, X. M. Wen, H. Z. Xia, R. Sheng, Q. S. Ma, J. C. Jincheol Kim, P. Tapping, T. Harada, T. W. Kee, F. Z. Huang, Y. B. Cheng, M. Green, H. B. Anita, S. J. Huang, S. Shrestha, P. Robert and C. Gavin, A coustic-optical phonon up-conversion and hot-phonon bottleneck in lead-halide perovskites, Nat. Commun., 2017, 8, 14120, DOI:10.1038/ncomms14120.
- V. Roiati, S. Colella, G. Lerario, L. De Marco, A. Rizzo, A. Listorti and G. Gigli, Energy Environ. Investigating charge dynamics in halide perovskite-sensitized mesostructured solar cells, Energy Environ. Sci., 2014, 7, 1889–1894, 10.1039/C3EE43991G.
- P. Basera, M. Kumar, S. Saini and S. Bhattacharya, Reducing lead toxicity in the methylammonium lead halide MAPbI3:Why Sn substitution should be preferred to Pb vacancy for optimum solar cell efficiency, Phys. Rev. B, 2020, 101, 054108, DOI:10.1103/PhysRevB.101.054108.
- N. G. Park, M. Grätzel, T. Miyasaka, K. Zhu and K. Emery, Towards stable and commercially available perovskite solar cells, Nat. Energy, 2016, 1(11), 16152, DOI:10.1038/nenergy.2016.152.
- W. S. Yang, B. Park, E. H. Jung and N. J. Jeon, Iodide management in formamidinium-lead-halide-based perovskite layers for efficient solar cells, Science, 2017, 356, 1376–1379, DOI:10.1126/science.aan2301.
- National Renewable Energy Laboratory, Best Research-Cell Efficiencies, 2019, www.nrel.gov/pv/assets/pdfs/pv-efficiency-chart.20190103.pdf Search PubMed.
- Z. Wang, Z. J. Shi, T. T. Li, Y. H. Chen and W. Huang, Stability of Perovskite Solar Cells: A Prospective on the Substitution of the ACation and XAnion, Angew. Chem., 2016, 129(5), 1210–1233, DOI:10.1002/anie.201603694.
- N. Aristidou, C. Eames, M. S. Islam and S. A. Haque, Insights into the increased degradation rate of CH3NH3PbI3 solar cells in combined water and O2 environments, J. Mater. Chem. A, 2017, 5, 25469–25475, 10.1039/c7ta06841g.
- D. Vanderbilt, Soft self-consistent pseudopotentials in a generalized eigenvalue formalism, Phys. Rev. B: Condens. Matter Mater. Phys., 1990, 41, 7892–7895, DOI:10.1103/PhysRevB.41.7892.
- G. Giacomo, I. F. Jun and S. S. Hiroshi, Small Photocarrier Effective Masses Featuring Ambipolar Transport in Methylammonium Lead Iodide Perovskite: A Density Functional Analysis, J. Phys. Chem. Lett., 2013, 4, 4213–4216, DOI:10.1021/jz4023865.
- K. Kaasbjerg, K. S. Thygesen and K. W. Jacobsen, Phonon-limited mobility in n-type single-layer MoS2 from first principles, Phys. Rev. B: Condens. Matter Mater. Phys., 2012, 85, 115317, DOI:10.1103/physrevb.85.115317.
- M. D. Segall, P. J. D. Lindan, M. J. Probert, C. J. Pickard, P. J. Hasnip, S. J. Clark and M. C. Payne, First-principles simulation: ideas, illustrations and the CASTEP code, J. Phys.: Condens. Matter, 2002, 14, 2717–2744, DOI:10.1088/0953-8984/14/11/301.
- S. J. Clark, M. D. Segall, C. J. Pickard, P. J. Hasnip, M. I. J. Probert, K. Refson and M. C. Payne, First principles methods using CASTEP, Z. Kristallogr., 2005, 220, 567–570, DOI:10.1524/zkri.220.5.567.65075.
- J. P. Perdew, K. Burke and M. Ernzerhof, Generalized Gradient Approximation Made Simple, Phys. Rev. Lett., 1996, 77, 3865–3868, DOI:10.1103/PhysRevLett.77.3865.
- H. J. Monkhorst and J. D. Pack, Special points for Brillouin-zone integrations, Phys. Rev. B, 1976, 13, 5188–5192, DOI:10.1103/PhysRevB.13.5188.
- X. F. Diao, Y. L. Tang, Q. Xie, D. L. Chen, S. X. Li and G. F. Liu, Study on the Property of Electron-Transport Layer in the Doped Formamidinium Lead Iodide Perovskite Based on DFT, ACS Omega, 2019, 4, 20024–20035, DOI:10.1021/acsomega.9b03015.
- P. Docampo and T. Bein, A Long-Term View on Perovskite Optoelectronics, Acc. Chem. Res., 2016, 49, 339–346, DOI:10.1021/acs.accounts.5b00465.
- Y. Rong, L. Liu, A. Mei, X. Li and H. Han, Beyond Efficiency: the Challenge of Stability in Mesoscopic Perovskite Solar Cells, Adv. Energy Mater., 2015, 5, 1501066, DOI:10.1002/aenm.201501066.
- T. Leijtens, G. E. Eperon, N. K. Noel, S. N. Habisreutinger, A. Petrozza and H. J. Snaith, Stability of Metal Halide Perovskite Solar Cells, Adv. Energy Mater., 2015, 5, 1500963, DOI:10.1002/aenm.201500963.
- T. A. Berhe, W. Su, C. Chen, C. Pan, J. Cheng, H. Chen, M. Tsai, L. Chen, A. A. Dubale and B. Hwang, Organometal halide perovskite solar cells: degradation and stability, Energy Environ. Sci., 2016, 9, 323–356, 10.1039/C5EE02733K.
- M. Ye, X. Hong, F. Zhang and X. Liu, Recent advancements in perovskite solar cells: flexibility, stability and large scale, J. Mater. Chem. A, 2016, 4, 6755–6771, 10.1039/C5TA09661H.
- N. H. Tiep, Z. L. Ku and H. J. Fan, Recent advances in improving the stability of perovskite solar cells, Adv. Energy Mater., 2016, 6, 1501420, DOI:10.1002/aenm.201501420.
- F. Brivio, J. M. Frost, J. M. Skelton, A. J. Jackson, O. J. Weber, M. T. Weller, A. R. Goni, A. M. A. Leguy, P. R. F. Barnes and A. Walsh, Lattice dynamics and vibrational spectra of the orthorhombic, tetragonal, and cubic phases of methylammonium lead iodide, Phys. Rev. B: Condens. Matter Mater. Phys., 2015, 92, 144308, DOI:10.1103/PhysRevB.92.144308.
- B. Li, Y. Li, C. Zheng, D. Gao and W. Huang, Advancements in the stability of perovskite solar cells: degradation mechanisms and improvement approaches, RSC Adv., 2016, 6, 38079–38091 RSC.
- J. H. Noh, S. H. Im, J. H. Heo, T. N. Mandal and S. II Seok, Chemical Management for Colorful, Efficient, and Stable Inorganic–Organic Hybrid Nanostructured Solar Cells, Nano Lett., 2013, 13, 1764–1769, DOI:10.1021/nl400349b.
- G. Niu, W. Li, F. Meng, L. Wang, H. Dong and Y. Qiu, Study on the stability of CH3NH3PbI3 films and the effect of post-modification by aluminum oxide in all-solid-state hybrid solar cells, J. Mater. Chem. A, 2014, 2, 705–710, 10.1039/C3TA13606J.
- C. Clegg and I. G. Hill, Systematic study on the impact of water on the performance and stability of perovskite solar cells, RSC Adv., 2016, 6, 52448–52458, 10.1039/C6RA11379F.
- Y. Zhang, P. P. Heng, H. S. Su, J. F. Li, J. Guo, P. Ning, W. P. Wu, T. G. Ren, L. Wang and J. L. Zhang, Star-Shaped Molecules as Dopant-Free Hole Transporting Materials for Efficient Perovskite Solar Cells: Multiscale Simulation Chem, Rec, 2019, 19, 938–946, DOI:10.1002/tcr.201800150.
- W. Y. Zhang, L. Wang, L. M. Mao, J. M. Jiang, H. H. Ren, P. P. Heng, H. A. Ågren and J. L. Zhang, Computational Protocol for Precise Prediction of Dye-Sensitized Solar Cell Performance, J. Phys. Chem. C, 2020, 124, 3980–31, DOI:10.1021/acs.jpcc.9b10869.
- Y. Zhang, J. Guo, H. S. Su, J. F. Li, W. P. Wu and L. Wang, A rational design of hole-transport small molecules based on fluorene with different modified groups for organic lead-halide perovskite solar cells, Dyes Pigm., 2018, 154, 275–281, DOI:10.1016/j.dyepig.2018.03.019.
- X. F. Diao, Y. L. Tang, T. Y. Tang, Q. Xie, K. Xiang and G. F. Liu, Study on the stability of organic–inorganic perovskite solar cell materials based on first principle, Mol. Phys., 2019, e1665200, DOI:10.1080/00268976.2019.1665200.
- B. Conings, J. Drijkoningen, N. Gauquelin, A. Babayigit, J. D'Haen, L. D'Olieslaeger, A. Ethirajan, J. Verbeeck, J. Manca, E. Mosconi, F. De Angelis and H. Boyen, Intrinsic Thermal Instability of Methylammonium Lead Trihalide Perovskite, Adv. Energy Mater., 2015, 5, 1500477, DOI:10.1002/aenm.201500477.
- Y. Dkhissi, S. Meyer, D. Chen, H. C. Weerasinghe, L. Spiccia, Y. Cheng and R. A. Caruso, Stability Comparison of Perovskite Solar Cells Based on Zinc Oxide and Titania on Polymer Substrates, ChemSusChem, 2016, 9, 687–695, DOI:10.1002/cssc.201501659.
- J. H. Heo, S. H. Im, J. H. Noh, T. N. Mandal, C. Lim, J. A. Chang, Y. H. Lee, H. Kim, A. Sarkar, M. K. Nazeeruddin, M. Graetzel and S. I. Seok, Efficient inorganic-organic hybrid heterojunction solar cells containing perovskite compound and polymeric hole conductors, Nat. Photonics, 2013, 7, 487–492, DOI:10.1038/nphoton.2013.80.
- G. Divitini, S. Cacovich, F. Matteocci, L. Cin, A. Di Carlo and C. Ducati, In situ observation of heat-induced degradation of perovskite solar cells, Nat. Energy, 2016, 1, 15012, DOI:10.1038/NENERGY.2015.12.
- D. Bryant, N. Aristidou, S. Pont, I. Sanchez-Molina, T. Chotchunangatchaval, S. Wheeler, J. R. Durrant and S. A. Haque, Light and oxygen induced degradation limits the operational stability of methylammonium lead triiodide perovskite solar cells, Energy Environ. Sci., 2016, 9, 1655–1660, 10.1039/C6EE00409A.
- H. Yuan, E. Debroye, K. Janssen, H. Naiki, C. Steuwe, G. Lu, M. Moris, E. Orgiu, H. Uji-i, F. De Schryver, P. Samori, J. Hofkens and M. Roeffaers, Degradation of Methylammonium Lead Iodide Perovskite Structures through Light and Electron Beam Driven Ion Migration, J. Phys. Chem. Lett., 2016, 7, 561–566, DOI:10.1021/acs.jpclett.5b02828.
- T. Leijtens, G. E. Eperon, S. Pathak, A. Abate, M. M. Lee and H. J. Snaith, Overcoming ultraviolet light instability of sensitized TiO2 with meso-superstructured organometal tri-halide perovskite solar cells, Nat. Commun., 2013, 4, 2885, DOI:10.1038/ncomms3885.
- S. Ito, S. Tanaka, K. Manabe and H. Nishino, Effects of Surface Blocking Layer of Sb2S3 on Nanocrystalline TiO2 for CH3NH3PbI3 Perovskite Solar Cells, J. Phys. Chem. C, 2014, 118, 16995–17000, DOI:10.1021/jp500449z.
- D. Wei, T. Wang, J. Ji, M. Li, P. Cui, Y. Li, G. Li, J. M. Mbengue and D. Song, Photo-induced degradation of lead halide perovskite solar cells caused by the hole transport layer/metal electrode interface, J. Mater. Chem. A, 2016, 4, 1991–1998, 10.1039/C5TA08622A.
| This journal is © The Royal Society of Chemistry 2020 |

