DOI:
10.1039/D0RA02501A
(Paper)
RSC Adv., 2020,
10, 20837-20851
Synthesis, X-ray crystal structure elucidation and Hirshfeld surface analysis of N-((4-(1H-benzo[d]imidazole-2-yl)phenyl)carbamothioyl)benzamide: investigations for elastase inhibition, antioxidant and DNA binding potentials for biological applications†
Received
18th March 2020
, Accepted 27th May 2020
First published on 2nd June 2020
Abstract
The interest in the present study pertains to the development of a new compound based upon a benzimidazole thiourea moiety that has unique properties related to elastase inhibition, free radical scavenging activity and its DNA binding ability. The title compound, N-(4-(1H-benzo[d]imidazol-2-yl)phenyl)-3-benzoyl thiourea (C21H18N4O2SH2O:TUBC), was synthesized by reacting an acid chloride of benzoic acid with potassium thiocyanate (KSCN) along with the subsequent addition of 4-(1H-benzo[d]imidazol-2-yl)benzenamine via a one-pot three-step procedure. The structure of the resulting benzimidazole based thiourea was confirmed by spectroscopic techniques including FTIR, 1H-NMR, 13C-NMR and single crystal X-ray diffraction and further examined by Hirshfeld surface analysis. TUBC was also investigated by using both in silico methodology including molecular docking for elastase inhibition along with quantum chemical studies and in vitro experimental methodology utilizing elastase inhibition and free radical scavenging assay along with DNA binding experiments. Docking results confirmed that TUBC binding was within the active region of elastase. In comparison to the reference drug oleanolic acid, the low IC50 value of TUBC also indicated its high tendency towards elastase inhibition. TUBC scavenged 80% of DPPH˙ radicals which pointed towards its promising antioxidant activity. TUBC–DNA binding by DFT, docking, UV-visible spectroscopy and viscosity measurements revealed TUBC to be a potential drug candidate that binds spontaneously and reversibly with DNA via a mixed binding mode. All theoretical and experimental findings pointed to TUBC as a potential candidate for a variety of biological applications.
1 Introduction
The thiourea nucleus is quite distinctive in its reactivity and a very predominant functional group in the field of synthetic organic chemistry.1 Thioureas have been evaluated over the last four decades and a variety of derivatives having a wide range of biological, agricultural and pharmaceutical applications have been reported.2 Among all of these, thioureas exhibit antiviral,3 antibacterial,4 antitubercular,5 antiproliferative,6 antioxidant,7 anticancer,8 neuroprotection,9 antidepressant,10 appetite suppressant,11 antiproliferative,12 cytotoxic,13 antimalarial,14 anti-HIV,15 anti-inflammatory,16 and antiallergic17 activities.
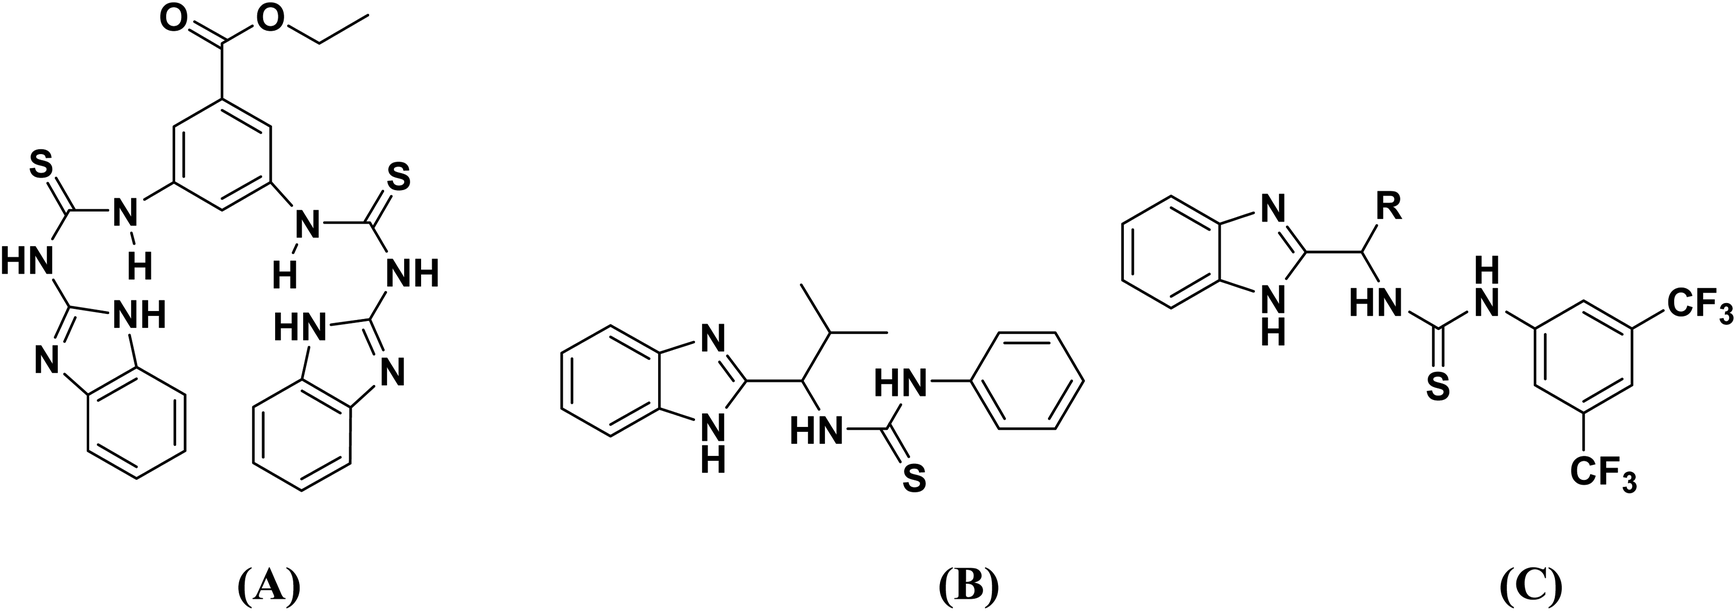
Moreover, the presence of imidazole and benzamide moieties play essential roles for the synthesis of various metal complexes.18,19 In the thiourea structure, nitrogen atoms of imidazole, whereas the nitrogen and carbonyl oxygen atoms of the benzamide moiety provide a platform by acting as chelating ligands to form complexes of transition metal ions. Biological activities of the benzimidazole functionalized thioureas have been studied extensively.20 Benzimidazole and thiourea conjugated fluorescent hybrid receptors as shown in Fig. 1 have been reported for the selective recognition of a phosphate ion even in the presence of other anions.21 Chiral benzimidazole functionalized thioureas were synthesized and tested for antibacterial and anticancer activities,22 Fig. 1. Carbonic anhydrase inhibition was also carried out by the use of benzimidazole based thioureas23 as revealed in Fig. 1.
 |
| | Fig. 1 Structures of benzimidazole and thiourea conjugated fluorescent hybrid receptor (A), anti-bacterial agent (B) and carbonic anhydrase inhibitors (C). | |
Keeping in view the importance of benzimidazole functionalized thioureas, in the current scenario, we have synthesized a novel benzimidazole based acyl thiourea. We believe that the extensive studies on this novel molecule will catch the attention of the scientific community especially since it will be of great interest for those who have an interest in heterocyclic organic synthesis with extensive biological applications and particularly for supramolecular systems. X-ray single crystal, Hirshfeld surface analysis, elastase inhibition, free radical scavenging activity, and DNA binding studies have been carried out here to highlight the incredible characteristics of the target compound, TUBC.
2 Experimental
2.1 Materials and methods
All chemical and reagents are of analytical grade and purchased from Sigma-Aldrich. Synthesis of the title compound was monitored on silica gel plates (aluminum pre-coated Kiesel 60 F254) and an Rf value was calculated. In DNA binding experiments, a stock solution of the synthesized compound (TUBC) was prepared in 10% aqueous DMSO, while a stock solution of fish salmon-DNA (FS-ds-DNA) (Sigma-Aldrich) was prepared in double deionized water. DNA purity was confirmed with the help of a UV-visible spectrophotometer. The absorbance ratio A260/A280 was evaluated as 1.813 which assured the DNA purity.24 The DNA concentration was found to be 1.59 × 10⁻⁴ M by using the values of absorbance at 260 nm, and a molar extention coefficient (ε) 6600 cm−1 M−1 in Beer's equation, while keeping the path length constant at 1 cm.
2.2 Instrumentations
A Gallenkamp melting point apparatus (MP-D) was used to determine the melting point through an open capillary method. FTIR analysis was performed using a Bruker FT-IR Bio-Rad-Excalibur Series Mode No. FTS 300 MX spectrometer. The 1H NMR and 13C NMR spectra were recorded on a Bruker 300 MHz NMR spectrometer in deuterated DMSO and CDCl3 solutions with tetramethylsilane (TMS) as an internal reference. HPLC-MS analysis was achieved by an LC Agilent system 1200 series instrument and the elemental analyses were conducted using an LECO-183 CHNS analyzer. A UV-visible spectrophotometer (Shimadzu-1800; TCC-240, Japan), with temperature controller to maintain a required temperature of the sample (in quartz cuvette) and an automated Schott Gerate digital viscometer (Model; AVS 310) were used for DNA binding experiments.
2.3 Synthesis procedure for N-(4-(1H-benzo[d]imidazol-2-yl)phenyl)-3-benzoylthiourea – TUBC
The new thiourea derivative (TUBC) was synthesized using different chain length acid chlorides that produced their respective isothiocyanates. The acid chloride (5.0 mmol) in anhydrous acetone (50 mL) was added dropwise to the suspension of potassium thiocyanate (10.0 mmol) in acetone (25 mL) at room temperature. The reaction mixture was cooled to room temperature. A solution of 4-(1H-benzo[d]imidazol-2-yl)benzenamine (5.0 mmol) in anhydrous acetone was added dropwise and the reaction mixture was further refluxed for 2–3 hours (Scheme 1). The progress of the reaction was monitored through TLC. On completion, the mixture was poured into cold water and the solid precipitates of title molecule were filtered and recrystallized from ethanol.
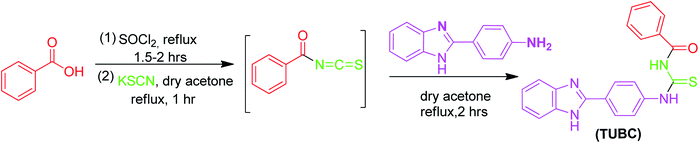 |
| | Scheme 1 Synthesis of TUBC, C21H18N4O2S·H2O. | |
2.4 Characterization data
Yellow solid; yield: 72%; Rf: 0.63; mp: 235 °C; FTIR (cm−1): 3050 (Sp2C–H), 1680 (C![[double bond, length as m-dash]](https://www.rsc.org/images/entities/char_e001.gif) O), 1620 (CN), 1241 (CS), 3350 (N–H), Ar CC(1550); 1H NMR: (DMSO-d6, 300 MHz); δ = 12.79 (s, 1H, NH, D2O exchangeable), 11.66 (s, 1H, NH, D2O exchangeable), 10.98 (s, 1H, NH, D2O exchangeable), 8.23–7.70 (m, J = 8.4 5H, Ar–H), 7.92 (d, J = 8.4 Hz, 2H, Ar–H), 7.68 (d, J = 7.1 Hz, 2H, Ar–H), 7.24 (d, J = 7.2 Hz, 2H, Ar–H), 7.10 (d, J = 8.1 Hz, 2H, Ar–H); 13C NMR: (DMSO-d6, 75 MHz); 179.34, 168.75, 151.15, 139.76, 133.67, 132.58, 129.20, 128.94, 128.23, 127.26, 124.75, 122.65. Anal. calcd for C21H16N4OS: C, 67.72; H, 4.33; N, 15.04; S, 8.61 found: C, 67.50; H, 4.53; N, 15.00; S, 8.63.
O), 1620 (CN), 1241 (CS), 3350 (N–H), Ar CC(1550); 1H NMR: (DMSO-d6, 300 MHz); δ = 12.79 (s, 1H, NH, D2O exchangeable), 11.66 (s, 1H, NH, D2O exchangeable), 10.98 (s, 1H, NH, D2O exchangeable), 8.23–7.70 (m, J = 8.4 5H, Ar–H), 7.92 (d, J = 8.4 Hz, 2H, Ar–H), 7.68 (d, J = 7.1 Hz, 2H, Ar–H), 7.24 (d, J = 7.2 Hz, 2H, Ar–H), 7.10 (d, J = 8.1 Hz, 2H, Ar–H); 13C NMR: (DMSO-d6, 75 MHz); 179.34, 168.75, 151.15, 139.76, 133.67, 132.58, 129.20, 128.94, 128.23, 127.26, 124.75, 122.65. Anal. calcd for C21H16N4OS: C, 67.72; H, 4.33; N, 15.04; S, 8.61 found: C, 67.50; H, 4.53; N, 15.00; S, 8.63.
2.5 X-ray data collection and structure refinement
Crystallographic data were recorded on a Rigaku Oxford Diffraction Eos CCD diffractometer using Mo Kα radiation (λ = 0.71073 Å) at T = 173(2) K. Multi-scan [empirical absorption correction using spherical harmonics, implemented in SCALE3 ABSPACK scaling algorithm CrysAlisPro 1.171.38.46] was applied.25 The structure was solved by direct methods and refined by full-matrix least squares against F2 using all data (SHELXT and SHELXL).26 All non-H atoms were refined anisotropically. The O-, N- and C-bound H atoms were positioned geometrically, with O–H = 0.87 Å (for water OH), N–H = 0.88 Å (for NH) and C–H = 0.95 Å (for aromatic CH), and constrained to ride on their parent atoms with Uiso(H) = k × Ueq(O, N, C), where k = 1.5 for OH hydrogen atoms and k = 1.2 for all other H atoms. Full crystallographic data for compound TUBC have been deposited with the Cambridge Crystallographic Data Centre (CCDC # 1986282).†
2.6 Hirshfeld surface calculations
The Hirshfeld surface (HS) analysis was carried out by employing Crystal Explorer program 17.5.27 The structural input file was obtained in the CIF format. The Hirshfeld surface distance from the nearest nucleus inside and outside the surface was measured and represented by di and de, respectively, while a normalized contact distance was represented as dnorm. White, red and blue colors have been selected for the visualization of dnorm.
2.7 In silico methodology
2.7.1 Molecular docking for elastase inhibition. The crystal structure of porcine pancreatic elastase was accessed from the Protein Data Bank (PDB) (www.rcsb.org) with PDBID 7EST. The retrieved target protein structure was minimized by using UCSF Chimera 1.6rctool.28 The stereochemical properties of elastase and a Ramachandran plot and values were also accessed from the PDB. A hydrophobicity graph of the target protein was generated by Discovery Studio 4.1 Client.29 The synthesized chemical structure of TUBC was sketched in ACD/ChemSketch and minimized by UCSF Chimera 1.6rctool. The PyRx docking tool was employed to perform the molecular docking experiment.30 The grid box center values of (center_x = 4.5741, center_y = 56.7946 and center_z = −5.5085) and size values for all three coordinates were adjusted as (size_x = 53.2441, size_y = 43.0418 and size_z = 49.3944). The default exhaustiveness value = 8 was used to maximize the binding conformational analysis of ligands within the active region of target protein. Docking analysis was done on the basis of lowest binding energy (kcal mol−1) values and structure activity relationship (SAR) analyses. The three dimensional (3D) graphical depiction was accomplished by Discovery Studio (2.1.0).
2.7.2 Quantum chemical studies. Quantum chemical calculations were carried out on the ground state for the molecule using crystal structure data as the starting geometry and using Gaussian 09 software with WebMo Pro employed for graphics visualization.31,32 The TUBC compound was optimized for the hybrid B3LYP functional with the 6-31+G(d) basis set. In the electronic structure DFT method, the B3LYP functional has attained popularity and shows tremendous reliability for structural properties of synthetic and natural products due to its efficient balance between computational cost and accuracy.33
2.7.3 Molecular docking for DNA binding. The Molecular Operating Environment (MOE 2017: Chemical computing Inc.) tool was employed to sketch and optimize the structure of TUBC compound at the MOPAC 7.0 level of theory. Structures were sketched using the molecular builder of the MOE suite and fetched into the database after geometry relaxation. The X-ray crystallographic structure of DNA possessing PDB ID: 1QTI and resolution of 2.7 Å was downloaded from the Protein Data Bank.34 1QTI was protonated and optimized expending a protonate-3D menu. Water molecules attached with the base pairs of 1QTI were removed. For the purpose of docking analysis, coordinates of 1QTI were relaxed using the AMBER Forcefield and semiempirical PM3 approaches. Relaxed coordinates had the minimum energy and a stable conformation for best scoring function calculations. The TUBC optimized structure was subjected to methodical molecular docking taking DNA as a receptor at default parameters with an RMS gradient of 0.01 kcal mol−1 using Site Finder to find out the active sites of 1QTI. A number of docking runs were completed to attain the final docking poses as perfect as possible. At each step of the simulation, the energy of the interaction of TUBC with 1QTI was determined. The remaining parameters were kept as a default.35
2.8 In vitro experimental methodology
2.8.1 Elastase inhibition assay. The elastase (elastase from porcine pancreas – Sigma Aldrich) inhibition activity was performed following an already reported method with some modifications.36–38 In order to perform the inhibition of elastase activity, the amount of released p-nitroaniline, which was hydrolyzed from the substrate (N-succinyl-Ala-Ala-Ala-p-nitroanilide) by elastase, was determined by measuring the absorbance at 410 nm. In detail, 0.8 mM solution of N-succinyl-Ala-Ala-Ala-p-nitroanilide was prepared in a 0.2 M Tris–HCl buffer (pH 8.0) and this buffer (130 μL) was added to the test sample (10 μL) in a 96 well microplate.39 The microplate was pre-incubated for 10 min at 25 °C before an elastase (0.0375 unit per mL) stock solution (10 μL) was added. After enzyme addition, the microplate was kept at 25 °C for 30 min, and the absorbance was measured at 410 nm using a microplate reader. All experiments were carried out in triplicate.
2.8.2 Free radical scavenging assay. Radical scavenging activity was determined by modifying an already reported method by 2,2-diphenyl-1 picrylhydrazyl (DPPH) assay.40,41 The assay solution consisted of 100 μL of DPPH (150 μM), 20 μL of increasing concentration of test compounds and the volume was adjusted to 200 μL in each well with methanol. The reaction mixture was then incubated for 30 minutes at room temperature. Ascorbic acid (Vitamin C) was used as a reference inhibitor. The assay measurements were carried out by using a microplate reader (OPTIMax, Tunable) at 517 nm. The reaction rates were compared, and the percent inhibition caused by the presence of tested inhibitors was calculated. Each concentration was analyzed in three independent experiments run in triplicate.
2.8.3 DNA binding experiments. UV-visible spectroscopic titrations for TUBC were performed by adding increasing concentrations of DNA (10–80 μM) in an optimized concentration (2.34 × 10⁻⁴ M). The sample solution was allowed to stay within the cuvette for at least five minutes so that an equilibrium between the compound and DNA could be maintained at the desired temperature of 37 °C. Viscosity measurements were carried out to observe the structral changes in the DNA duplex in the presence of the titled compound. The viscosity of 10 μM DNA (ηo) was measured on a digital viscometer and then small changes in DNA viscosity (η) were noted upon addition of TUBC from 10 to 110 μM. Experimental conditions were set similar as for the spectroscopic experiments.
3 Results and discussion
3.1 Chemistry
FT-IR analysis show characteristic absorption bands for N–H at 3215–3350 cm−1, C–H aromatic at 3033–3080 cm−1, CO of carbonyl at 1680–1748 cm−1, CN of imine at 1542–1694 cm−1 and CC (Ar) 1532–1575 cm−1. The 1H NMR spectrum of the title compound involved three characteristic broad singlets for a N–H proton which appeared at δ 12.79, 11.66 ppm, 10.98 ppm, and characteristic 2H doublets of 1,4-disubstitued phenyl ring protons appeared at δ 7.92 and 7.10 ppm respectively, whilst doublets for two phenyl ring protons of benzimidazole appeared at δ 7.68 and 7.24 ppm. The aromatic protons of benzoyl ring gave the most deshielded multiplet at δ 8.23–7.70 ppm. All of these signals suggest the formation of the target compound. In the 13C NMR spectrum signals for carbon (CS) appeared at δ 179.34 ppm, a signal for carbonyl carbon was shown at δ 168.75 ppm, and signal for imine carbon appeared at δ 151.15 ppm. All these signals propose the formation of the desired compound. 1H NMR and 13C NMR spectra are provided as Fig. S1 and S2 (in the ESI†).
3.2 Description of crystal structure
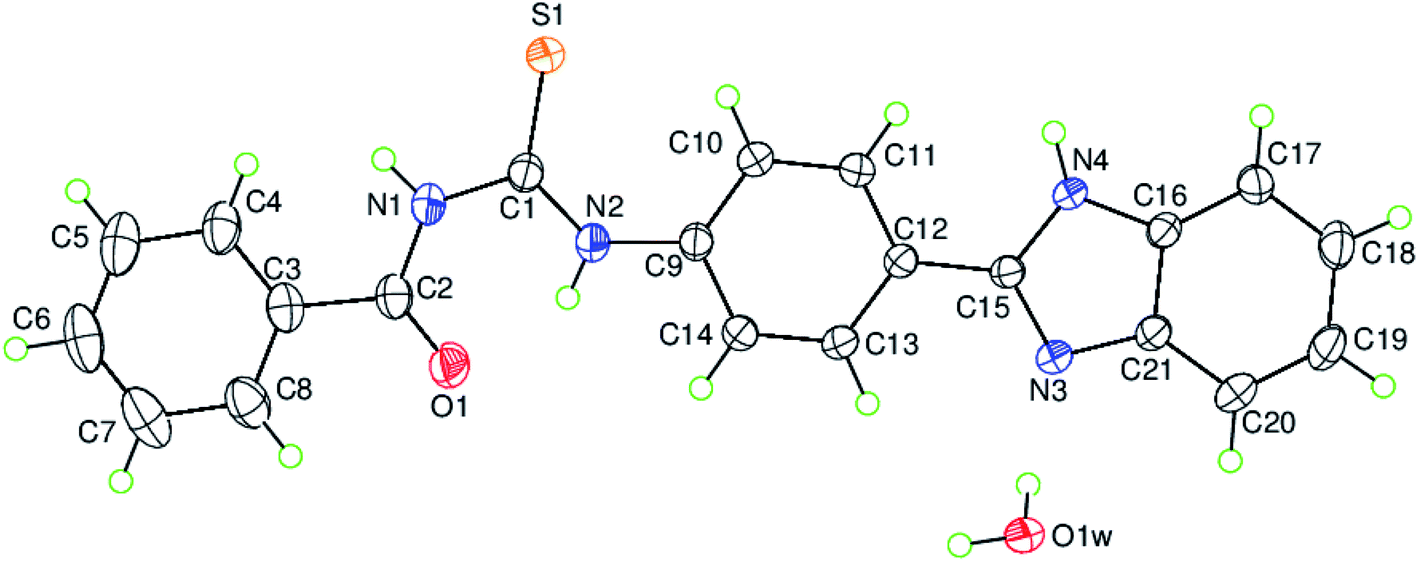
The single crystal X-ray structural determination of the titled compound confirms the assignment of its structure from spectroscopic data. The experimental details including the crystal data, data collection and refinement are summarized in Table 1. The hydrogen-bond geometry, the selected interatomic distances and the selected bond lengths, bond angles together with the torsion angles are given in Tables 2, 3 and 4, respectively. The asymmetric unit contains only one crystallographically independent molecule and one uncoordinated water molecule in the unit cell as depicted along with the atom-numbering scheme in Fig. 2, where the uncoordinated water molecule is linked to a benzimidazole nitrogen via a hydrogen bond (O–HW⋯NBnzimd; where W = water, Bnzimd = benzimidazole), (Table 2).
Table 1 Experimental details for the title compound
| Empirical formula |
C21H16N4OS·H2O |
| Formula weight |
390.45 |
| Temperature |
173(2) K |
| Wavelenght |
0.71073 Å |
| Crystal system |
Monoclinic |
| Space group |
P21/n |
| Unit cell dimensions |
a = 6.9104 (3) Å |
| b = 19.6432 (7) Å |
| c = 14.0505 (5) Å |
| β (°) |
100.235 (4) |
| Volume |
1876.90 (13) Å3 |
| Z |
4 |
| Density (calculated) |
1.382 Mg m−3 |
| Absorbtion coefficient |
0.20 mm−1 |
| F (000) |
816 |
| Crystal size |
0.54 × 0.14 × 0.12 mm3 |
| Ɵ Range for data collection |
2.5–32.7° |
| Index ranges |
−6 ≤ h ≤ 10, −24 ≤ k ≤ 29, −18 ≤ l ≤ 21 |
| Reflections collected |
12![[thin space (1/6-em)]](https://www.rsc.org/images/entities/char_2009.gif) 574 574 |
| Independent reflections |
6185 [R(int) = 0.0244] |
| Refinement method |
Full-matrix least-squares on F2 |
| Data/restraints/parameters |
4364/0/256 |
| Goodness-of-fit on F2 |
1.027 |
| Final R indices |
R1 = 0.0570 |
| [I > 2σ(I)] |
wR2 = 0.1497 |
| R indices (all data) |
R1 = 0.0856 wR2 = 0.1744 |
| Largest diff. peak and hole (e Å−3) |
0.379/−0.408 |
Table 2 Hydrogen-bond geometry (Å, °) for the title compounda
| D–H⋯A |
D–H |
H⋯A |
D⋯A |
D–H⋯A |
| Symmetry codes: (i) −x + 1, −y + 1, −z + 1; (v) x − 1/2, −y + 1/2, z − 1/2; (vi) −x + 1/2, y − 1/2, −z + 3/2. |
| N1–H1⋯O1Wi |
0.88 |
2.33 |
3.0761 (19) |
142 |
| N2–H2⋯O1 |
0.88 |
1.85 |
2.6067 (17) |
142 |
| N4–H4⋯O1Wv |
0.88 |
1.96 |
2.8103 (16) |
162 |
| C4–H4A⋯O1Wi |
0.95 |
2.81 |
3.449 (2) |
125 |
| C10–H10⋯S1 |
0.95 |
2.55 |
3.2104 (17) |
127 |
| C20–H20⋯O1vi |
0.95 |
2.61 |
3.461 (2) |
149 |
| O1W–H1WA⋯S1i |
0.87 |
2.49 |
3.2911 (13) |
153 |
| O1W–H1WB⋯N3 |
0.87 |
1.94 |
2.7832 (17) |
162 |
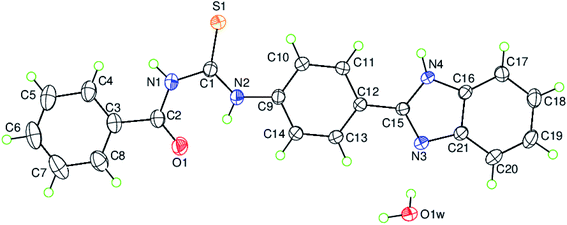 |
| | Fig. 2 The molecular structure of the title compound, C21H18N4O2S H2O, with the atom-numbering scheme for the asymmetric unit. Displacement ellipsoids are drawn at the 50% probability level. | |
The mean planes of the benzene rings [A (C3–C8) and B (C9–C14)] are oriented at a dihedral angle of A/B = 10.43(6)°. Atom C2 is co-planar with the benzene ring A (C3–C8) with a maximum deviation of 0.015(2) Å, while atoms N2 and C15 are co-planar with the benzene ring B (C9–C14) with maximum deviations of 0.019(2) Å (for atom N2) and −0.019(2) Å (for atom C15). The mean planes of rings C (N3/N4/C15/C16/C21) and D (C16–C21) are oriented at a dihedral angle of C/D = 0.77(7)°. So, the benzimidazole moiety, (N3/N4/C15–C21), is essentially planar to within 0.010(2) Å (r.m.s. deviation = 0.0067) with atom C19 deviating the most from the mean plane, and atom C12 is co-planar with the benzimidazole moiety with a maximum deviation of 0.045(2) Å. The mean planes of the benzene rings [A (C3–C8) and B (C9–C14)] are oriented with respect to the benzimidazole moiety at dihedral angles of 3.57(5) and 7.23(6)°, respectively. There are intramolecular N–H⋯O hydrogen bonds and weak C–H⋯S intermolecular interactions present in the molecule (Table 2).
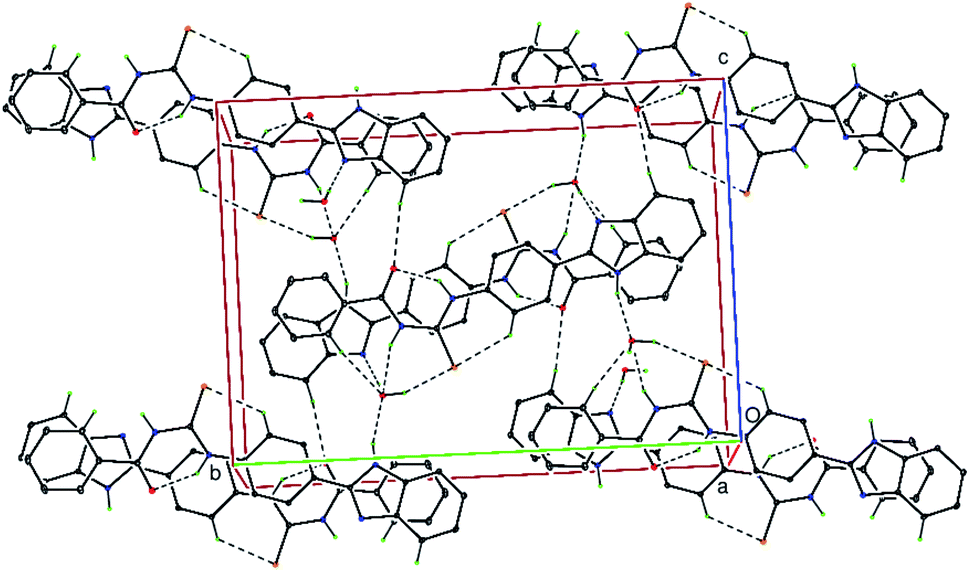
In the crystal structure, the uncoordinated water molecules are linked via intermolecular N–H⋯OW and O–HW⋯S hydrogen bonds (Table 2). The molecules are further linked via additional weak O–H⋯N intermolecular interactions (Table 2) as well as by significant weak π⋯π stacking interactions [Cg1⋯Cg2 3.8046(2)1 Å and 3.5836(2)2 Å; Cg2⋯Cg4 3.6867(2)1 Å and 3.6795(2)2 Å; Cg2⋯Cg5 3.4822(2)2 Å and 3.5953(2)1 Å; where Cg1 = N3/C15/N4/C16/C21, Cg2 = C3⋯C8, Cg4 = C16⋯C21; C5 = N3/C15/N4/C16⋯C20; symmetry 1 = 1 − x, −y, −z and 2 = 2 − x, −y, −z] resulting in a three-dimensional supramolecular network (Fig. 3). Hydrogen bonding, weak intermolecular interactions and van der Waals contacts along with weak π⋯π stacking interactions are the dominant interactions in the crystal packing.
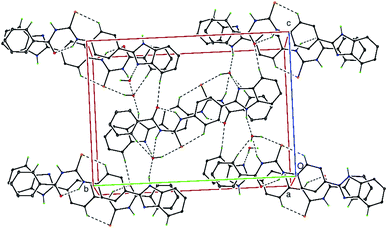 |
| | Fig. 3 A partial view of the crystal structure of C21H18N4O2S H2O, viewed along the a-axis. The N–H⋯O, O–H⋯N, O–H⋯S, hydrogen bonds and weak C–H⋯S and C–H⋯O intermolecular interactions are shown as dashed lines (see Table 2). Only the H atoms involved in hydrogen bonding have been included for clarity. | |
3.3 Hirshfeld surface analysis
The analysis of calculated Hirshfeld surfaces is invaluable since it provides additional insight into the weak intermolecular interactions in the crystal structure. Thus, a Hirshfeld surface (HS) analysis was carried out by to investigate the locations of atom–atom short contacts with potential to form hydrogen bonds and the quantitative ratios of these interactions besides any π-stacking interactions.42,43 In the HS plotted over dnorm, Fig. 4, (Top), the white surface indicates contacts with distances equal to the sum of van der Waals radii, and the red and blue colours indicate distances shorter (in close contact) or longer (distinct contact) than the van der Waals radii, respectively.44 The bright-red spots appearing near S1, O1W and hydrogen atoms H1, H4, H1WA indicate their roles as the respective donors and acceptors in the dominant N–H···O, C–H···O and O–H···S intermolecular interactions. The shape-index of the HS is a tool to visualize the π···π stacking by the presence of adjacent red and blue triangles; if there are no adjacent red and/or blue triangles, then there are no π···π interactions. Fig. 4, (Bottom) clearly suggests that there are no π···π interactions in the title compound.
 |
| | Fig. 4 (Top) View of the three-dimensional Hirshfeld surface of the title compound plotted over dnorm in the range −0.5953 to 1.5115 a.u. (Bottom) Hirshfeld surface of the title compound plotted over shape-index. | |
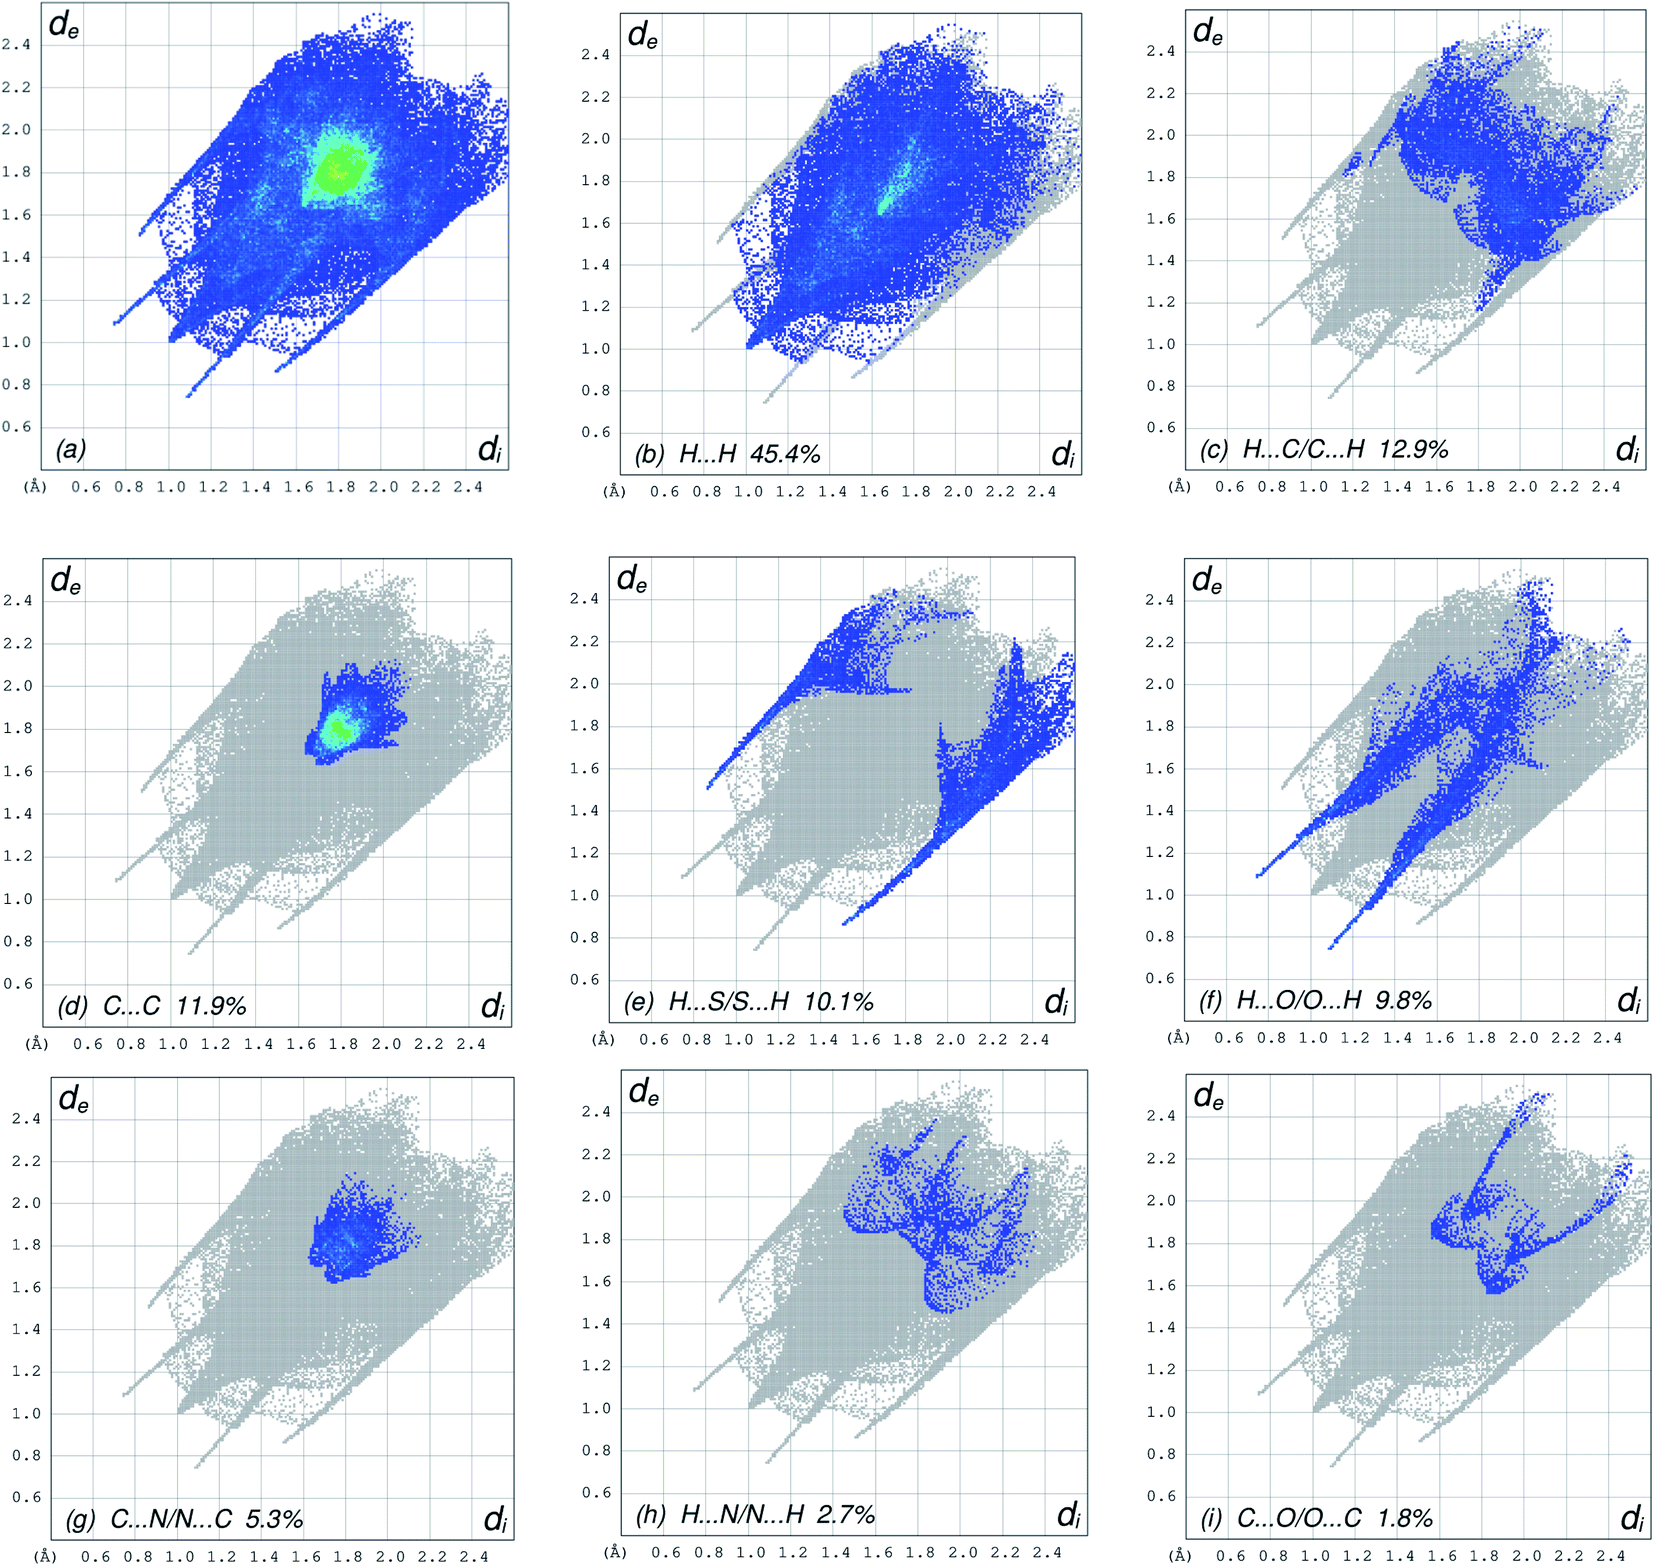
The overall two-dimensional fingerprint plot, Fig. 5a, and those delineated into H⋯H, H⋯C/C⋯H, C⋯C, H⋯S/S⋯H, H⋯O/O⋯H, C⋯N/N⋯C, H⋯N/N⋯H and C⋯O/O⋯C contacts45 are illustrated in Fig. 5b–i, respectively, together with their relative contributions to the Hirshfeld surface. The most important interaction is H⋯H contributing 45.4% to the overall crystal packing due to the large amount of the short interatomic H⋯H contacts (Table 3), which is reflected in Fig. 5b as widely scattered points of high density with the tip at de = di 1.00 Å. In the absence of C–H⋯π interactions in the crystal, the pair of characteristic wings resulting in the fingerprint plot delineated into H⋯C/C⋯H contacts with 12.9% contribution to the HS, Fig. 5c, and the pair of thin edges at de + di ∼ 2.95 Å result from interatomic H⋯C/C⋯H contacts (Table 3). The C⋯C contacts assigned to short interatomic C⋯C contacts (Table 3) with 11.9% contribution to the HS appear as a symmetric distribution of points in Fig. 5d, with the tips at de + di = 3.31 Å. The H⋯S/S⋯H interactions, Fig. 5e, has an 10.1% contribution to the total HS area of the molecule with a symmetric distribution of points, and is viewed as pair of spikes with the tips at de + di = 2.35 Å result from short interatomic H⋯S/S⋯H contacts (Table 3). The H⋯O/O⋯H contacts (Table 3) in the structure with 9.8% contribution to the HS has a symmetric distribution of points, Fig. 5f, with the tips at de + di = 2.81 Å. The symmetrical distribution of points in the fingerprint plot delineated into C⋯N/N⋯C contacts (Table 3), Fig. 5g, the 5.3% contribution to the overall crystal packing is viewed as pair of tiny spikes with the tips at de + di = 3.36 Å. In the fingerprint plot delineated into H⋯N/N⋯H contacts Fig. 5h, the 2.7% contribution to the HS arises from the interatomic H⋯N/N⋯H contacts listed in Table 3, and is viewed as pair of spikes with the tips at de + di ∼ 3.33 Å. Finally, the C⋯O/O⋯C contacts, Fig. 5i, in the structure with 1.8% contribution to the HS have a symmetric distribution of points, with the scattered points of low density, and is viewed as pair of spikes with the tips at de + di ∼3.40 Å.
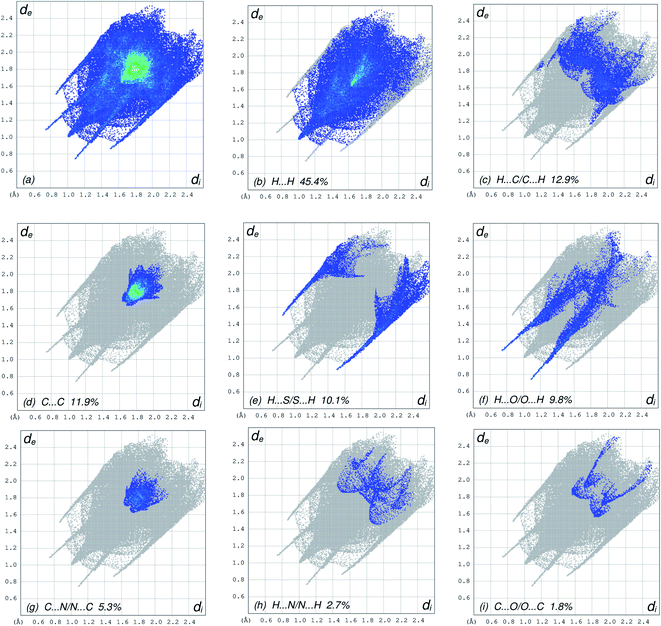 |
| | Fig. 5 The full two-dimensional fingerprint plots for the title compound, showing (a) all interactions, and delineated into (b) H⋯H, (c) H⋯C/C⋯H, (d) C⋯C, (e) H⋯S/S⋯H, (f) H⋯O/O⋯H, (g) C⋯N/N⋯C, (h) H⋯N/N⋯H and (i) C⋯O/O⋯C interactions. The di and de values are the closest internal and external distances (in Å) from given points on the Hirshfeld surface contacts. | |
Table 3 Selected interatomic distances (Å) for the title compounda
| Symmetry codes: (i) −x + 1, −y + 1, −z + 1; (ii) x + 1/2, −y + 1/2, z + 1/2; (iii) −x + 1/2, y + 1/2, −z + 3/2; (iv) −x, −y + 1, −z + 1. |
| S1⋯C10 |
3.2106 (17) |
C3⋯C15i |
3.544 (2) |
| S1⋯O1Wi |
3.2917 (13) |
C3⋯C16i |
3.833 (2) |
| S1⋯H10 |
2.56 |
C4⋯C21i |
3.586 (3) |
| S1⋯H1WAi |
2.49 |
C4⋯C16iv |
3.413 (3) |
| O1⋯N2 |
2.6062 (17) |
C5⋯C18iv |
3.575 (3) |
| O1W⋯N4ii |
2.8103 (16) |
C5⋯C20i |
3.596 (3) |
| O1W⋯N1i |
3.0764 (18) |
C5⋯C17iv |
3.580 (3) |
| O1W⋯N3 |
2.7848 (18) |
C6⋯C17i |
3.492 (3) |
| O1W⋯S1i |
3.2917 (13) |
C6⋯C18i |
3.562 (3) |
| O1⋯H8 |
2.49 |
C7⋯C17i |
3.476 (3) |
| O1⋯H20iii |
2.61 |
C7⋯C16i |
3.517 (3) |
| O1⋯H2 |
1.85 |
C9⋯C9i |
3.637 (2) |
| O1W⋯H1i |
2.33 |
C9⋯C14i |
3.718(2) |
| O1W⋯H4ii |
1.96 |
C1⋯H10 |
2.91 |
| O1W⋯H4Ai |
2.82 |
C2⋯H2 |
2.36 |
| O1W⋯H11ii |
2.81 |
C4⋯H1 |
2.47 |
| N4⋯C8i |
3.442 (2) |
C11⋯H4 |
2.74 |
| N4⋯C3iv |
3.379 (2) |
C15⋯H1WB |
2.98 |
| N1⋯H4A |
2.59 |
C21⋯H1WB |
2.81 |
| N1⋯H1WAi |
2.84 |
H1⋯H1WAi |
2.22 |
| N3⋯H1WB |
1.94 |
H1⋯H4A |
1.96 |
| N3⋯H13 |
2.62 |
H1⋯H1WBi |
2.55 |
| N4⋯H11 |
2.62 |
H1WA⋯H4ii |
2.37 |
| C1⋯C14i |
3.496 (2) |
H1WB···H4ii |
2.57 |
| C1⋯C13i |
3.383 (3) |
H2⋯H14 |
2.20 |
| C2⋯C15i |
3.610 (2) 3.550 (2) |
H4⋯H11⋯H14⋯H19iii |
2.17 |
| C2⋯C12i |
2.24 |
Table 4 Selected bond lengths (Å), bond and torsion angles (°) for the title compound
| Parameters |
X-ray analysis |
| The bond lengths (Å) |
| S1–C1 |
1.6632 (17) |
| O1–C2 |
1.2217 (19) |
| N1–C1 |
1.3919 (19) |
| N1–C2 |
1.376 (2) |
| N2–C1 |
1.376 (2), 1.4085 (18), 1.3229 (17) |
| N2–C9 |
1.388 (2), 1.3601 (18) |
| N3–C15 |
1.3710 (18) |
| N3–C21 |
|
| N4–C15 |
| N4–C16 |
|
| The bond angles (°) |
| O1–C2–N1 |
122.12 (14) |
| O1–C2–C3 |
121.74 (15) |
| N1–C2–C3 |
116.14 (14) |
| N1–C1–S1 |
118.26 (12) |
| N2–C1–S1 |
127.94 (12) |
| N1–C1–N2 |
113.79 (14) |
| C2–N1–C1 |
129.09 (14) |
| C15–N3–C21 |
104.97 (12) |
| C15–N4–C16 |
107.46 (12) |
| N2–C9–C10 |
126.12 (13) |
| N2–C9–C14 |
114.97 (13) |
| N3–C15–N4 |
112.49 (12) |
| C12–C15–N3 |
124.71 (13) |
| C12–C15–N4 |
122.79 (12) |
|
| The torsion angles (°) |
| C4–C3–C2–N1 |
17.0 (2) |
| C4–C3–C2–O1 |
−163.18 (17) |
| C8–C3–C2–N1 |
−163.93 (16) |
| C8–C3–C2–O1 |
15.9 (2) |
| C2–N1–C1–N2 |
3.9 (2) |
| S1–C1–N1–C2 |
−175.18 (14) |
| S1–C1–N2–C9 |
0.4 (3) |
| C1–N2–C9–C10 |
−11.8 (3) |
| C1–N2–C9–C14 |
170.60 (17) |
| C11–C12–C15–N4 |
−7.0 (2) |
| C13–C12–C15–N3 |
−7.8 (2) |
| C13–C12–C15–N4 |
173.16 (15) |
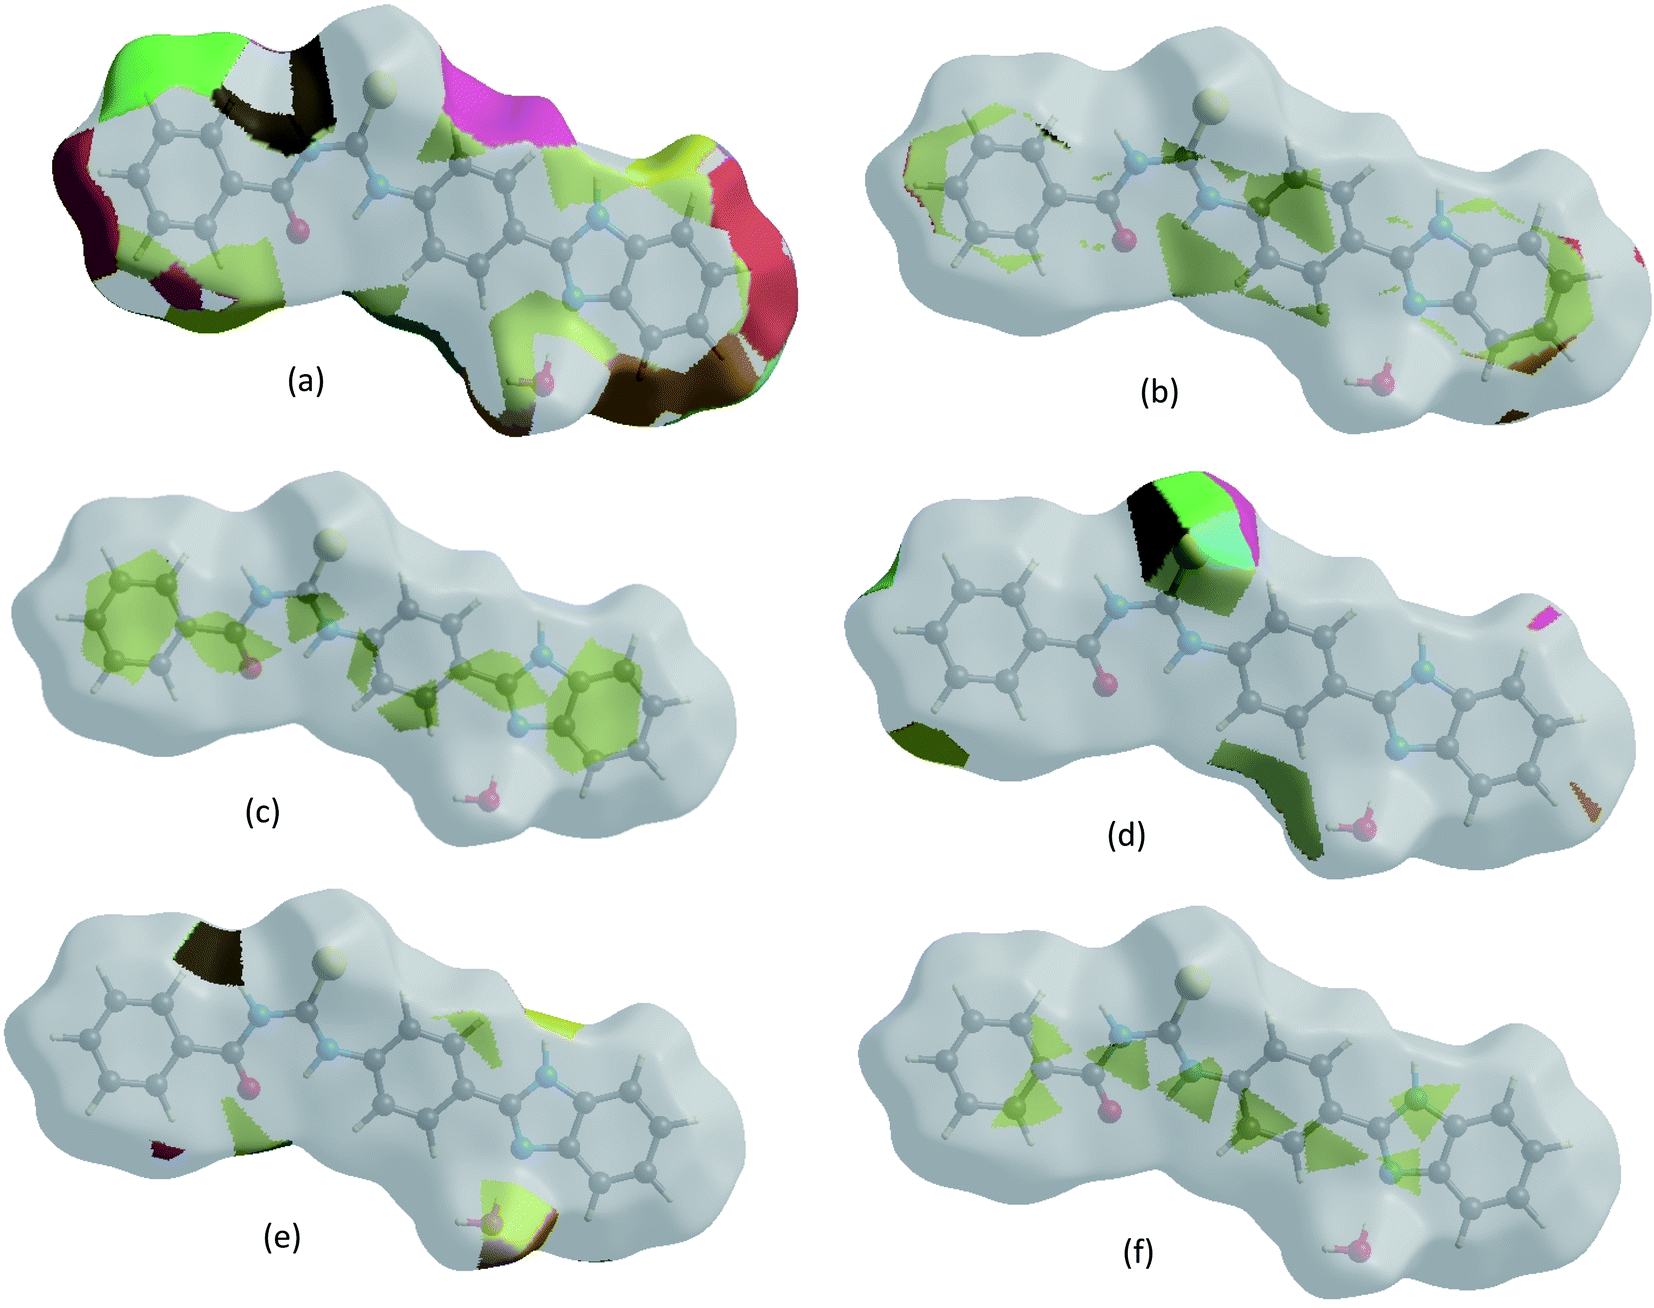
The Hirshfeld surface representations with the function dnorm plotted onto the surface are shown for H⋯H, H⋯C/C⋯H, C⋯C, H⋯S/S⋯H, H⋯O/O⋯H and C⋯N/N⋯C interactions in Fig. 6a–f, confirming that the HS surface analysis provides a full understanding of the intermolecular interactions in a facile and immediate way.
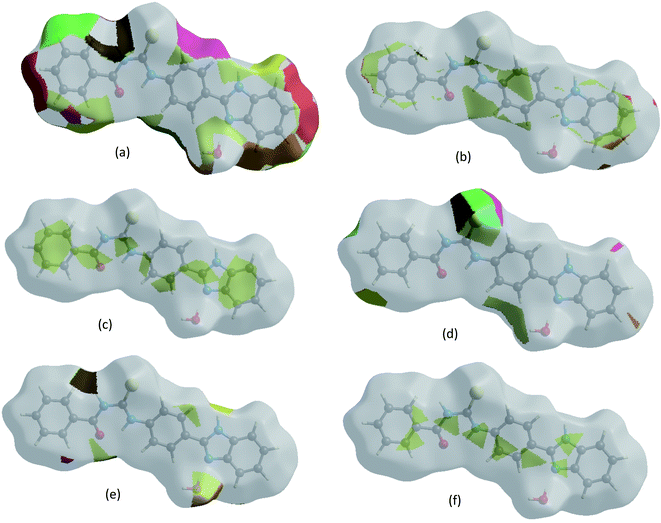 |
| | Fig. 6 The Hirshfeld surface representations with the function dnorm plotted onto the surface for (a) H⋯H, (b) H⋯C/C⋯H, (c) C⋯C, (d) H⋯S/S⋯H, (e) H⋯O/O⋯H and (f) C⋯N/N⋯C interactions. | |
The Hirshfeld surface analysis confirms the importance of H-atom contacts in establishing the packing. The large number of N–H···O, O–H···S and C–H···O interactions suggest that van der Waals interactions, hydrogen bonding and weak intermolecular interactions play the major roles in the crystal packing.46
3.4 Elastase inhibition docking studies
TUBC was docked against elastase. Docking energy analyses was carried out to predict the best fitted conformational position of synthesized compound TUBC within the active region of a targeted protein. The predicted docked complex was evaluated on the basis of minimum energy values (kcal mol−1) and interaction patterns like hydrogen and hydrophobic interactions. Binding pocket and ligand conformational analysis is shown in Fig. 7. Docking results showed that TUBC exhibits good binding energy values (kcal mol−1) against the receptor with little fluctuations. Prior research showed that the standard error mean of docking energy for Autodock is 2.5 kcal mol−1.
 |
| | Fig. 7 Elastase inhibition; binding pocket and ligand (TUBC) conformational analysis. | |
3.5 In vitro elastase inhibition studies
The inhibitory potential of TUBC against elastase enzyme was evaluated according to the following formula:
| Elastase inhibition activity (%) = (ODcontrol − ODsample × 100)/ODcontrol |
where, ODcontrol and ODsample represent the optical densities in the absence and presence of a TUBC, respectively. Oleanolic acid was used as the standard inhibitor for elastase. The obtained results in terms of IC50 (μM) values are presented in Table 5. The compound TUBC showed very potent inhibitory activity against this enzyme, as it was evident from its lower IC50 value, relative to oleanolic acid (standard).
Table 5 Elastase and free radical scavenging inhibitory activity of TUBCa
| Compound |
Elastase IC50 + SEM (μM) |
Free radical % scavenging (100 μg mL−1) |
| SEM = standard error of the mean; values are expressed in mean ± SEM. |
| TUBC |
10.532 ± 1.083 |
80.915 ± 0.519 |
| Oleanolic acid |
13.451 ± 0.014 |
— |
| Vitamin C |
— |
94.823 ± 0.046 |
TUBC showed significant elastase inhibition as compared to reference oleanolic acid. This is in line with the fact that acyl thioureas are well known for exhibiting a wide range of bioactivities. The elastase inhibition of TUBC is comparable to those of others acyl thioureas including 1-butanoyl, 1-pentanoyl and 1-heptanoyl as well as the 3-phenylcoumarins and densely populated piperidines.47–51 It can be attributed that the presence of NH functional group capable of exhibiting basic, nucleophilic and H-bonding interactions thereby making it more hydrophilic whilst the amidic carbonyl can interact as a H-bond donor system. The elastase inhibition activity of TUBC is pointing towards its candidacy to be used in skin care and cosmetic industry.
3.6 Free radical scavenging
The radical scavenging activity of TUBC was evaluated at a value compared with the standard (Vitamin C) in Table 5. TUBC has shown significant scavenging activity against DPPH˙ even at concentration (100 μg mL−1), which showed it to be a potential antioxidant.
3.7 Density functional theory (DFT) studies
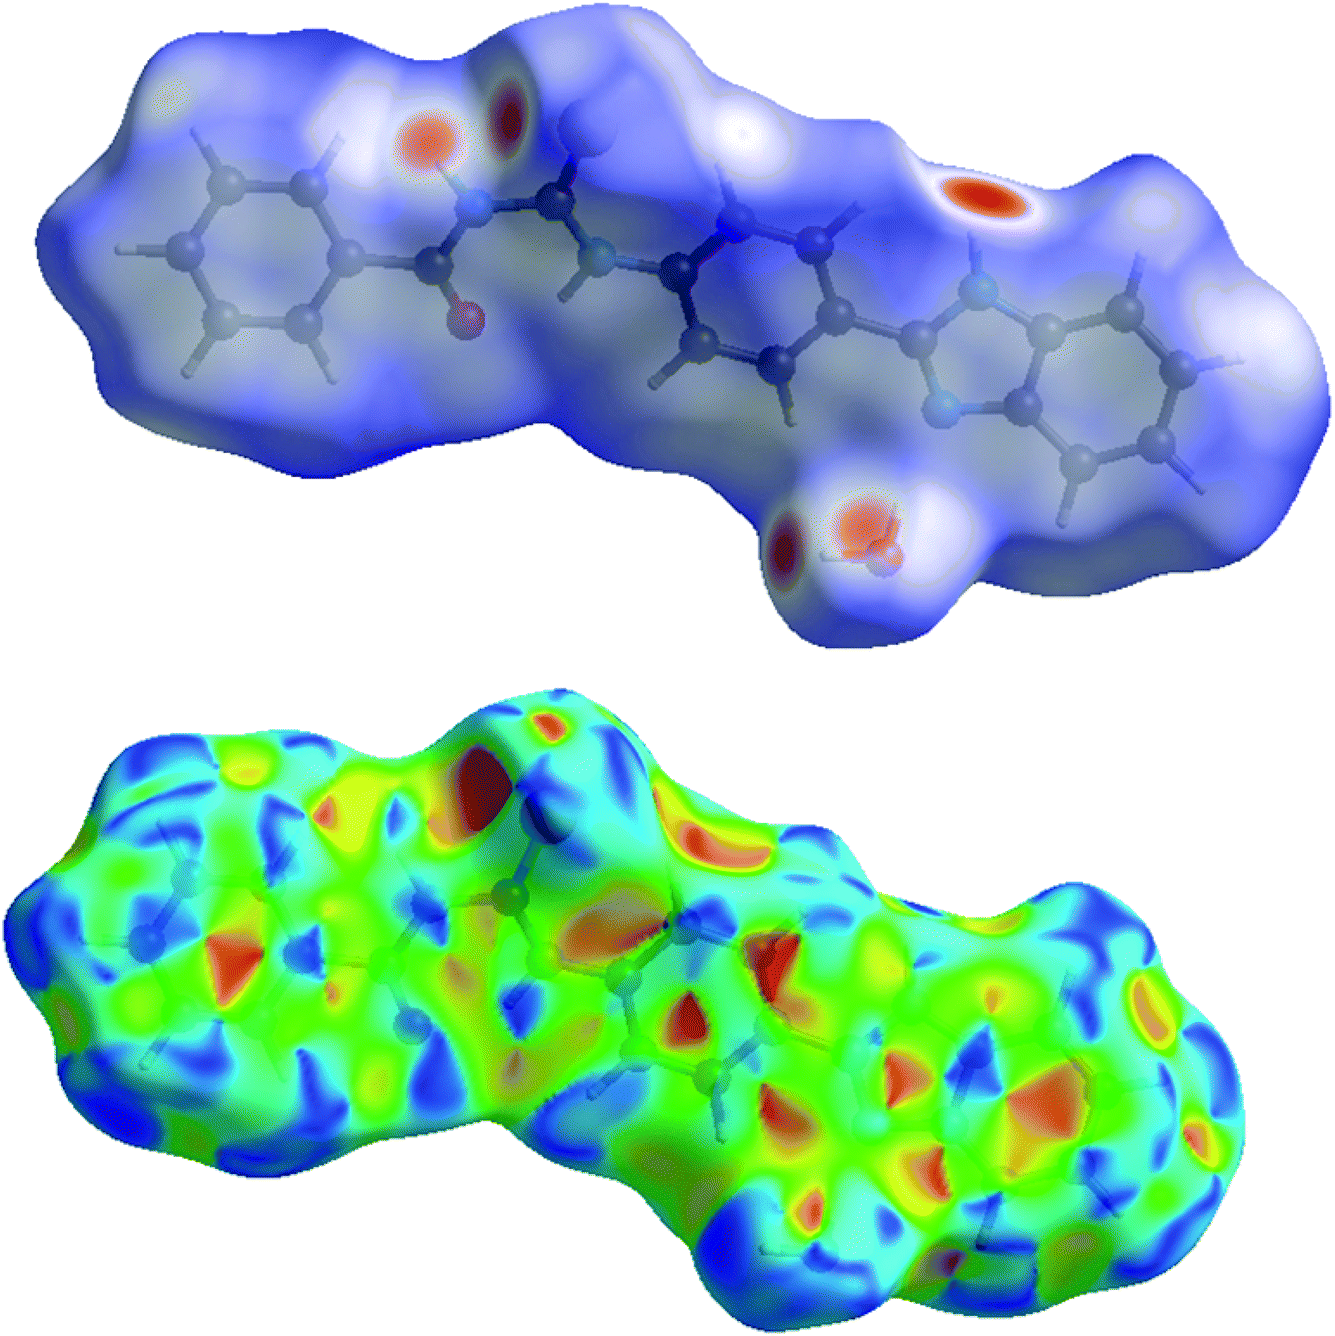
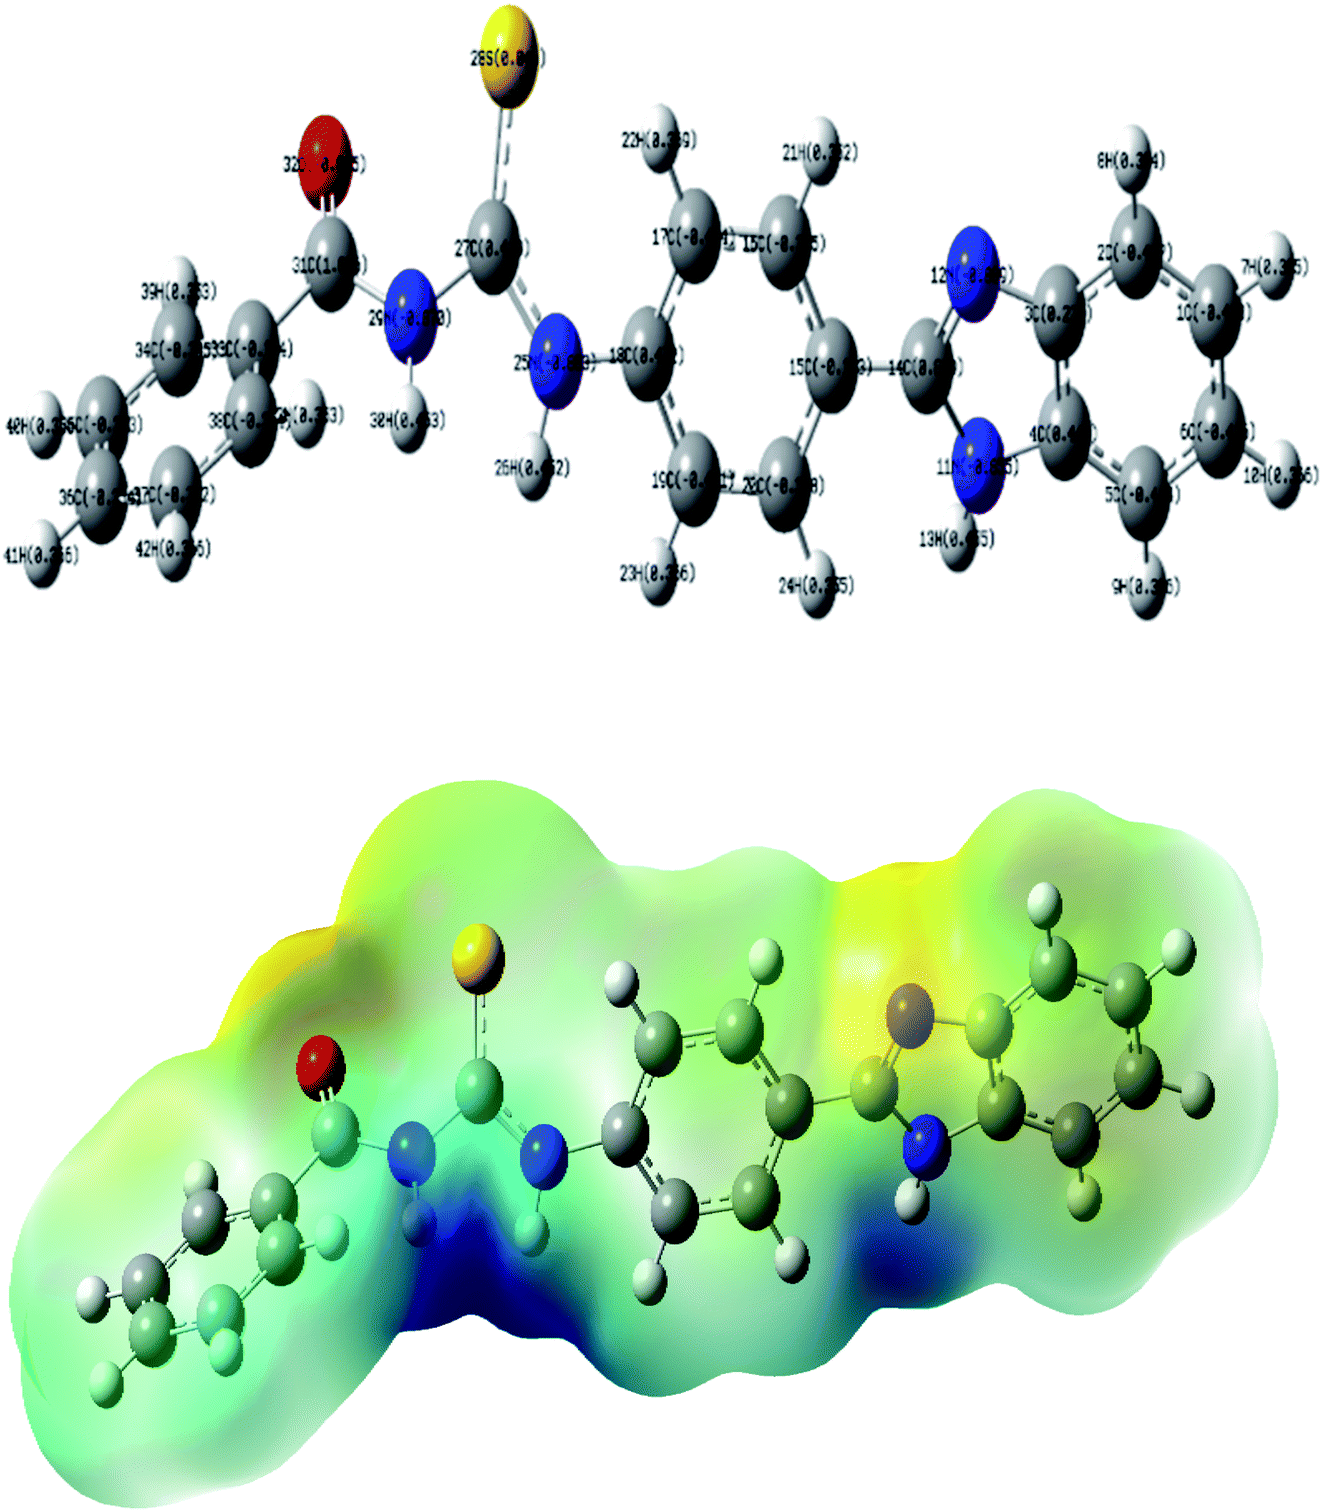
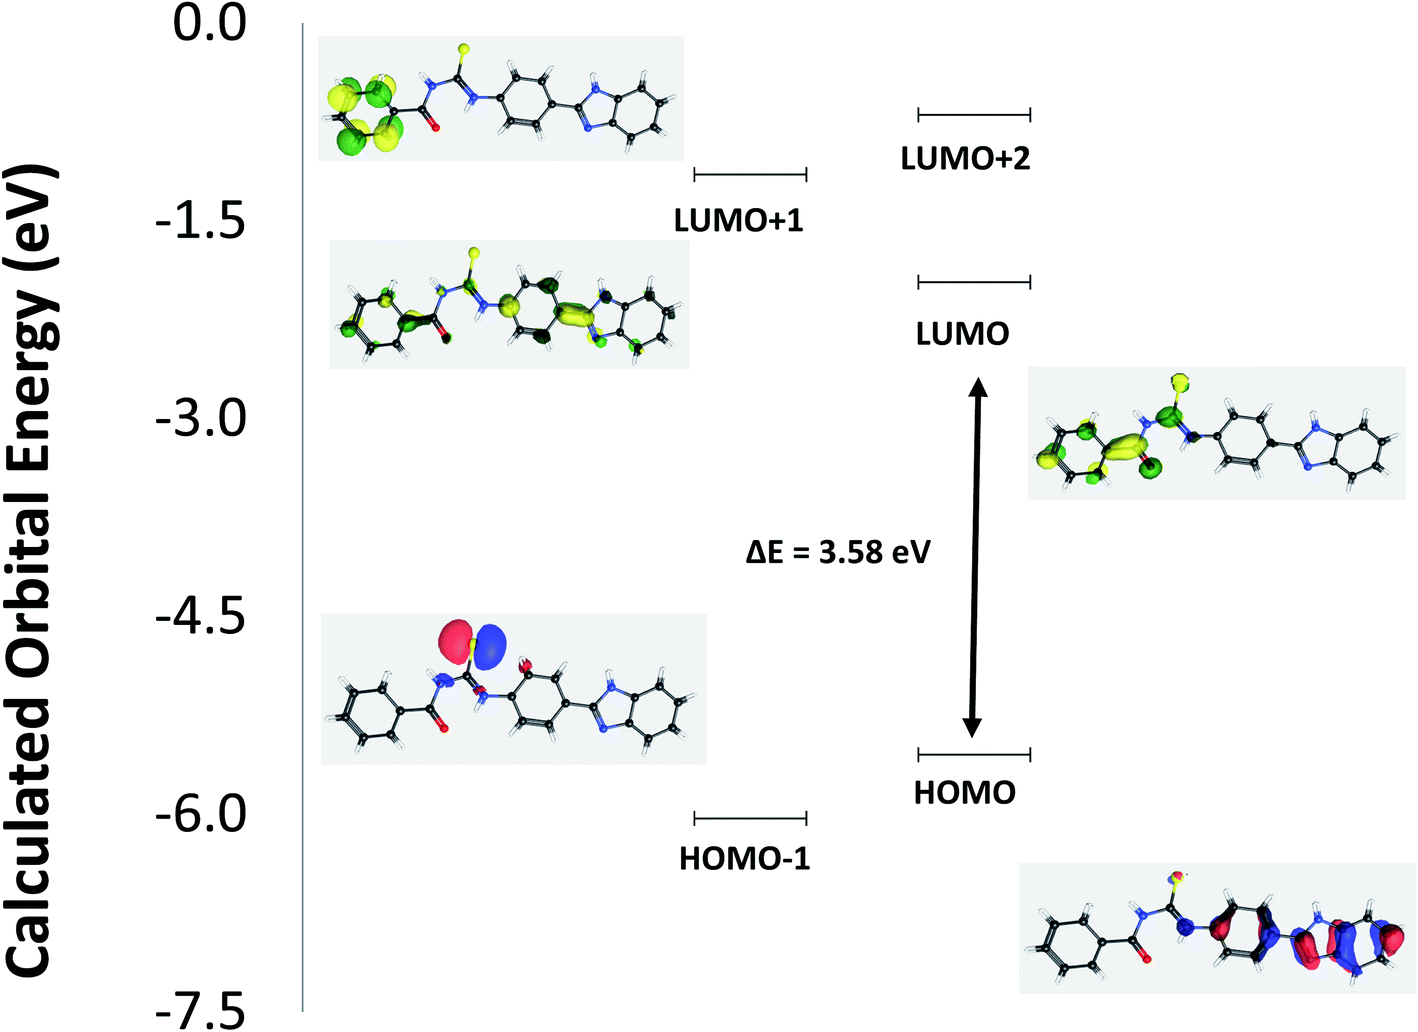
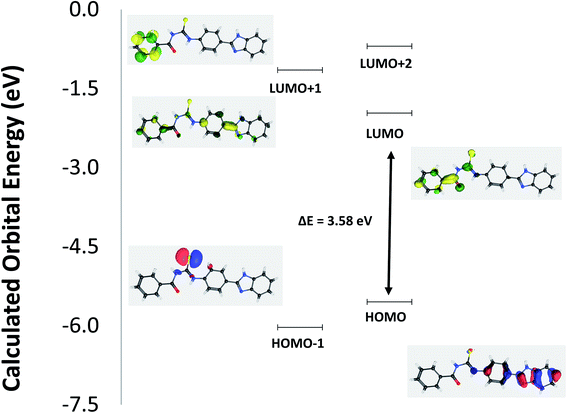
The structural geometry of TUBC has been simulated and optimized using DFT/B3LYP to determine its geometric and electronic parameters (bond lengths, bond angles, EHOMO, ELUMO). The optimized geometries of TUBC have been depicted in Fig. 8 (Top), wheres the symmetric charge distribution on each individual atom of TUBC has been indicated. The frontier molecular orbital (FMO) analysis using the quantum mechanical approach is also a popular way to predict molecular electronic transitions.35 The calculated molecular orbital energies (eV) for the surfaces of the frontier molecular orbitals are shown in Fig. 9 (Table 6).
 |
| | Fig. 8 (Top) The optimized geometry of TUBC at the B3LYP/6-31G (d,p) level of theory, (Bottom): molecular electrostatic potential surfaces (MESP) of TUBC. | |
 |
| | Fig. 9 Schematic molecular orbital (MO) diagram of TUBC representing HOMO, LUMO and HOMO–LUMO energy gap (ΔE). | |
Table 6 Experimental and calculated energies of molecular orbitals for C21H16ON4S and associated electronic transitions
| Experimental λmax (nm eV−1) |
f |
MO contribution |
Calculated λmax (nm eV−1) |
| 256/4.84 |
1.60 |
HOMO → LUMO |
346/3.58 |
| 256/4.84 |
1.80 |
HOMO → LUMO+1 |
281/4.39 |
| 216/5.74 |
1.80 |
HOMO → LUMO+2 |
255/4.85 |
| 256/4.84 |
1.60 |
HOMO−1 → LUMO |
304/4.06 |
| 216/5.74 |
1.80 |
HOMO−1 → LUMO+1 |
254/4.88 |
| 216/5.74 |
1.80 |
HOMO−1 → LUMO+2 |
232/5.33 |
In HOMO the electronic clouds are distributed primrily on the p-disubstituted benzene and benzo[d]imidazol rings. In LUMO, they are located on the phenyl ring and thiourea group. In LUMO+1 they are located primarily on the phenyl and p-disubstituted benzene rings while in LUMO+2 they are delocalized primarily on the phenyl ring. In HOMO−1 the electron clouds are located on the thiourea group. Surface plots for the highest occupied molecular orbitals (HOMO−1 and HOMO) act as electron donors and the three lowest unoccupied molecular orbitals (LUMO, LUMO+1 and LUMO+2) act as electron acceptors.
The HOMO–LUMO gap is a very important parameter for quantum chemistry. When the gap is small, the molecule is highly polarizable and has high reactivity. Therefore, these calculations provide important insight into the reactivity and site selectivity of the molecular framework. The observed experimental absorption spectrum (Fig. 11, in Section 3.8) shows two band envelopes with λmax values located at 340 and 300 nm. Electronic transitions are geneally paired between the various molecular orbitals of the ground and excited states corresponding to these two band envelopes as indicated in Table 4. In this case these represent transitions of electron density from molecular orbitals in the p-disubstituted and benzo[d]imidazol rings and thiourea group (HOMO and HOMO−1) to molecular orbitals in the phenyl ring and thiourea group, collectively. Therefore, the first absorption band envelope at 340 nm is assigned to overlapping contributions primarily from HOMO → LUMO and HOMO−1 → LUMO. The second absorption band at 300 nm is assigned to overlapping contributions from HOMO → LUMO+1, HOMO → LUMO+2, HOMO−1 → LUMO+1, and HOMO−1 → LUMO+2, respectively. The energy gap between HOMO and LUNO is 3.58 eV suggesting greater reactivity of TUBC for interaction with DNA molecule. [HOMO to LUMO+1 is 4.39 eV; HOMO to LUMO+2 is 4.85 eV; HOMO−1 to LUMO is 4.06 eV; HOMO−1 LUMO+1 is 4.88 eV; HOMO−1 to LUMO+2 is 5.33 eV, respectively.
The molecular electrostatic potential (MEP) was also computed at the B3LYP/6-31+G(d,p) level of theory. The optimized geometry at the B3LYP/6-31G(d,p) level of theory was used to map the molecular electrostatic potential surfaces (MESP) of TUBC and are presented in Fig. 8 (Bottom). It is evident from the Fig. 8 that negative potential is concentrated on the oxygen, sulfur and nitrogen atoms which reflects electron transfer from O, S and N. Dispersion of the potential for TUBC ranges from −0.156 to 0.0156 esu indicating electrophilic and nucleophilic centers in this range.
Quantum chemical DFT studies of TUBC revealed that based on EHOMO and ELUMO values, it is considered to be good electron acceptor, and could accept electrons from DNA base pairs.
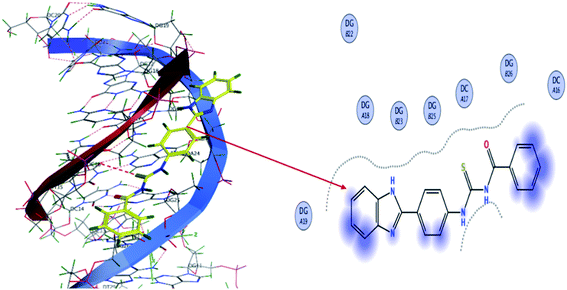
3.8 Molecular docking for studies DNA binding
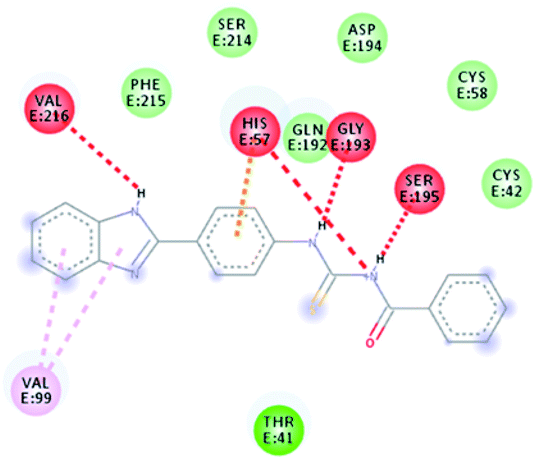
The molecular mechanism for the interactions of TUBC with DNA was interpreted using molecular docking to simulate the modes of interactions between the TUBC and DNA. Pose view analysis and conformations of TUBC with the lowest free energy are shown in Fig. 10. Binding free energy (ΔG) and binding constant “Kb” values for TUBC were calculated and are given in Table 7. Fig. 10 (Left) indicate a mixed mode of TUBC interactions with DNA. Ligplot indicate 2D interactions of TUBC with DNA, Fig. 10 (Right). TUBC furnished vander Waal's interactions with the hydrophobic core of the DNA.
 |
| | Fig. 10 (Left) Molecular docked complex of TUBC and (Right) its ligplots calculated at the PM3 semi-empirical level of theory. | |
Table 7 Theoretical data for TUBC–DNA binding obtained from molecular docking
| Molecular docking |
| Complex |
Kb M−1 |
ΔG kJ mol−1 |
| TUBC–DNA |
1.60 × 10⁴ |
−23.91 |
| Electronic descriptors |
| Complex |
EHOMO (kcal mol−1) |
ELUMO (kcal mol−1) |
Eele (kcal mol)−1 |
Evander (kcal mol−1) |
EIP (kcal mol−1) |
ETotal (kcal mol−1) |
| TUBC–DNA |
−12.10113 |
−4.68065 |
−1179573 |
12.9227018 |
12.10113 |
−127064.6 |
| Steric descriptors |
| Complex |
Hf kcal mol−1 |
MR |
S logP |
Vsurf |
Dipole |
| TUBC–DNA |
211.372067 |
297.2120 |
5.17019 |
141.6177 |
3.181483 |
A comprehensive understanding of the physico–chemical interactions of TUBC, along with several electronic and steric descriptors were calculated and are provided in Table 7. EHOMO and ELUMO values give an estimate of the electron-donating or electron-accepting character of a given compound and, consequently, a compound is considered more electron-donating as the value of its EHOMO increases and more electron accepting as the value of its ELUMO decreases.52,53 EHOMO values portrayed TUBC as electron accepting as compared to DNA base pairs. While interacting with DNA, TUBC withdraws electrons from electron rich base pairs and behave as good electron acceptors determining the reason for a higher binding value of TUBC with DNA. Steric descriptors also exhibited a soundly good correlation with the binding constant, “Kb”. With the partition coefficient (S logP) which determines extent of lipophilicity of compounds, the compound with higher partition coefficient forms a stronger complex.35,52,53 S logP values for TUBC in Table 7 depicted efficient binding of TUBC with the DNA. Another important steric descriptor is molar refractivity (MR) which is measure of polarizability of molecule.53 TUBC possesses a higher MR value, which also indicates significantly strong complex formation (Table 7).
3.9 UV-visible spectroscopic DNA binding studies
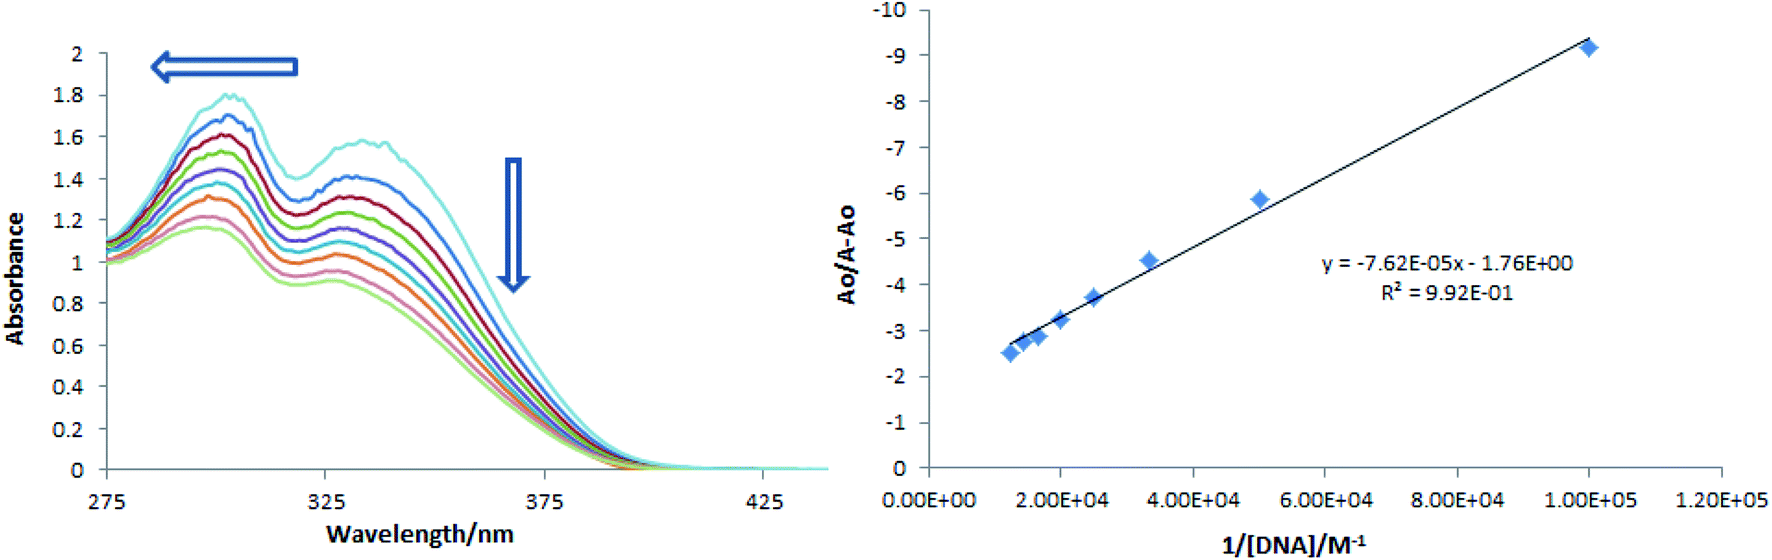
Compound-DNA binding could be visualized through UV-visible spectroscopy by performing a titration experiment and it is considered a more reliable way for studying interactional behavior of a compound towards DNA. Titration of varying concentrations of DNA on a fixed concentration of a compound results in absorption intensity change as well as in wavelength shift. These changes in the spectral response of a compound before and after DNA additions not only describe interaction via formation of a compound-DNA adduct, but the extent and nature of interactions could also be predicted by using absorption data to determine kinetic and thermodynamic parameters. A decrease in absorption peak intensity (hypochromism) in the absorption spectrum of a compound is usually observed when it binds with DNA through intercalation.54,55 In present DNA binding studies, a drop in the absorption peak intensity of TUBC compound's spectra in DNA presence was observed along with the shifting of a peak towards lower wavelength, Fig. 11 (Left). The extent of hypochromism was evaluated to be 39.71% and a blue shift of 21 nm after the addition of 80 μM of DNA (the highly added DNA concentration). This personage of hypochromism indicated binding of TUBC with DNA via intercalative interaction, while a blue shift pointed towards electrostatic interaction in addition to intercalation.51,52 Using absorption data in the Bensi–Hildebrand equation {Ao/A − Ao = εG/εH–G − εG + εG/εH–G − εG 1/Kb[DNA]}, the binding constant ‘Kb’ was calculated as the intercept to slope ratio by plotting a graph between Ao/A − Ao vs. 1/[DNA],56 Fig. 11 (Right). The Kb value was further substituted in the classical van't Hoff equation {ΔG = −RTlnKb} to determine free energy change (ΔG). Kb and ΔG values which were evaluated to be 2.31 × 10⁴ M−1, and −24.89 kJ mol−1, respectively. These values of binding parameters agree with that reported for spontaneous DNA binding via intercalation.57–59 These values are also comparable with that reported by our group for a new quinolinyl–thiourea hybrid as potential DNA binder.60 Further, binding data from spectral analysis was found to agree with the docking analysis.
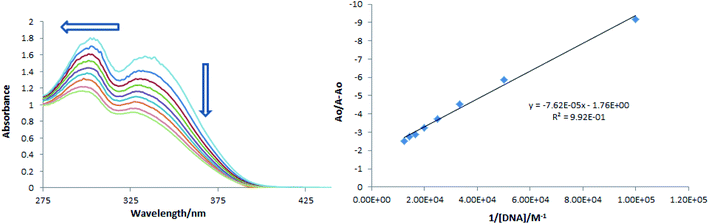 |
| | Fig. 11 (Left) UV-visible spectra of TUBC in the presence of fs-DNA (10–80 μM) in 10% aqueous DMSO at 37 °C. (Right) Ao/A − Ao vs. 1/[DNA] plot for the determination of binding constant of TUBC–DNA complex by using the Benesi–Hildebrand equation. Arrow direction indicates the trend in absorption in the presence of increasing DNA concentrations. | |
3.10 Viscosity measurements for DNA binding verification
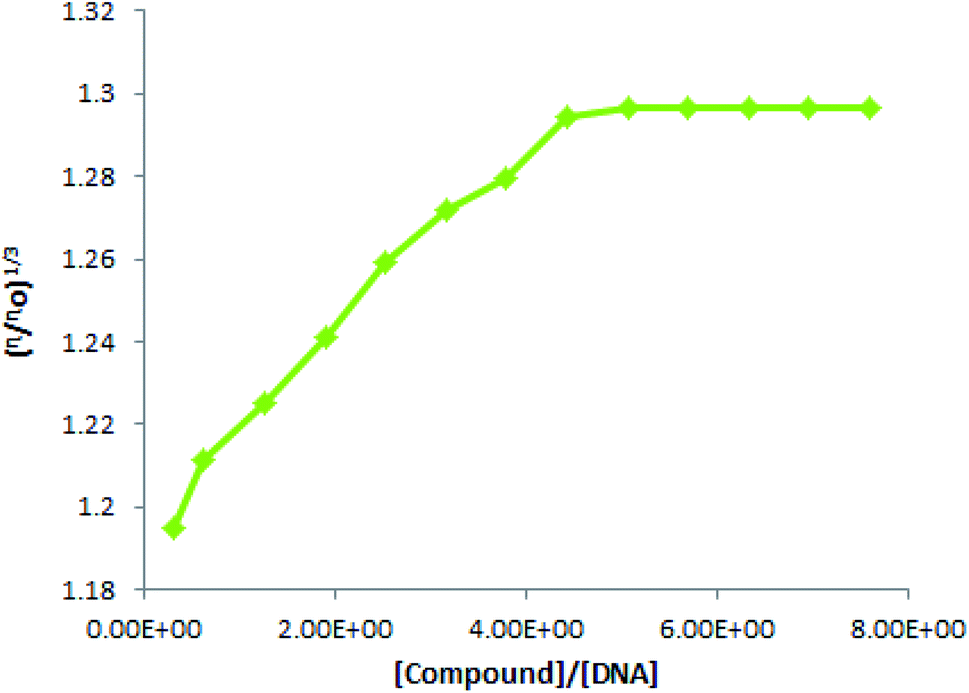
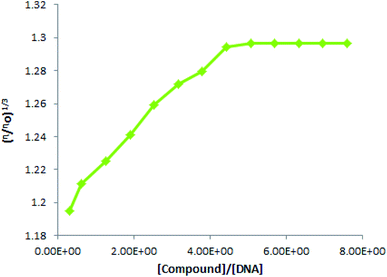
DNA is biopolymer and the lengthening in a DNA duplex due to a compound's intercalation could be observed as changes in its viscosity. Insertion of a compound into DNA base pockets bring a small rise in DNA viscosity. This small rise, while measuring DNA viscosity before and after a compound's addition, is concentration dependent. If viscosity rises linearly with a compound's concentration, it verifies the intercalation mode involved in compound – DNA binding.61 In opposition, twisting in the DNA helix arises if binding occurs through a groove or electrostatic interaction, which reduces the effective length of DNA; resulting in a decrease in DNA viscosity.62 However, for mixed binding mode verification, literature has reported viscosity to rise up to a certain compound's concentration and then become constant (no change).63
As a best and easy verification method for binding mode investigations, in the present work, we ran viscosity experiments to measure the DNA viscosity at its fixed concentration and after the addition for varying TUBC concentrations. Then viscosity was plotted as the cube root of relative viscosity (η/ηo)1/3 vs. [compound/[DNA] ratio, Fig. 12. A linear rise in the viscosity was observed until 80 μM addition of TUBC was made and then no significant change was observed with further added concentrations of TUBC were made. i.e., the graph gets straight after 80 μM addition of TUBC. Viscosity results verified a mixed binding mode (intercalation + groove binding/or electrostatic interaction) and further authenticated our computational and spectroscopic findings. The aforementioned results indicate that this molecule (TUBC) has the possibility to be assayed for other biological activities in face of its versatile characteristics as analyzed in this paper.
 |
| | Fig. 12 Plot of (η/ηo)1/3 vs. [compound]/[DNA] at physiological pH (7.0) and temperature (37 °C). | |
4 Conclusions
Spectroscopic and single crystal X-ray diffraction studies on the title compound (C21H18N4O2S·H2O·TUBC) confirmed it to be new benzimidazole thiourea moiety crystallizing with one independent molecule and one uncoordinated water molecule in the asymmetric unit. The uncoordinated water molecules are linked via intermolecular N–H⋯OW hydrogen bonds and weak and O–HW⋯S intermolecular interactions. The molecules are further linked via additional weak O–H⋯N intermolecular interactions and contain significant weak π⋯π stacking interactions resulting in a three-dimensional supramolecular network. The Hirshfeld surface analysis of the crystal structure indicates that the most important contributions for the crystal packing are from H⋯H (45.4%), H⋯C/C⋯H (12.9%), C⋯C (11.9%), H⋯S/S⋯H (10.1%) and H⋯O/O⋯H (9.8%) interactions. Hydrogen-bonding and van der Waals interactions are the dominant interactions in the crystal packing. TUBC showed significant elastase inhibition as compared to reference oleanolic acid. Computational docking results indicated their binding within the active region of a target protein. Significant radical scavenging activity further proved it to be a potential antioxidant. Quantum chemical DFT studies of TUBC revealed that based on EHOMO and ELUMO values, it is considered to be good electron acceptor, accepting electrons from DNA base pairs as evident from molecular docking studies. The experimental work further showed TUBC to be a potential drug candidate that binds spontaneously and reversibly with DNA via a mixed binding mode. Overall theoretical and experimental findings pointed to TUBC as a potential candidate for a variety of biological applications including the unique properties related to elastase inhibition, free radical scavenging activity and its DNA binding ability.
Author contributions
Correspondance, DNA binding analysis & writing and compiling original draft by Nasima Arshad; synthesis work by Mamoona Rafiq, Rabail Ujan and Saba Ashraf; synthesis data analysis by Aamer Saeed, Pervaiz Ali Channar; DNA binding experimental work by Shahid I. Farooqi; DFT and molecular docking for DNA binding by Fouzia Perveen; elastase and antioxidant studies by Qamar Abbas, Ashfaq Ahmed; Hirshfeld surface studies by Tuncer Hokelek; crystal structure and analysis by Manpreet Kaur and Jerry P. Jasinski; Jerry P. Jasinski also help corresponding author for review, proof reading for english and grammar and in DFT interpretation.
Conflicts of interest
The authors would like to declare that there is no established conflict of interest.
Acknowledgements
The contributions of all authors' organizations for the facilitation of this collaborative research is highly acknowledged. Jerry P. Jasinski acknowledges the NSF-MRI program (Grant No. CHE-1039027) for funds to purchase the X-ray diffractometer.
References
- M. Seelam, B. V. Shaikh, R. Tamminana and P. R. Kammela, Tetrahedron Lett., 2016, 57, 5297–5300 CrossRef CAS.
- F. Mao and A. Heller, Transition metal complexes with bidentate ligand having an imidazole ring and sensor constructed therewith, US Pat., no. 6605201, 12 Aug. 2003.
- H. Fan, B. Song, P. S. Bhadury, L. Jin, D. Hu and S. Yang, Int. J. Mol. Sci., 2011, 12, 4522–4535 CrossRef CAS PubMed.
- D. Sinha, A. K. Tiwari, S. Singh, G. Shukla, P. Mishra, H. Chandra and A. K. Mishra, Eur. J. Med. Chem., 2008, 43, 160–165 CrossRef CAS PubMed.
- D. Sriram, P. Yogeeswari and K. Madhu, Bioorg. Med. Chem. Lett., 2006, 16, 876–878 CrossRef CAS PubMed.
- Z.-H. Li, X.-Q. Liu, T.-Q. Zhao, P.-F. Geng, W.-G. Guo, B. Yu and H.-M. Liu, Eur. J. Med. Chem., 2017, 139, 741–749 CrossRef CAS PubMed.
- T. L. da Silva, L. M. F. Miolo, F. S. Sousa, L. M. Brod, L. Savegnago and P. H. Schneider, Tetrahedron Lett., 2015, 56, 6674–6680 CrossRef.
- I. Koca, A. Özgür, K. A. Coşkun and Y. Tutar, Bioorg. Med. Chem., 2013, 21, 3859–3865 CrossRef CAS PubMed.
- J.-e. Park, A. Elkamhawy, A. H. Hassan, A. N. Pae, J. Lee, S. Paik, B.-G. Park and E. J. Roh, Eur. J. Med. Chem., 2017, 141, 322–334 CrossRef CAS PubMed.
- S. Perveen, N. Fatima, M. A. Khan, A. Dar, K. M. Khan, N. Afza and W. Voelter, Med. Chem. Res., 2012, 21, 2709–2715 CrossRef CAS.
- K. Bhandari, N. Srinivas, L. Sharma, S. Srivastava, A. Nath and C. Nath, Med. Chem. Res., 2008, 17, 103–113 CrossRef CAS.
- I. Piantanida and M. Cindric, Bioorg. Med. Chem., 2008, 16, 5189–5198 CrossRef PubMed.
- A. M. Miftah and D. H. Tjahjono, Procedia Chem., 2015, 17, 157–161 CrossRef.
- A. Mahajan, S. Yeh, M. Nell, C. E. van Rensburg and K. Chibale, Bioorg. Med. Chem. Lett., 2007, 17, 5683–5685 CrossRef CAS PubMed.
- T. Venkatachalam, E. A. Sudbeck, C. Mao and F. M. Uckun, Bioorg. Med. Chem. Lett., 2001, 11, 523–528 CrossRef CAS PubMed.
- V. Alagarsamy, S. Meena, K. Ramseshu, V. Solomon, K. Thirumurugan, K. Dhanabal and M. Murugan, Eur. J. Med. Chem., 2006, 41, 1293–1300 CrossRef CAS PubMed.
- T. Venkatachalam, S. Qazi, P. Samuel and F. Uckun, Bioorg. Med. Chem., 2003, 11, 1095–1105 CrossRef CAS PubMed.
- A. Saeed, S. Ashraf, U. Flörke, Z. Y. D. Espinoza, M. F. Erben and H. Pérez, J. Mol. Struct., 2016, 1111, 76–83 CrossRef CAS.
- A. Saeed, S. Zaib, S. Ashraf, J. Iftikhar, M. Muddassar, K. Y. Zhang and J. Iqbal, Bioorg. Chem., 2015, 63, 58–63 CrossRef CAS PubMed.
- A. Saeed, R. Qamar, T. A. Fattah, U. Flörke and M. F. Erben, Res. Chem. Intermed., 2017, 43, 3053–3093 CrossRef CAS.
- G. W. Lee, N. Singh and D. O. Jang, Tetrahedron Lett., 2008, 49, 1952–1956 CrossRef CAS.
- S. Madabhushi, K. K. R. Mallu, V. S. Vangipuram, S. Kurva, Y. Poornachandra and C. G. Kumar, Bioorg. Med. Chem. Lett., 2014, 24, 4822–4825 CrossRef CAS PubMed.
- N. Korkmaz, O. A. Obaidi, M. Senturk, D. Astley, D. Ekinci and C. T. Supuran, J. Enzyme Inhib. Med. Chem., 2015, 30, 75–80 CrossRef CAS PubMed.
- S. Babkina and N. Ulakhovich, Anal. Chem., 2005, 77, 5678–5685 CrossRef CAS PubMed.
- O. Rigaku, Rigaku Oxford Diffraction, Yarnton, England, 2015 Search PubMed.
- O. Dolomanov, L. Bourhis, R. Gildea, J. Howard and H. Puschmann, J. Appl. Crystallogr., 2009, 42, 339–341 CrossRef CAS.
- M. Turner, J. McKinnon, S. Wolff, D. Grimwood, P. Spackman, D. Jayatilaka and M. Spackman, CrystalExplorer17, The University of Western Australia Perth, WA, Australia, 2017 Search PubMed.
- E. F. Pettersen, T. D. Goddard, C. C. Huang, G. S. Couch, D. M. Greenblatt, E. C. Meng and T. E. Ferrin, J. Comput. Chem., 2004, 25, 1605–1612 CrossRef CAS PubMed.
- D. Wang, X. Zhu, C. Cui, M. Dong, H. Jiang, Z. Li, Z. Liu, W. Zhu and J.-G. Wang, J. Chem. Inf. Model., 2013, 53, 343–353 CrossRef CAS PubMed.
- S. Dallakyan and A. J. Olson, Chemical Biology, Springer, 2015, pp. 243–250 Search PubMed.
- M. J. Frisch, G. W. Trucks, H. B. Schlegel, G. E. Scuseria, M. A. Robb, J. R. Cheeseman, G. Scalmani, V. Barone, G. A. Petersson, H. Nakatsuji, X. Li, M. Caricato, A. Marenich, J. Bloino, B. G. Janesko, R. Gomperts, B. Mennucci, H. P. Hratchian, J. V. Ortiz, A. F. Izmaylov, J. L. Sonnenberg, D. Williams-Young, F. Ding, F. Lipparini, F. Egidi, J. Goings, B. Peng, A. Petrone, T. Henderson, D. Ranasinghe, V. G. Zakrzewski, J. Gao, N. Rega, G. Zheng, W. Liang, M. Hada, M. Ehara, K. Toyota, R. Fukuda, J. Hasegawa, M. Ishida, T. Nakajima, Y. Honda, O. Kitao, H. Nakai, T. Vreven, K. Throssell, J. A. Montgomery Jr, J. E. Peralta, F. Ogliaro, M. Bearpark, J. J. Heyd, E. Brothers, K. N. Kudin, V. N. Staroverov, T. Keith, R. Kobayashi, J. Normand, K. Raghavachari, A. Rendell, J. C. Burant, S. S. Iyengar, J. Tomasi, M. Cossi, J. M. Millam, M. Klene, C. Adamo, R. Cammi, J. W. Ochterski, R. L. Martin, K. Morokuma, O. Farkas, J. B. Foresman and D. J. Fox, Gaussian 09, Rev. C.01, Gaussian, Inc., Wallingford CT, 2010 Search PubMed.
- J. Schmidt and W. Polik, WebMO LLC, Holland, MI USA, 2013 Search PubMed.
- M. N. Ahmed, K. A. Yasin, K. Ayub, T. Mahmood, M. N. Tahir, B. A. Khan, M. Hafeez and M. Ahmed, J. Mol. Struct., 2016, 1106, 430–439 CrossRef CAS.
- https://www.rcsb.org/structure/1D66.
- F. Perveen, N. Arshad, R. Qureshi, J. Nowsherwan, A. Sultan, B. Nosheen and H. Rafique, PLoS One, 2018, 13, e0205764 CrossRef PubMed.
- J. A. Kraunsoe, T. D. Claridge and G. Lowe, Biochemistry, 1996, 35, 9090–9096 CrossRef CAS PubMed.
- G. D. Liyanaarachchi, J. K. R. R. Samarasekera, K. R. R. Mahanama and K. D. P. Hemalal, Ind. Crops Prod., 2018, 111, 597–605 CrossRef CAS.
- A. Saeed, D. Shahzad, F. A. Larik, P. A. Channar, H. Mahfooz, Q. Abbas, M. Hassan, H. Raza, S.-Y. Seo and G. Shabir, J. Pharmacol., 2017, 12, 210–215 Search PubMed.
- A. R. S. Butt, M. A. Abbasi, S. Z. Siddiqui, M. Hassan, H. Raza, S. A. A. Shah and S.-Y. Seo, Bioorg. Chem., 2019, 86, 459–472 CrossRef CAS PubMed.
- C. V. K. Reddy, D. Sreeramulu and M. Raghunath, Food Res. Int., 2010, 43, 285–288 CrossRef.
- A. Saeed, P. A. Mahesar, P. A. Channar, F. A. Larik, Q. Abbas, M. Hassan, H. Raza and S. Y. Seo, Chem. Biodiversity, 2017, 14, e1700035 CrossRef PubMed.
- F. L. Hirshfeld, Theor. Chim. Acta, 1977, 44, 129–138 CrossRef CAS.
- M. A. Spackman and D. Jayatilaka, CrystEngComm, 2009, 11, 19–32 RSC.
- P. Venkatesan, S. Thamotharan, A. Ilangovan, H. Liang and T. Sundius, Spectrochim. Acta, Part A, 2016, 153, 625–636 CrossRef CAS PubMed.
- J. J. McKinnon, D. Jayatilaka and M. A. Spackman, Chem. Commun., 2007, 3814–3816 RSC.
- V. R. Hathwar, M. Sist, M. R. Jørgensen, A. H. Mamakhel, X. Wang, C. M. Hoffmann, K. Sugimoto, J. Overgaard and B. B. Iversen, IUCrJ, 2015, 2, 563–574 CrossRef CAS PubMed.
- A. Saeed, S. Rehman, P. A. Channar, F. A. Larik and S. Y. Seo, J. Taiwan Inst. Chem. Eng., 2017, 77, 54–63 CrossRef CAS.
- F. A. Larik, M. S. Shah, A. Saeed, H. S. Shah and J. Iqbal, Int. J. Biol. Macromol., 2018, 116, 144–150 CrossRef CAS PubMed.
- S. Rehman, A. Saeed, G. Saddique, P. A. Channar, F. A. Larik, Q. Abbas, M. Hassan, H. Raza, T. A. Fattah and S. Y. Seo, Bioorg. Med. Chem., 2018, 26(1223), 3707–3715 CrossRef PubMed.
- S. S. Hamdani, B. A. Khan, A. Saeed, F. A. Larik, S. Hameed, P. A. Channar, K. Ahmad, E. U. Mughal, Q. Abbas, N. Amin, S. A. Ghumro, H. Maitlo, M. Hassan, H. Raza and S. Seo, Arch. Pharm., 2019, 352(8), e1900061 CrossRef PubMed.
- F. A. Micássio, M. K. Luciana, O. B. Leandro, B. S. Gabriela and M. L. V. Yara, Free Radical Biol. Med.1, 2018, 1151, 421–435 Search PubMed.
- S. I. Farooqi, N. Arshad, F. Perveen, P. A. Channar, A. Saeed and A. Javeed, Arch. Biochem. Biophys., 2019, 666, 83–98 CrossRef CAS PubMed.
- S. I. Farooqi, N. Arshad, P. A. Channar, F. Perveen, A. Saeed, F. A. Larik and A. Javeed, J. Photochem. Photobiol., B, 2018, 189, 104–118 CrossRef CAS PubMed.
- M. Hussain, N. Arshad, R. Ujan, A. Saeed, P. A. Channar, F. Perveen, F. A. Larik, S. I. Farooqi, Z. Hussain and T. Hökelek, J. Mol. Struct., 2020, 1205, 127496 CrossRef CAS.
- N. Arshad, M. H. Bhatti, S. I. Farooqi, S. Saleem and B. Mirza, Arabian J. Chem., 2016, 9, 451–462 CrossRef CAS.
- A. M. Mansour and M. S. Ragab, RSC Adv., 2019, 9, 30879–30887 RSC.
- H. Nawaz, S. Rauf, K. Akhtar and A. M. Khalid, Anal. Biochem., 2006, 354, 28–34 CrossRef CAS PubMed.
- M. Ibrahim, I. Shehatta and A. Al-Nayeli, J. Pharm. Biomed. Anal., 2002, 28, 217–225 CrossRef CAS PubMed.
- M. Aslanoglu, Anal. Sci., 2006, 22, 439–443 CrossRef CAS PubMed.
- M. Hussain, N. Arshad, R. Ujan, A. Saeed, P. A. Channar, F. Perveen, F. A. Larik, S. I. Farooqi, Z. Hussain, T. Hökelek, M. Kaur and J. P. Jasinski, J. Mol. Struct., 2020, 1205, 127496 CrossRef CAS.
- N. Shahabadi and S. Mohammadi, Bioinorg. Chem. Appl., 2012, 2012, 571913 Search PubMed.
- S. Jahani, M. Khorasani-Motlagh and M. Noroozifar, J. Biomol. Struct. Dyn., 2016, 34, 612–624 CrossRef CAS PubMed.
- N. K. Janjua, A. Shaheen, A. Yaqub, F. Perveen, S. Sabahat, M. Mumtaz, C. Jacob, L. A. Ba and H. A. Mohammed, Spectrochim. Acta, Part A, 2011, 79, 1600–1604 CrossRef CAS PubMed.
Footnote |
| † Electronic supplementary information (ESI) available: NMR spectra & CIF report. CCDC 1986282. For ESI and crystallographic data in CIF or other electronic format see DOI: 10.1039/d0ra02501a |
|
| This journal is © The Royal Society of Chemistry 2020 |
Click here to see how this site uses Cookies. View our privacy policy here. 
 Open Access Article
 This Open Access Article is licensed under a Creative Commons Attribution-Non Commercial 3.0 Unported Licence
 *a,
Mamoona Rafiqb,
Rabail Ujanc,
Aamer Saeed
*a,
Mamoona Rafiqb,
Rabail Ujanc,
Aamer Saeed