
 Open Access Article
 This Open Access Article is licensed under a Creative Commons Attribution-Non Commercial 3.0 Unported Licence
A nontoxic biocompatible nanocomposite comprising black phosphorus with Au–γ-Fe2O3 nanoparticles
Atanu Naskar a,
Semi Kimb and
Kwang-sun Kim*a
a,
Semi Kimb and
Kwang-sun Kim*a
aDepartment of Chemistry and Chemistry Institute for Functional Materials, Pusan National University, Busan 46241, South Korea. E-mail: kwangsun.kim@pusan.ac.kr; Tel: +82-51-510-2241
bImmunotherapy Research Center, Korea Research Institute of Bioscience and Biotechnology, Daejeon, 34141, South Korea
First published on 23rd April 2020
Abstract
Black phosphorus (BP) has emerged as the latest 2D material within the post-graphene scenario, which can be used for various biomedical applications. In this study, we reported a promising nanocomposite material, which could be assembled with Au nanoparticles and γ-Fe2O3 nanoparticles on BP nanosheets (AIB), and studied its biocompatibility that promises to be useful for various biomedical applications. The synthesis of the Au–γ-Fe2O3 nanomaterial was attained through low-temperature solution synthesis and the exfoliation of BP nanosheets was performed through a liquid ultrasonication process. The individual components were then composited by ultrasonication and stirring. X-ray diffraction and transmission electron microscopic analyses confirmed the existence of Au and γ-Fe2O3 nanoparticles (NPs) assembled over BP nanosheets. Moreover, the surface chemical composition and valence state of the elements present in the AIB nanocomposite were evaluated with the help of an X-ray photoelectron spectroscopy study. The AIB nanocomposite exhibited excellent biocompatibility with HCT-15 cells after evaluating through WST assay. Therefore, the excellent biocompatible nature of this BP nanocomposite could be beneficial for various potential biomedical applications.
1. Introduction
Numerous studies based on nanostructured composites have been performed in application-oriented research.1–3 The main explanation for such extensive research works with nanostructured composites is that they enable researchers to combine materials with different physical and chemical properties in order to expand the range of different applications from one single material. As an example, the combination of magnetic and metallic nanomaterials has been used in applications such as catalysis, biosensing, magnetic resonance imaging, magnetic fluid hyperthermia, and drug delivery.4–7After the immense success of graphene, researchers recently focused on a wide range of thin 2D materials, such as boron nitride, graphite carbon nitride, MXenes, bismuth, zeolitic imidazolate framework (ZIF), different types of carbon based nanoparticles and quantum dots.8–12 The reasons behind their increasing use for biomedical application can be attributed to their unique physicochemical properties, surface-to-volume ratio, atomic thickness, controllable electronic and mechanical properties.9 Moreover, they are biologically safe or can be functionalized to make them biocompatible after the interaction with cell and tissues which makes them ideal for their use in biomedical field.10
In the midst of this emerging post-graphene scenario, black phosphorus (BP) has emerged as a new 2D nanomaterial, which can be easily used for various biomedical applications, such as biosensing, drug delivery, and bioimaging.13 The advantage of BP over other 2D materials is that BP demonstrates a wide range of band gap (0.3–2.0 eV) compared to the zero band gap of graphene, that can be tuned by adjusting the layer number. This optical property allows BP to demonstrate a broad absorption across ultraviolet, visible, and infrared light spectra and renders it an ideal candidate for biosensing.13 Its ambipolar characteristic enables the detection of both positively and negatively charged biomolecules. It is thermodynamically stable at room temperature and non-toxic.14 Owing to these unique physical, optical, and electrochemical properties, BP is considered an ideal candidate for different biomedical applications such as drug delivery, bioimaging, and biosensor.
Among various metal and metal oxides, Au and γ-Fe2O3 have been used repeatedly for various biomedical applications such as drug delivery, bioimaging and biosensors, due to their favorable physiochemical properties in cell system.6,15 In addition, several attempts have been made to hybridize these nanomaterials (Au and γ-Fe2O3) in order to achieve the resulting synergistic properties.16 In this regard, the synergistic property of Au and γ-Fe2O3 with BP will be of great interest to biomedical researchers as all of them have beneficial biomedical properties for biomedical applications. However, at first the biocompatibility of these nanocomposites for any potential use in cell system, need to be checked. It is also noted that the biocompatibility study of Au and γ-Fe2O3 immobilized on BP is still not established.
In this study, an efficient nanoplatform based on Au–γ-Fe2O3–BP nanocomposite was successfully synthesized through low-temperature solution synthesis process. Further, biocompatibility evaluation of the Au–γ-Fe2O3–BP nanocomposite by WST assays against human colon cancer cell lines (HCT-15) showed that the nanocomposite was non-toxic even at a concentration of ∼200 μg mL−1. To the best of our knowledge, this is the first report on the synthesis of biocompatible nanocomposite Au–γ-Fe2O3–BP. This newly synthesized materials can be used in various biomedical applications such as drug delivery and biosensor.
2. Experimental section
2.1. Synthesis of γ-Fe2O3 (IO) nanoparticles
The process for the synthesis of γ-Fe2O3 (IO) was adopted from a previously reported work.17 Initially, 2.5 g of iron(III) nitrate nonahydrate (Fe(NO3)3·9H2O, Merck, ≥98%) was uniformly dispersed in 200 mL of de-ionized water with continuous stirring. In another beaker, 0.5 g of NaBH4 was added in 25 mL of 3.5% NH4OH solution. After that it was mixed with iron nitrate solution and the precursors were kept stirring at ∼100 °C for 2 h for the formation of γ-Fe2O3 (IO) nanoparticles. The solid materials were then separated out with the help of centrifugation. Finally, the products were washed with double distilled water and ethanol for several times by centrifugation and the samples were dried in an air oven at ∼60 °C for 3 h.2.2. Synthesis of Au–γ-Fe2O3 (AIO) nanoparticles
The AIO nanoparticles were prepared as follows: 300 mg of IO nanoparticles were dispersed in 50 mL of deionized water. This mixture was ultrasonicated for 10 min and mixed with 3.0 mL of aqueous 0.05 M chloroauric acid (HAuCl4·3H2O, Au ≥ 49%) by stirring for 30 min, followed by the addition of 0.3 g of NaBH4 in 10 mL of deionized water. The dispersed materials (precursors) were ultrasonicated for 15 min and stirred continuously for 2 h, resulting in the formation of AIO nanoparticles. The solid materials were further separated out by centrifugation, washed several times with deionized water and ethanol, and pelleted by centrifugation. Finally, the samples were dried in an air oven at ∼60 °C for 4 h.2.3. Synthesis of black phosphorus nanosheets (BP NSs) and Au–γ-Fe2O3-black phosphorus (AIB) nanocomposite
![[thin space (1/6-em)]](https://www.rsc.org/images/entities/char_2009.gif) 000 rpm for 10 min) and dispersed in water as a brown solution to store at 4 °C until further use.
000 rpm for 10 min) and dispersed in water as a brown solution to store at 4 °C until further use.2.4. Characterization
The diffraction patterns of the IO, AIO, and AIB samples were obtained through X-ray diffraction (XRD) using an X-ray diffractometer (D8 Advance with DAVINCI design X-ray diffraction unit, Bruker) with nickel-filtered Cu Kα radiation source (λ = 1.5406 Å) in the 2θ range of 20–80°. Moreover, transmission electron microscopy (TEM; Bruker Nano GmbH) that employed carbon-coated 300 mesh Cu grids for the placement of IO, AIO, and AIB samples was employed for microstructural analysis. The AXIS Supra X-ray photoelectron spectroscopy (XPS) microprobe surface analysis system was used to assess the representative sample of AIB by scanning in the binding energy range of 200–1200 eV to determine the chemical state of elements. The C 1s peak position at 284.5 eV was used as the binding energy reference.2.5. WST assay
HCT-15 cells (colon cancer) were purchased from the American Type Culture Collection (Manassas, VA, USA) and maintained in RPMI1640 with 10% of fetal bovine serum at 37 °C in 5% CO2. The cell viability was determined through the colorimetric WST assay (Ez-Cytox; DoGenBio, Seoul, Korea). The cells were seeded into 96-well plates at a density of 4000 cells per well and incubated for 24 h. They were further incubated for 24 h or 48 h in the presence of IO/AIO/AIB samples with a concentration of 10–200 μg mL−1 in 0.1% dimethyl sulfoxide. The cells were then incubated with WST reagent (one-tenth of the medium volume), and the amount of formazan dye formed was determined by measuring the absorbance at 450 nm using a spectrophotometric microplate reader (BMG LABTECH GmbH, Ortenber, Germany). The morphology of HCT-15 cells treated with black phosphorus was imaged using a phase-contrast microscope (Leica DM IL LED; Leica, Wetzlar, Germany).3. Results and discussion
3.1. Material properties
 | ||
| Fig. 1 X-ray diffraction patterns of IO, AIO and AIB samples. | ||
The average crystallite size (D) of γ-Fe2O3 and Au were estimated along (311) crystal plane of γ-Fe2O3 and (111) crystal plane of Au, respectively by using Debye–Scherrer's eqn (1).
|
D = kλ/βcosθ,
| (1) |
The measured ‘D’ values of γ-Fe2O3 in IO, Au–γ-Fe2O3 (AIO), and Au–γ-Fe2O3-black phosphorus (AIB) samples were ∼11.0 nm, ∼11.0 nm, and ∼11.0 nm, respectively. Likewise, the measured ‘D’ values of Au in AIO and AIB are ∼19.0 nm. Thus, the crystallite size of γ-Fe2O3 in AIO and AIB, remained identical after the incorporation of Au and black phosphorus (BP), respectively. Therefore, no effect on the change of crystallite size of γ-Fe2O3 was found in AIO and AIB. The same result can be seen in Au nanoparticle size after the incorporation of BP in AIB sample where there is no change of Au nanoparticle in AIB sample.
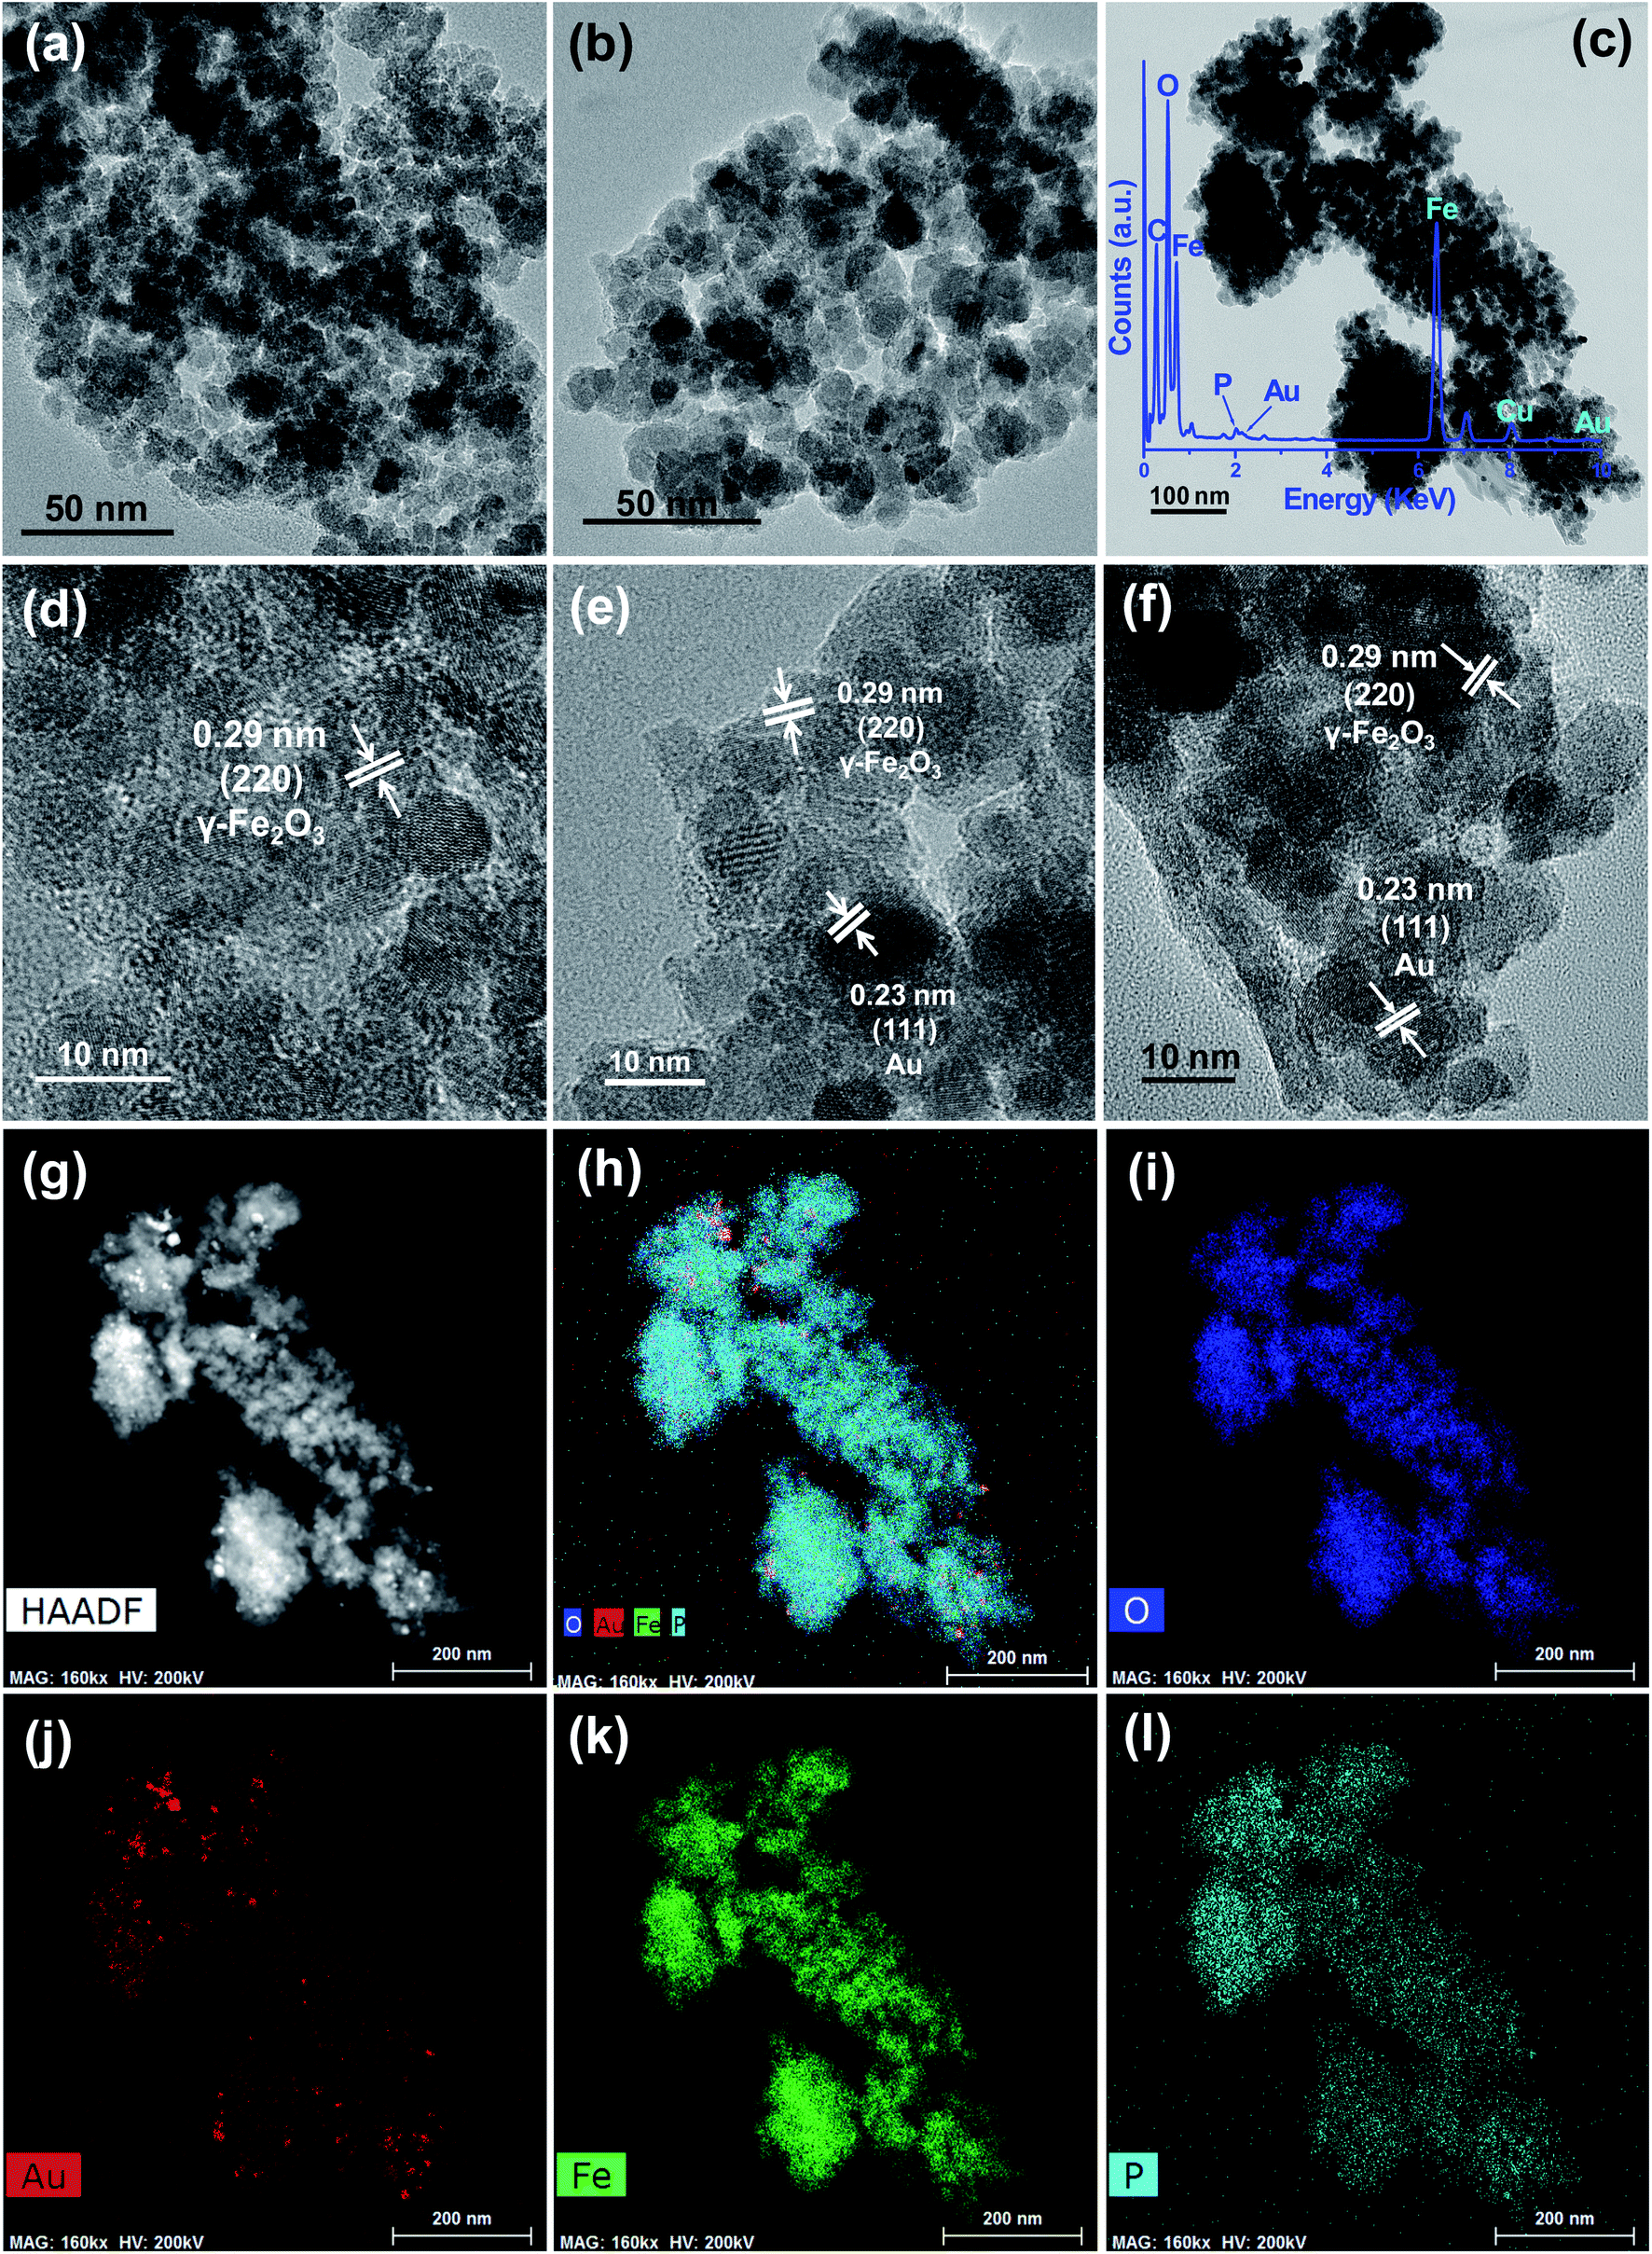 | ||
| Fig. 2 TEM image of IO (a), AIO (b), AIB (c) and high-resolution TEM image of IO (d), AIO (e), AIB (f) sample. TEM-energy-dispersive X-ray spectrum (c inset), (g) HAADF image, and elemental mappings of (h) composite, (i) O, (j) Au, (k) Fe, and (l) P from AIB sample. | ||
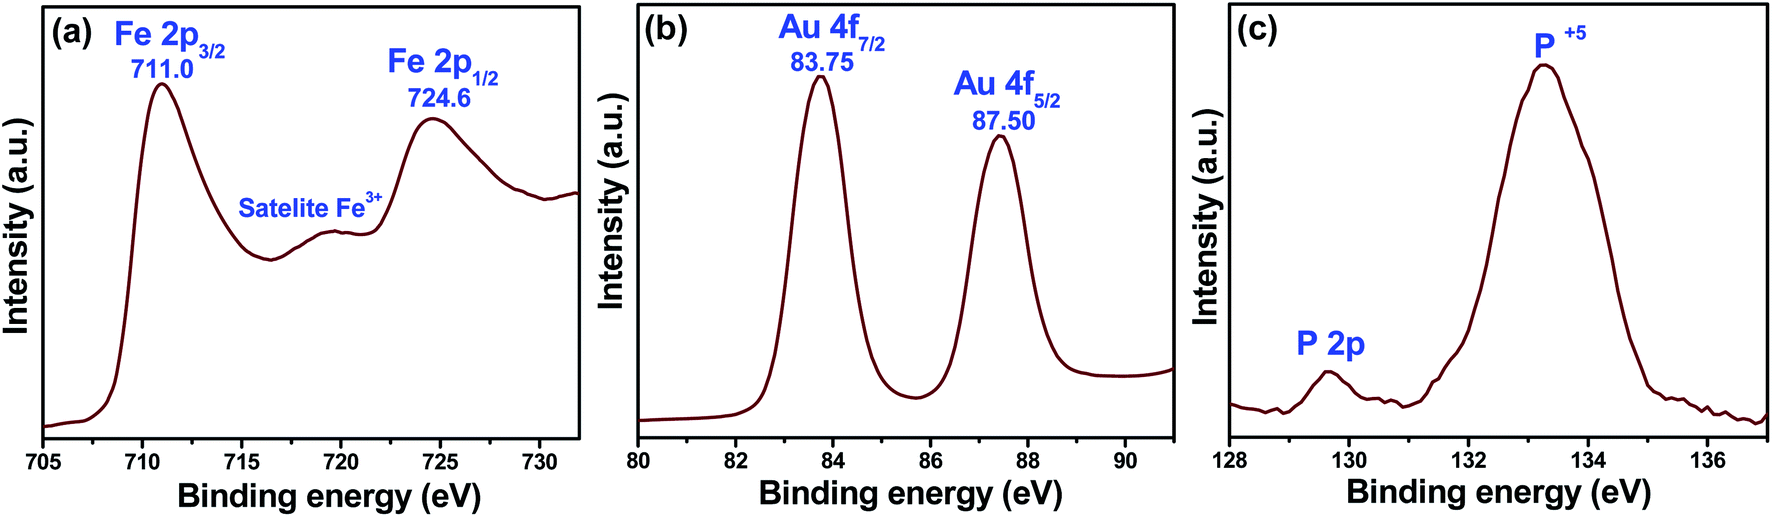 | ||
| Fig. 3 X-ray photoelectron spectroscopy binding energy spectra of AIB (a) Fe 2p, (b) Au 4f, and (c) P 2p core levels. | ||
3.2. In vitro cytotoxicity
The cell viability from the in vitro cellular cytotoxicity was assessed using the WST assay of HCT-15 cells (colon cancer) by varying the concentrations of the IO, AIO, and AIB samples. The corresponding results are shown in Fig. 4. Each bar graph in this figure represents the average of triplicate measurements. It can be clearly observed that the cell viability of the AIB nanocomposite is comparable to that of IO nanoparticles, and the nanocomposite is non-toxic even after attaining the concentration of 200 μg mL−1. Therefore, the use of BP with Au–γ-Fe2O3 nanoparticles shows relatively less harmful effects in human cells due to the biocompatible nature of BP. It is reasonable to state that the AIB nanocomposite is biocompatible and can be effective in various biomedical applications such as drug delivery.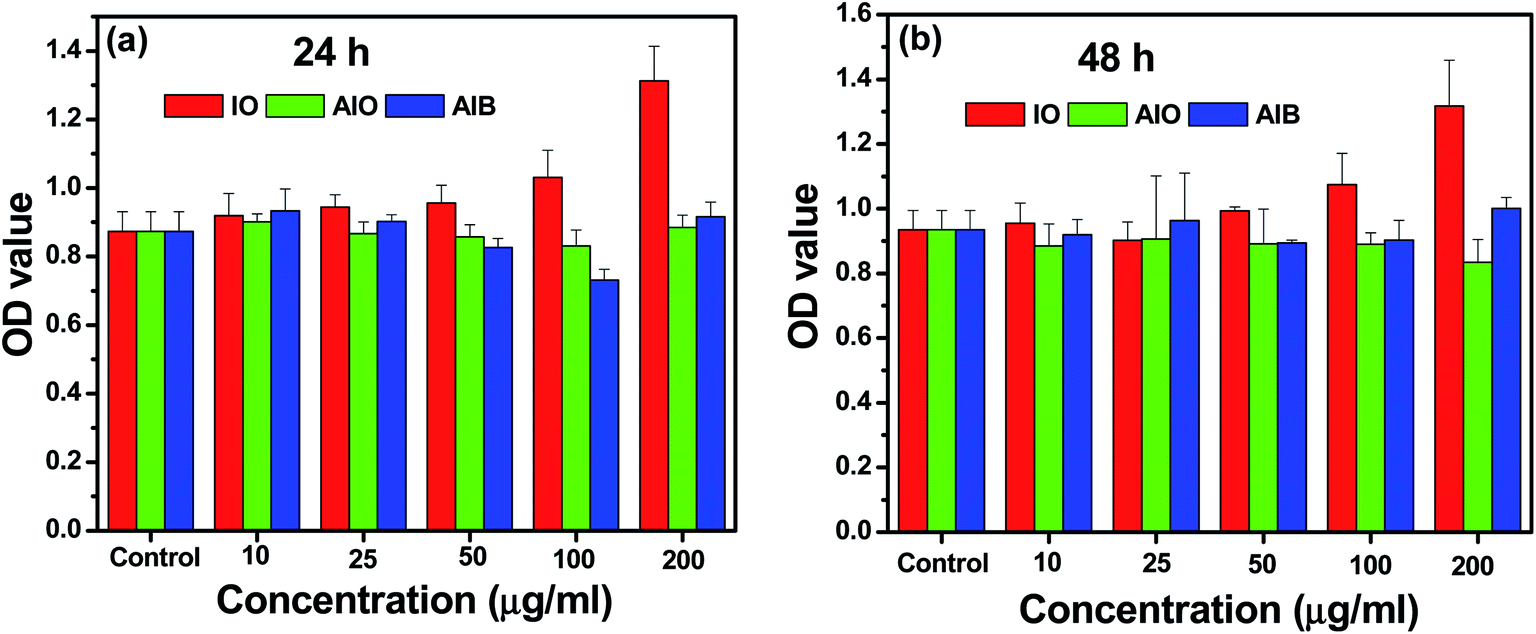 | ||
| Fig. 4 Cell viability from in vitro cellular cytotoxicity, WST assay of HCT-15 cells (colon cancer) for IO, AIO, and AIB samples with varied concentrations. The error bars represent ±SD (P < 0.05). | ||
4. Conclusions
In this study, we developed a novel synthesized nanocomposite of Au–γ-Fe2O3–BP, called AIB, by adopting low-temperature solution synthesis process. The method of preparation was simple, rapid, and easily reproducible. XRD, TEM, and XPS characterization techniques were used to evaluate the material properties of the samples. The synthesized nanocomposite showed excellent cell viability even at 200 μg mL−1 concentration. This cost-effective simple synthesized nanocomposite can be useful for a wide range of biomedical applications.Conflicts of interest
The authors declare no competing financial interest.Acknowledgements
This work was supported by the National Research Foundation of Korea (NRF) grant funded by the Korean government (MSIT) [grant number 2018R1D1A1B07040941]. The authors would also like to thank Prof. Hyun Deok Yoo (Department of Chemistry, Pusan National University) for offering support to measure the X-ray diffraction characterization.References
- S. Pattnaik, K. Swain and Z. Lin, J. Mater. Chem. B, 2016, 4, 7813–7831 RSC.
- C. Yang, H. Wei, L. Guan, J. Guo, Y. Wang, X. Yan, X. Zhang, S. Wei and Z. Guo, J. Mater. Chem. A, 2015, 3, 14929–14941 RSC.
- A. P. Subramanian, S. K. Jaganathan and E. Supriyanto, RSC Adv., 2015, 5, 72638–72652 RSC.
- S. A. C. Carabineiro, N. Bogdanchikova, P. B. Tavares and J. L. Figueiredo, RSC Adv., 2012, 2, 2957–2965 RSC.
- K. Li, Y. Lai, W. Zhang and L. Jin, Talanta, 2011, 84(3), 607–613 CrossRef CAS PubMed.
- S. Sabale, P. Kandesar, V. Jadhav, R. Komorek, R. K. Motkuri and X.-Y. Yu, Biomater. Sci., 2017, 5, 2212–2225 RSC.
- S. Palanisamy and Y.-M. Wang, Dalton Trans., 2019, 48, 9490–9515 RSC.
- A. Naskar and K.-s. Kim, Microb. Pathog., 2019, 137, 103800 CrossRef PubMed.
- M. Soleymaniha, M. -A. Shahbazi, A. R. Rafieerad, A. Maleki and A. Amiri, Adv. Healthcare Mater., 2019, 8, 1801137 CrossRef PubMed.
- K. D. Patel, R. K. Singh and H.-W. Kim, Mater. Horiz., 2019, 6, 434–469 RSC.
- M.-A. Shahbazi, L. Faghfouri, M. P. A. Ferreira, P. Figueiredo, H. Maleki, F. Sefat, J. Hirvonen and H. A. Santos, Chem. Soc. Rev., 2020, 49, 1253–1321 RSC.
- Y.-P. Ho and K. W. Leong, Nanoscale, 2010, 2(1), 60–68 RSC.
- M. Luo, T. Fan, Y. Zhou, H. Zhang and L. Mei, Adv. Funct. Mater., 2019, 29(13), 1808306 CrossRef.
- S. Anju, J. Ashtami and J. P. V. Mohanan, Mater. Sci. Eng., C, 2019, 97, 978–993 CrossRef CAS PubMed.
- N. V. S. Vallabani and S. Singh, 3 Biotech, 2018, 8, 279 CrossRef PubMed.
- F. Parnianchi, M. Nazari, J. Maleki and M. Mohebi, Int. Nano Lett., 2018, 8(4), 229–239 CrossRef CAS.
- Z. Heger, N. Cernei, I. Blazkova, P. Kopel, M. Masarik, O. Zitka, V. Adam and R. Kizek, Chromatographia, 2014, 77, 1415–1423 CrossRef CAS.
- J. Ouyang, R.-Y. Liu, W. Chen, Z. Liu, Q. Xu, K. Zeng, L. Deng, L. Shen and Y.-N. Liu, J. Mater. Chem. B, 2018, 6, 6302–6310 RSC.
- A. Naskar, S. Bera, R. Bhattacharya, S. S. Roy and S. Jana, Biointerface Res. Appl. Chem., 2018, 8(6), 3751–3757 CAS.
- A. Naskar, S. Bera, R. Bhattacharya, S. S. Roy and S. Jana, J. Alloys Compd., 2018, 734, 66–74 CrossRef CAS.
- J. Song, J. Wang, X. Lin, J. He, H. Liu, Y. Lei and Z. Chu, ChemElectroChem, 2017, 4, 2373–2377 CrossRef CAS.
- J. A. Cuenca, K. Bugler, S. Taylor, D. Morgan, P. Williams, J. Bauer and A. Porch, J. Phys.: Condens. Matter, 2016, 28, 106002 CrossRef PubMed.
- R. Gusmão, Z. Sofer, D. Bouša and M. Pumera, ACS Appl. Energy Mater., 2018, 1, 503–509 CrossRef.
| This journal is © The Royal Society of Chemistry 2020 |