 Open Access Article
Copper–tripeptides (cuzymes) with peroxidase-mimetic activity
Le Truc Nguyen,
Wing Fat Ho and
Kun-Lin Yang *
*
Department of Chemical and Biomolecular Engineering, National University of Singapore, 4 Engineering Drive 4, Singapore 117585. E-mail: cheyk@nus.edu.sg
First published on 5th May 2020
Abstract
Peroxidases are enzymes that use hydrogen peroxide to oxidize substrates such as 2,2-azino-bis(3-ethylbenzothiazoline-6-sulfonic acid) (ATBS). In this study, we showed that copper–tripeptide complexes (“cuzymes”) also exhibited peroxidase-like activities. Different cuzymes could be formed by using various tripeptide ligands, such as GGG, GGH or HGG. However, the peroxidase-like activity of cuzymes depends on the sequence of the tripeptide (Cu–GGG > Cu–HGG > Cu–GGH). When ABTS was used as the substrate, the activity of Cu–GGG was 326 ± 1.5 U mg−1 which was 2.5 times higher than that of horseradish peroxidase (HRP). Copper–tripeptide complexes were also used to degrade trypan blue dye. By using 0.2 mM Cu–GGG and 0.2% H2O2, 200 μM trypan blue could be degraded in 15 min at 50 °C. The degradation reaction followed second-order kinetics; the reaction rate was proportional to both H2O2 concentration and the copper–tripeptide concentration, but it was independent of the trypan blue concentration. Because copper–tripeptides catalyzed the oxidation reactions involving H2O2 effectively, they may have potential applications in biochemical assays and environmental remediation.
1. Introduction
Peroxidases catalyze the oxidation of organic and inorganic compounds by using hydrogen peroxide as an oxidizer in most living organisms.1,2 Peroxidases from different sources have numerous applications in immunoassays, biosensors, and medical diagnosis, etc. Peroxidases can also be used as biocatalysts for degradation of environmental pollutants such as phenols, chlorophenols and cresols,3 decolourization of azo-dyes,4 or reduction of ferricyanides and ascorbates into harmless compounds.5 Among the peroxidases, horseradish peroxidase (HRP) has been widely used in diagnostic kits, chemical synthesis, and industrial wastewater treatments.6 However, HRP is sensitive to temperature and pH, and the cost is high. These factors limit the use of HRP in certain industrial applications.7 To address these issues, a lot of efforts have been devoted to creating artificial enzymes for mimicking peroxidase activity by using metal nanoparticles8–11 or metal complexes.12–14 For example, metal complexes which exhibit peroxidase,15 oxidase, monooxygenase, or dioxygenase activities have been reported in the literature.16 These artificial enzymes are able to replace the biological enzymes in many applications due to their low cost, high stability and high activity.17,18A common element in artificial enzymes is a metal-ion center which has multiple oxidation states. Among the heavy metal ions, copper ion receives a lot of attention because copper ion has multiple oxidation states (Cu0, CuI, CuII, and CuIII). Moreover, a full redox cycle can be completed by using hydrogen peroxide as an oxidizer and reducer at different pH.19–23 The use of copper ion to construct an artificial peroxidase has been reported in several studies.19–24 For example, copper nanoparticles were dispersed in a carbon matrix as a catalyst for oxidizing 3,3′,5,5′-tetramethylbenzidine (TMB) to form a blue-color product in the presence of H2O2.22 Wang et al. reported that Cu2(OH)3Cl–CeO2 nanocomposite exhibited peroxidase-like activity and used it for the detection of glucose, cholesterol, and H2O2.25
In other studies, copper complexes were used as artificial enzymes to catalyze oxidation reactions with H2O2. For instance, Pugia et al. reported the formation of a copper–creatinine complex with peroxidase activity for measuring creatinine in urine.26 By using the catalytic properties of the copper–creatinine complex, Singh and co-workers developed a sensor for the detection of DNA.15 Thawari and co-worker reported the formation of β-lactoglobulin-Cu nanoflower by reacting CuII with proteins under different pH conditions. They also showed that the β-lactoglobulin-Cu flower exhibited peroxidase activity in the presence of ABTS and H2O2.24 Moreover, CuII was able to complex with DNA to form artificial enzymes.27–29 For example, Yang and co-workers reported peroxidase-like activity of CuII–DNA complexes.29 Chen's group reported peroxidase activity of DNA–copper clusters and used them for detecting hepatitis B virus with high sensitivity.30
In our previous studies, oligopeptides were used as ligands to complex with copper ions for biological sensing applications.31–33 In this work, we further investigated whether copper–tripeptide complexes also exhibit peroxidase-like activities in the presence of H2O2. We chose tripeptides as a model ligand because they can complex with copper ions through deprotonation of amide nitrogen to form a highly stable copper complex. Moreover, the tripeptide sequences can be tailor-made by using different amino acids to render a large combinational library. This work was partly inspired by copper metalloenzymes in which a copper ion was bound to a long peptide with one or more coordination sites. The copper ion at the active center could change their oxidation states during a catalytic reaction. However, their catalytic activities also depend on the amino acid residues that complex with the copper ion. Thus, we hypothesized that it was possible to form a wide variety of artificial peroxidases by screening different tripeptide sequences.
2. Experiment
2.1 Materials
Copper acetate monohydrate, diglycyl-glycine (GGG), trypan blue powder, hydrogen peroxide (30%), horseradish peroxidase (lyophilized powder), potassium phosphate monobasic, 2,2-azino-bis(3-ethylbenzothiazoline-6-sulfonic acid) (ABTS), tert-butanol and sodium hydroxide were purchased from Sigma-Aldrich (Singapore). Sodium acetate was purchased from Alfa Aesar (Singapore). Hydrochloric acid was purchased from Fisher (Singapore). Histidyl-glycyl-glycine (HGG) and glycyl-glycyl-histidine (GGH) were purchased from BACHEM (Switzerland). All materials were used as received without further purification.2.2 Formation of copper–tripeptide complexes
Firstly, tripeptide solutions (100 mM) were prepared by dissolving 189.17 mg of GGG, 269.26 mg of GGH and 269.26 mg of HGG in 10.0 mL of deionized water, respectively. Secondly, copper acetate solution (100 mM) was prepared by dissolving 199.65 mg of copper acetate monohydrate in 10.0 mL of deionized water. The copper acetate solution was centrifuged at 10![[thin space (1/6-em)]](https://www.rsc.org/images/entities/char_2009.gif) 000 rpm for 3 min to remove all insoluble particles. Then, copper–tripeptide complexes were prepared by mixing a tripeptide solution (100 mM, 10 μL) with the copper acetate solution (100 mM, 10 μL) and deionized water (80 μL). The mixed solution was vortexed before use. Finally, ESI-MS (Bruker, compact) was employed to characterize different types of cuzymes. The ESI-MS was operated in the negative-ion mode. The capillary voltage and endplate offset were set as 3.5 kV and 500 V, respectively. The nebulizer pressure was 0.4 bar and the drying temperature was 200 °C.
000 rpm for 3 min to remove all insoluble particles. Then, copper–tripeptide complexes were prepared by mixing a tripeptide solution (100 mM, 10 μL) with the copper acetate solution (100 mM, 10 μL) and deionized water (80 μL). The mixed solution was vortexed before use. Finally, ESI-MS (Bruker, compact) was employed to characterize different types of cuzymes. The ESI-MS was operated in the negative-ion mode. The capillary voltage and endplate offset were set as 3.5 kV and 500 V, respectively. The nebulizer pressure was 0.4 bar and the drying temperature was 200 °C.
2.3 Degrading of trypan blue by cuzymes
Degradation of trypan blue, an azo dye, in the presence of cuzyme (0.2 mM) was carried out in 4.0 mL of an aqueous solution containing 200 μM of trypan blue and 0.2% of H2O2. One unit (U mg−1) of cuzyme activity was defined as the amount of cuzyme required to degrade 1 μmol of trypan blue per min at 50 °C. The degradation of trypan blue was carried out at 50 °C for 30 min with a stirring speed of 300 rpm. The absorbance of the solution at 595 nm was determined. Degradation percentage (%) of trypan blue was defined as:| Degradation (%) = (A0 − A1)/A0 × 100% | (1) |
2.4 Measurements of cuzyme and HRP activities
Activities of 3 types of cuzymes and HRP were measured by using a chromogenic reaction with ABTS. In each run, cuzyme (10 mM, 20 μL) was added to 980 μL of acetate buffer (0.05 M, pH 4.5) containing ABTS and H2O2. Similarly, HRP (2000 ppm, 25 μL) was added to 975 μL of phosphate solution (0.1 M, pH 5.0) containing ABTS and H2O2. The concentrations of ABTS and H2O2 were maintained at 1 mM and 0.1%, respectively. After 15 min, the final concentration of ABTS* (reaction product) was determined by measuring the absorbance at 420 nm. The extinction coefficient of ABTS* at 420 nm (ε420 nm = 3.6 × 10⁴ M−1 cm−1) was used to determine the concentration of ABTS*.34 One unit (U mg−1) of cuzyme and HRP activities with ABTS was defined as the amount of enzyme/cuzyme required to release 1 μmol of ABTS* per min at room temperature.2.5 Determination of reaction mechanism
To calculate the reaction order and the rate constant of the trypan blue's degradation by cuzyme and H2O2, the degradation reaction of trypan blue was conducted at different temperatures. In each experiment, 0.2 mM of cuzyme was mixed with 4.0 mL of an aqueous solution containing 200 μM of trypan blue and 0.2% of H2O2. The reaction was varied from 25 to 70 °C for 30 min, and the reaction rate was calculated. Each experiment was performed in triplicates. To understand the effect of H2O2 concentration on the degradation of trypan blue, different amounts of H2O2 (0–0.5%) were added to the reaction mixture which contained 200 μM of trypan blue and 0.2 mM of cuzyme. The temperature was maintained at 50 °C. Similarly, the effects of cuzyme, H2O2 concentrations, and pH on the degradation of trypan blue were also studied.3. Results and discussion
3.1 Formation of cuzymes and their peroxidase-mimetic activity
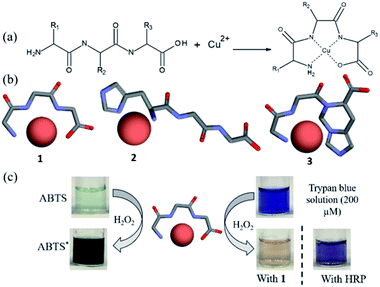
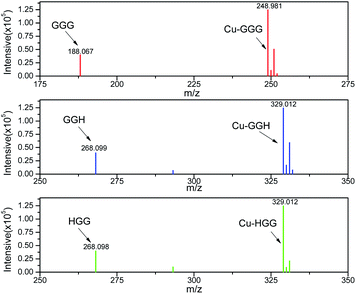
The general concept of forming tripeptides–copper complexes through the deprotonation of peptide bonds and copper ions was shown in Fig. 1a. Replacing different amino acids in the tripeptides led to different types of copper–tripeptide complexes. The copper-ion center coordinated with amino acid residues as in the copper metalloenzymes. Thus, we termed the copper complexes as “cuzymes”. The 3D structures of these cuzymes were shown in Fig. 1b. Table 1 showed that Cu–GGG (1) was a complex formed by CuII and GGG. Cu–HGG (2) and Cu–GGH (3) were CuII complexes formed by HGG and GGH, respectively. The ESI-MS spectra of three cuzymes were shown in Fig. 2. We expected that when a tripeptide ligand coordinated with a copper ion, the amide nitrogen deprotonated and lost 2 hydrogen atoms. In addition, the carboxylic acid lost 1 hydrogen atom due to dissociation. Therefore, the predicted molecular weights for 1, 2, and 3 were 249.6, 329.8, and 329.8 a.u., respectively. By comparing the major peaks in the ESI-MS spectra with the molecular weights, we concluded that the 1![[thin space (1/6-em)]](https://www.rsc.org/images/entities/char_2009.gif) :
:![[thin space (1/6-em)]](https://www.rsc.org/images/entities/char_2009.gif) 1 copper–tripeptide complexes were the dominant species.
1 copper–tripeptide complexes were the dominant species.
| Enzyme/cuzyme | R1 | R2 | R3 | Activity (ABTS) U mg−1 | Activity (trypan blue) U g−1 |
|---|---|---|---|---|---|
| 1 | H | H | H | 326 ± 1.5 | 543 ± 4.2 |
| 2 | Histidine | H | H | 287 ± 1.4 | 478 ± 4.1 |
| 3 | H | H | Histidine | 134 ± 1.1 | 229 ± 1.3 |
| HRP | 130 ± 0.8 | N/A |
To study their peroxidase mimetic activity, 0.2 mM of cuzyme was added to an aqueous solution containing ABTS (1 mM), a common substrate for peroxidase such as horseradish peroxidase (HRP). Subsequently, H2O2 (0.2%) was added to the solution and incubated for 15 min at room temperature. Fig. 1c showed that the solution turned dark green in the presence of 1. However, in the absence of 1, no color change was observed. The result showed that 1 exhibited the peroxidase-like activity. The activity of 1 against HRP was estimated to be 326 ± 1.5 U mg−1 (Table 1), which was approximately 2.5 times higher than that of HRP (130 ± 0.8 U mg−1). Because of different ligands complex with CuII with varying degree of strength and geometry,35 we also measured catalytic activities of cuzymes 2 and 3, which contained an histidine group in the tripeptide ligand. Table 1 showed that both cuzymes 2 and 3 exhibited peroxidase-like activity at 287 ± 1.4 U mg−1 and 134 ± 1.1 U mg−1, respectively, but their activities were lower than that of 1. The result showed that the amino acid sequence of the tripeptide determined the activity of the cuzymes.
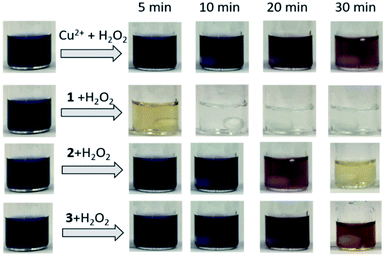
To test the substrate specificity of cuzymes, trypan blue (200 μM) was chosen as the substrate for cuzymes. Trypan blue is an azo dye used in cell staining. It has an intense blue color with an absorption maximum at 595 nm, which can be used to determine its concentration. The degradation of trypan blue using cuzyme and HRP were shown in Fig. 1c. The dark blue solution of trypan blue changed to a pink color in 15 min when 1 was used. In contrast, if HRP and 0.2% of H2O2 were used, then the solution only turned to purple. The result suggested that the activity of 1 against trypan blue was also higher than HRP. To increase the activity of cuzymes against trypan blue, the reaction temperature was raised to 50 °C. For comparison, we used cuzymes 1, 2, 3 and free copper ions as catalysts. Fig. 3 showed that when 1 was used, trypan blue was completely degraded and the solution became colorless in 10 min. In contrast, when 2 and 3 were used, the solution did not turn transparent even after 30 min. Similarly, when free copper ions were used, the solution only slightly decolorized after 30 min. Based on the absorbance value at 595 nm and the reaction rate in the first 10 min, activities of 1, 2 and 3 against trypan blue were 543 ± 4.2, 478 ± 4.1 and 229 ± 1.3 (U g−1), respectively. For free copper ions, the activity was 249 ± 6.1 U g−1. The result suggested that the tripeptide sequence played an important role in the activity of cuzymes. Among the three tripeptides tests, GGG was the best ligand to complex with free copper ions. Substituting one of the amino acids with histidine led to a decrease in the activity. A possible reason was that the coordination between copper ions and histidines may block the binding sites in the catalyst.36 Cupric ions (CuII) have six coordination sites. When it complexed with GGG, four of the coordination sites complexed with one N-terminus α-amino group, two amide nitrogens through deprotonation, and one coordination site complexed with a carbonyl group. Thus, there were still two coordination sites in the axial position to complex with H2O2. In the case of HGG and GGH, the imidazole side chain of the histidine has a high affinity for cupric ion, and it may complex with cupric ions through an additional coordination site to form a highly stable copper complex. As a result, only one coordination site was able to bind to H2O2. The oxidation of histidine due to the H2O2 may also reduce the catalytic activity in 2 and 3 with the HGG and GGH ligands.37
3.2 Comparison of cuzymes and HRP
To compare the performance of cuzymes and HRP, various concentrations of ABTS (from 0.1 mM to 10 mM) were reacted with 50 ppm of 1 (or HRP) and H2O2 at room temperature. The concentration of H2O2 was fixed at 0.2%. The Michaelis constant Km and the maximum rate constant Vmax of 1 and HRP were determined by using the Lineweaver–Burk equation shown below:
 | (2) |
Fig. 4a showed the effect of ABTS concentration on the initial rate of the reaction. The initial rate of catalytic reaction by 1 was higher than that of HRP. By using the Lineweaver–Burk equation, the Km and Vmax values of HRP and 1 were found and summarized in Table 2. The Km value of 1 with ABTS was lower than that of HRP, indicating that 1 had higher binding and catalytic activity than peroxidase. The maximum rates of the reaction, catalyzed by 1, were 1.7 times higher than that of HRP.
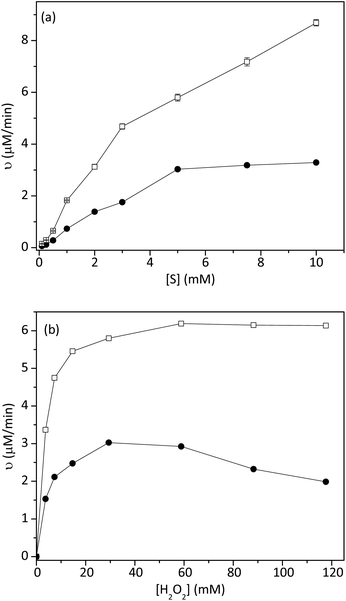 | ||
| Fig. 4 Effect of (a) ABTS concentration and (b) H2O2 concentration on the reaction rate of 1 (hollow square) and HRP (circle). The experiment was conducted at room temperature (n = 3, SD ≤ 5%). | ||
| Catalyst | Substrate | Km (mM) | Vmax (μM min−1) |
|---|---|---|---|
| HRP | ABTS | 15.39 | 8.85 |
| 1 | H2O2 | 4.35 × 10⁻³ | 3.35 |
| ABTS | 10.35 | 14.9 | |
| H2O2 | 3.38 × 10⁻³ | 6.75 |
The effect of H2O2 on the initial rate of the reaction was also studied, as shown in Fig. 4b. In this experiment, the concentration of ABTS was fixed at 5 mM. As shown in Table 2, the Km value of 1 with H2O2 (3.38 × 10⁻³ mM) was close to that of HRP (4.35 × 10⁻³ mM). Meanwhile, the Vmax of 1 was two times higher than that of free HRP.
3.3 Reaction mechanism at different pH
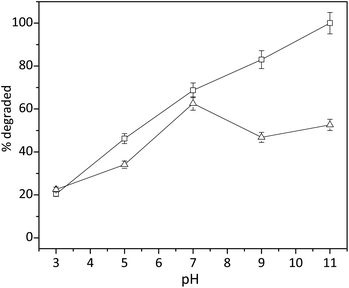
Since the complexation of copper ions with tripeptide was accomplished through the deprotonation of amide nitrogen, we proposed that the pH played a key role in the activity of cuzymes. To understand the effect of pH on the activity of 1, degradation of trypan blue (200 μM) in the presence of 0.2 mM of 1 and 0.2% of H2O2 was performed at different pH values with a reaction time of 30 min. HCl and NaOH were used to adjust pH of the solution. The results in Fig. 5 indicated that the degradation of trypan blue increased monotonically with increasing pH. When the pH was 11.0, approximately 100% of trypan blue was degraded by H2O2 within 10 min. In contrast, when the pH was 7.0, only 68.7% of trypan blue was degraded. Even though the reaction mechanism of H2O2 with copper ions is an on-going debate, several studies have shown that either a hydroxyl free radical (OH˙) or a high-valence CuIII was involved. To shed light on the reaction mechanism, 160 mM of tert-butanol was added as a free radical scavenger to the solution. As shown in Fig. 5, the presence of tert-butanol reduced the amount of trypan blue that could be degraded when the pH was higher than 7, suggesting that some free radicals might be responsible for the degradation of trypan blue in alkaline conditions.In the literature, it has been reported that copper ions can catalyze a Fenton-like reaction. Even though the exact mechanism is fairly complicated, key reactions can be summarized as follows:38–42
| L–CuII + H2O2 ⇌ L–CuI + O2˙− + 2H+ | (3) |
| L–CuI + H2O2 → L–CuII + OH˙ + OH− | (4) |
| L–CuI + H2O2 → L–CuIII + 2OH− | (5) |
The reaction became less favorable when the pH increased because two hydroxyl ions were produced. For comparison, only one hydroxyl ion was produced in eqn (4). Thus, the reaction mechanism favored the oxidation of CuI to CuIII at neutral pH. In this case, the cuzyme behaved like an artificial peroxidase because the copper ion center changed its oxidation state during the reaction.
To further shed light on the reaction mechanism under different pH, we characterized the reaction system by using UV-Vis spectroscopy. The concentrations of 1 and H2O2 were fixed at 0.4 mM and 0.1%, respectively. Absorption spectra of 1 before and after the addition of H2O2 at pH 11.0 and pH 5.3 were shown in Fig. 6a and b, respectively. At pH 11.0, the addition of H2O2 caused a broad peak between 320 and 400 nm, which was probably caused by the formation of CuI–GGG.43 It was also noted that the peak gradually decreased over a period of 2 h. This phenomenon was consistent with the generation of hydroxyl free radicals from the CuI–GGG species as shown in eqn (4). In contrast, when the pH was 5.3, a shoulder peak between 250 and 300 nm was formed after 2 h. The peak was contributed to the formation of CuIII–GGG species at low pH.44 Fig. 6c showed that when free CuII was used, no such a shoulder peak was observed, suggesting that GGG plays an important role in the formation of the CuIII species.
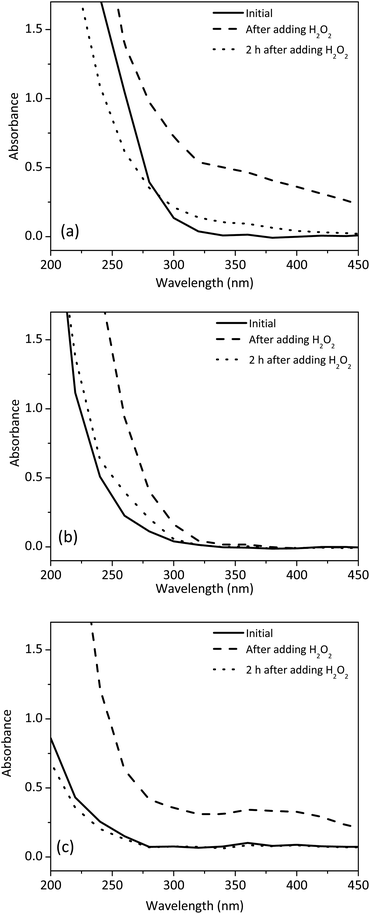 | ||
| Fig. 6 Effect of H2O2 on the absorption spectra of 1 at different pH conditions (a) pH 11.0 (b) pH 5.3 and (c) CuII solution at pH 5.6. | ||
3.4 Kinetic study
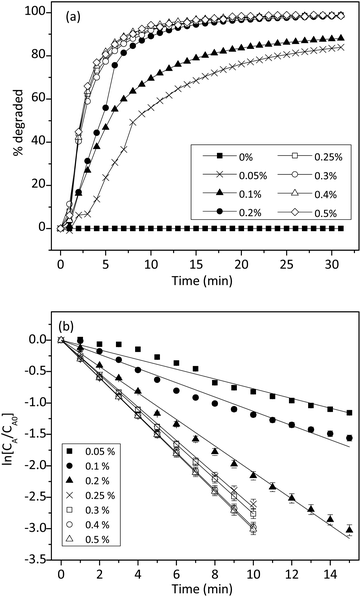
To understand the reaction kinetics, different amounts of H2O2 (0–0.5%) were added to the reaction mixture. Fig. 7a showed that in the absence of H2O2, there was no degradation of trypan blue. This result indicated the importance of H2O2 in the reaction. When the concentration of H2O2 was between 0.05% and 0.5%, trypan blue was degraded, and the initial rate was constant and proportional to the H2O2 concentration. Thus, we proposed that when H2O2 was in excess, the degradation of trypan blue could be modeled by using pseudo-first-order kinetics as follows:
 | (6) |
| k = k1[H2O2] | (7) |
Fig. 7b showed that ln[CA/CA0] decreased linearly with time and agreed well with eqn (6). However, when the H2O2 concentration was higher than 0.2%, the relationship started to deviate from linearity, probably due to some reactions between H2O2 and free radicals as shown in the literature.42,45 From the slope of the straight line in Fig. 7b, the k1 value could be determined to be 0.0037 mM−1 min−1.
We also investigated the effect of temperature on the rate constant between 25 and 70 °C. Fig. 8a showed that ln[CA/CA0] decreased linearly with time at six different temperatures. The linear relationship in Fig. 8a confirmed that the reaction still followed the pseudo-first-order model at different temperatures. The apparent rate constants at different temperatures were tabulated in Table 3. The activation energy (Ea) and pre-exponential factor (A) for the reaction were estimated by using the Arrhenius model, as shown in eqn (8).
 | (8) |
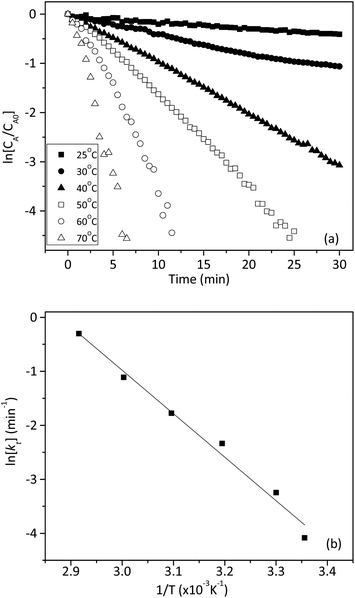 | ||
| Fig. 8 (a) Integral plot for different trypan blue concentrations at various temperatures in the presence of 0.2 mM of 1 and 0.2% of H2O2 (n = 3, SD ≤ 2%). (b) Arrhenius plot obtained from part (a). | ||
| Temperature (°C) | kt (min−1) | Ea (kJ mol−1) | K0 (min−1) |
|---|---|---|---|
| 25 | 0.0168 | 66.9 | 1.9 × 10⁸ |
| 30 | 0.0389 | ||
| 40 | 0.0968 | ||
| 50 | 0.1694 | ||
| 60 | 0.3287 | ||
| 70 | 0.7406 |
The effect of 1 on the reaction kinetics was presented in Fig. 9. As expected, in the absence of 1, trypan blue could not be degraded. However, in the presence of 0.02 mM of 1, the reaction accelerated considerably. Fig. 9b showed that ln[CA/CA0] had a linear relationship with time and the values declined linearly. Therefore, the effect of 1 on the degradation of trypan blue also followed a pseudo-first-order kinetic model.
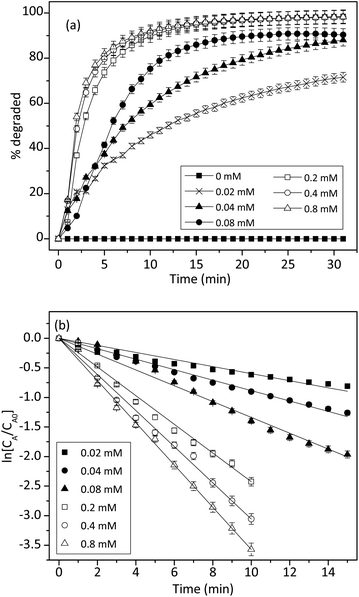 | ||
| Fig. 9 (a) Effect of cuzyme concentrations on the degradation of trypan blue (200 μM) by using 0.2% of H2O2. (b) Integral plot for different cuzyme concentrations at 50 °C (n = 3, SD ≤ 5%). | ||
Similarly, the concentration effect of 1 on the degradation of trypan blue was shown in Fig. 9a. The result indicated that the initial reaction rate was also proportional to the concentration of 1. This was expected because 1 was a homogeneous catalyst. Fig. 9b showed that when the H2O2 was fixed at 0.2%, degradation of trypan blue followed a pseudo-first-order kinetic, and the rate constant was proportional to the concentration of 1. Thus, the apparent rate constant k was related to the concentration of cuzyme as followed:
| k = k2[L–Cu] | (9) |
By combining eqn (7) and (9), we obtained a second-order rate equation as:
| r = k1k2[H2O2][L–Cu] | (10) |
Finally, we also studied the effect of trypan blue concentration on the initial rate, but it was found that the initial rate was independent of the trypan blue concentration (data not shown). Thus, it could be concluded that the reaction between free radical (or CuIII) and trypan blue was much faster than that of the oxidation and reduction of copper ions.
4. Conclusions
In this study, we demonstrated a method for preparing copper–tripeptide (cuzymes) to mimic the peroxidase activity. Among all cuzymes, Cu–GGG complex showed the highest activity whereas Cu–GGH showed the lowest activity. In the presence of Cu–GGG, both ABTS and trypan blue could be oxidized by using H2O2 within 30 min. The reaction mechanism was pH-dependent. At pH 7.0, CuII was reduced to CuI, and then CuI was oxidized to CuIII, which was responsible for the oxidation of trypan blue. In contrast, when the pH increased, CuI was oxidized by H2O2 and hydroxyl free radical (OH˙) was produced. The free radicals were mainly responsible for the oxidation reaction. The oxidation reaction followed a pseudo-first-order kinetic, the reaction rate was proportional to the H2O2 concentration and cuzyme concentration, but independent of the dye concentration. Due to the effectiveness of Cu–GGG in oxidizing dye molecules, it had potential applications in wastewater treatments or bleaching processes.Conflicts of interest
There are no conflicts to declare.Acknowledgements
This research was supported by National Research Foundation (NRF) Singapore, under its Central Gap Fund (NRF2018NRF-CG001-003).Notes and references
- J. Everse, K. E. Everse and M. B. Grisham, Peroxidases in chemistry and biology, CRC Press, Boca Raton, FL, 1991 Search PubMed.
- A. Pandey, Enzyme technology, N. K. Muraleedharan for Asiatech Publishers Inc., New Delhi, 2008 Search PubMed.
- M. Hamid and R. Khalil ur, Food Chem., 2009, 115, 1177–1186 CrossRef CAS.
- N. Ž. Šekuljica, N. Ž. Prlainović, A. B. Stefanović, M. G. Žuža, D. Z. Čičkarić, D. Ž. Mijin and Z. D. Knežević-Jugović, Sci. World J., 2015, 2015, 371625 Search PubMed.
- T. Chanwun, N. Muhamad, N. Chirapongsatonkul and N. Churngchow, AMB Express, 2013, 3, 14 CrossRef PubMed.
- N. Bansal and S. S. Kanwar, Sci. World J., 2013, 2013, 714639 Search PubMed.
- G.-J. Cao, X. Jiang, H. Zhang, T. R. Croley and J.-J. Yin, RSC Adv., 2017, 7, 52210–52217 RSC.
- Z. W. Chen, J. J. Yin, Y. T. Zhou, Y. Zhang, L. Song, M. J. Song, S. L. Hu and N. Gu, ACS Nano, 2012, 6, 4001–4012 CrossRef CAS PubMed.
- L. Z. Gao, J. Zhuang, L. Nie, J. B. Zhang, Y. Zhang, N. Gu, T. H. Wang, J. Feng, D. L. Yang, S. Perrett and X. Yan, Nat. Nanotechnol., 2007, 2, 577–583 CrossRef CAS PubMed.
- B. W. Liu, X. Han and J. W. Liu, Nanoscale, 2016, 8, 13620–13626 RSC.
- B. W. Liu and J. W. Liu, Nanoscale, 2015, 7, 13831–13835 RSC.
- T. J. Collins, Acc. Chem. Res., 2002, 35, 782–790 CrossRef CAS PubMed.
- Z. B. Han, X. Han, X. M. Zhao, J. T. Yu and H. Xu, J. Hazard. Mater., 2016, 320, 27–35 CrossRef CAS PubMed.
- Z. P. Pai, N. V. Selivanova, P. V. Oleneva, P. V. Berdnikova and A. M. Beskopyl'nyi, Catal. Commun., 2017, 88, 45–49 CrossRef CAS.
- A. Singh, S. Patra, J.-A. Lee, K. H. Park and H. Yang, Biosens. Bioelectron., 2011, 26, 4798–4803 CrossRef CAS PubMed.
- G. Battaini, A. Granata, E. Monzani, M. Gullotti and L. Casella, in Advances in Inorganic Chemistry, ed. R. van Eldik and J. Reedijk, Academic Press, 2006, vol. 58, pp. 185–233 Search PubMed.
- X. Wang, W. Guo, Y. Hu, J. Wu and H. Wei, in Nanozymes: Next Wave of Artificial Enzymes, Springer, Berlin, Heidelberg, 2016, pp. 1–6, DOI:10.1007/978-3-662-53068-9_1.
- J. Huang, L. Lin, D. Sun, H. Chen, D. Yang and Q. Li, Chem. Soc. Rev., 2015, 44, 6330–6374 RSC.
- G. Evano, N. Blanchard and M. Toumi, Chem. Rev., 2008, 108, 3054–3131 CrossRef CAS PubMed.
- K. Pan, H. Ming, H. Yu, Y. Liu, Z. Kang, H. Zhang and S.-T. Lee, Cryst. Res. Technol., 2011, 46, 1167–1174 CrossRef CAS.
- M. B. Gawande, A. Goswami, F.-X. Felpin, T. Asefa, X. Huang, R. Silva, X. Zou, R. Zboril and R. S. Varma, Chem. Rev., 2016, 116, 3722–3811 CrossRef CAS PubMed.
- H. Tan, C. Ma, L. Gao, Q. Li, Y. Song, F. Xu, T. Wang and L. Wang, Chem.–Eur. J., 2014, 20, 16377–16383 CrossRef CAS PubMed.
- A.-L. Hu, Y.-H. Liu, H.-H. Deng, G.-L. Hong, A.-L. Liu, X.-H. Lin, X.-H. Xia and W. Chen, Biosens. Bioelectron., 2014, 61, 374–378 CrossRef CAS PubMed.
- A. G. Thawari and C. P. Rao, ACS Appl. Mater. Interfaces, 2016, 8, 10392–10402 CrossRef CAS PubMed.
- N. Wang, J. Sun, L. Chen, H. Fan and S. Ai, Microchim. Acta, 2015, 182, 1733–1738 CrossRef CAS.
- M. J. Pugia, J. A. Lott, J. F. Wallace, T. K. Cast and L. D. Bierbaum, Clin. Biochem., 2000, 33, 63–70 CrossRef CAS PubMed.
- P. Umadevi and L. Senthilkumar, RSC Adv., 2014, 4, 49040–49052 RSC.
- V. Andrushchenko, J. H. Van De Sande and H. Wieser, Biopolymers, 2003, 72, 374–390 CrossRef CAS PubMed.
- J. Yang, L. Zheng, Y. Wang, W. Li, J. Zhang, J. Gu and Y. Fu, Biosens. Bioelectron., 2016, 77, 549–556 CrossRef CAS PubMed.
- X. Mao, S. Liu, C. Yang, F. Liu, K. Wang and G. Chen, Anal. Chim. Acta, 2016, 909, 101–108 CrossRef CAS PubMed.
- X. Bi and K.-L. Yang, Langmuir, 2007, 23, 11067–11073 CrossRef CAS PubMed.
- X. Bi, A. Agarwal, N. Balasubramanian and K.-L. Yang, Electrochem. Commun., 2008, 10, 1868–1871 CrossRef CAS.
- X. Ding and K.-L. Yang, Analyst, 2015, 140, 340–345 RSC.
- L. T. Nguyen and K.-L. Yang, Enzyme Microb. Technol., 2017, 100, 52–59 CrossRef CAS PubMed.
- W. Song, B. Zhao, C. Wang, Y. Ozaki and X. Lu, J. Mater. Chem. B, 2019, 7, 850–875 RSC.
- K. Chen, W. Li, J. Wang and W. Wang, J. Phys. Chem. B, 2019, 123, 5216–5228 CrossRef CAS PubMed.
- R. H. Gottfredsen, U. G. Larsen, J. J. Enghild and S. V. Petersen, Redox Biol., 2013, 1, 24–31 CrossRef CAS PubMed.
- F. Haber, J. Weiss and W. J. Pope, Proc. R. Soc. London, Ser. A, 1934, 147, 332–351 CAS.
- M. J. Burkitt, Prog. React. Kinet. Mech., 2003, 28, 75–103 CrossRef CAS.
- Y. Luo, K. Kustin and I. R. Epstein, Inorg. Chem., 1988, 27, 2489–2496 CrossRef CAS.
- J. W. Moffett and R. G. Zika, Environ. Sci. Technol., 1987, 21, 804–810 CrossRef CAS PubMed.
- J. A. Simpson, K. H. Cheeseman, S. E. Smith and R. T. Dean, Biochem. J., 1988, 254, 519–523 CrossRef CAS PubMed.
- A. Henglein, J. Phys. Chem. B, 2000, 104, 1206–1211 CrossRef CAS.
- J. L. Kurtz, G. L. Burce and D. W. Margerum, Inorg. Chem., 1978, 17, 2454–2460 CrossRef CAS.
- J. Weiss, in Advances in Catalysis, ed. W. G. Frankenburg, V. I. Komarewsky and E. K. Rideal, Academic Press, 1952, vol. 4, pp. 343–365 Search PubMed.
| This journal is © The Royal Society of Chemistry 2020 |

