DOI:
10.1039/D0RA02389B
(Paper)
RSC Adv., 2020,
10, 28267-28276
Environmental occurrence and risk assessment of haloacetic acids in swimming pool water and drinking water
Received
14th March 2020
, Accepted 21st July 2020
First published on 29th July 2020
Abstract
A prevalent group of disinfection by-products (DBPs), i.e., haloacetic acids (HAAs), have raised significant public concern due to their high frequency of occurrence, considerable concentrations and potent toxicity. This study investigated the environmental occurrence of HAAs and the corresponding predicted human exposure to two important water matrices where humans are frequently and long-term exposed, i.e., swimming pool waters (SPWs) and drinking waters (DWs), in Shanghai, China. The sum of five HAAs in SPWs was 241 μg L−1 on average (dominated by dichloroacetic acid (DCAA) and trichloroacetic acid (TCAA)), four times as much as its maximum contaminant level (MCL) regulated by the Environmental Protection Agency (EPA) in DWs. The maximum HAA concentration in DWs was 35 μg L−1, with chloroacetic acid (CAA) as the most dominant compound. The higher concentrations (reflected by total organic carbon (TOC), dissolved organic carbon (DOC), and UV254) and more categories (body fluids and personal care products in addition to natural organic matter) of organic contaminants and the higher chlorine in SPWs should be responsible for the differentiated HAA yield and speciation. The qualification rates of samples have been evaluated. The power function models correlating HAAs with multiple water quality parameters were developed with correlation coefficients of 0.614 and 0.798 for SPWs and DWs respectively. These models may provide the preliminary insights on how to minimize HAA formation by grasping the relative importance of each parameter and how to build the framework to predict HAA formation in untreated source water or SPWs subjected to chlorination. The predicted carcinogenic and non-carcinogenic risks of humans exposed to SPWs and DWs with HAAs were within the acceptable levels.
1. Introduction
Water disinfection plays an important role in inactivating or destroying pathogenic bacteria, fungi, viruses, cysts, and other microorganisms in order to avoid the spreading of infectious diseases among humans.1,2 On the other hand, disinfectants may react with organic contaminants originating from natural and anthropogenic inputs to generate noxious disinfection by-products (DBPs).3,4 Haloacetic acids (HAAs) as one of the most abundant DBP groups have raised public concern due to their high frequency of occurrence, considerable concentrations and potent toxicity.3,5,6 There have been abundant animal cancer statistics to support the carcinogenic potential of HAAs in chlorinated drinking water.7,8 Plewa et al.9 found that the chlorinated HAA is highly toxic to CHO cells and DNA. Furthermore, bromochloroacetic acid (BCAA) and trichloroacetic acid (TCAA) are reported to induce developmental and teratogenic effects in rats, including low birth weight, cardiovascular disease, and genitourinary tract malformations.10 HAAs were for the first time regulated by the United States Environmental Protection Agency (U.S. EPA) with a maximum contaminant level (MCL) of 60 μg L−1 for the sum of chloroacetic acid (CAA), bromoacetic acid (BAA), dichloroacetic acid (DCAA), dibromoacetic acid (DBAA), and trichloroacetic acid (TCAA) in drinking waters (DWs).11 Afterwards, some other global organizations and developed countries (i.e., World Health Organization (WHO), Singapore, and Australia) embraced HAAs into DW regulations and guidelines as well.6 The Chinese government has regulated two individual HAA compounds, i.e., DCAA and TCAA with MCLs of 50 and 100 μg L−1, respectively, in DWs since 2006 (GB 5749-2006, Table 1).
Table 1 Water quality standards for SPWs (CJ/T 244-2016) and DWs (GB 5749-2006)a
| Parameters |
Unit |
SPWs |
DWs |
| N.A. indicates that the parameter is not included in the standard. |
| DCAA |
μg L−1 |
N.A. |
<50 |
| TCAA |
μg L−1 |
N.A. |
<100 |
| Free chlorine |
mg L−1 |
0.3–1.0 |
≥0.05 |
| Combined chlorine |
mg L−1 |
<0.4 |
N.A. |
| Turbidity |
NTU |
≤0.5 |
≤1.0 |
| TOC |
mg L−1 |
N.A. |
<5 |
| pH |
— |
7.2–7.8 |
6.5–8.5 |
The swimming pool water (SPW) is a secondary important water matrix next to DWs that human beings are frequently exposed to, especially in some tropical and developed regions/cities where water entertainments are popular.6 Swimming skill becomes one of key criteria of evaluating the comprehensive capability of undergraduates. Some universities and schools even treat swimming as a mandatory skill in some developed cities like Shanghai. The number of swimming pools in top developed cities in China reached as high as 969, 1050, 469, and 406 for Shanghai, Beijing, Guangzhou, and Shenzhen, respectively. The swimmers reached 300–400 daily during the summer period based on the local survey statistics in Shanghai, which is even higher than the number of swimmers in pools in tropical regions (i.e., more than 100![[thin space (1/6-em)]](https://www.rsc.org/images/entities/char_2009.gif) 000 annually in public pools in Singapore12). The anthropogenic inputs including body fluids (urine and sweat in particular) and personal care products (PCPs, e.g., sunscreen, body lotion, shampoos, and other cosmetics) from the swimmers in addition to the natural organic matter (NOM) from source water may result in the abundant formation of HAAs in SPWs.6 The HAAs in SPWs are often reported to be much or even several orders of magnitude higher than the MCLs regulated in DWs.12–14 The swimmers exposed to SPWs with high HAAs may potentially suffer from health risks.14 Due to the lack of public awareness to SPW safety, the occurrence and human exposure of HAAs in SPWs is investigated not as much as that in DWs.3 Nevertheless, formation, exposure, and health risks of DBPs in SPWs might have higher negative effects on human health.15 In addition, HAAs have yet to be included in any SPW quality standard. Given these uncertainties and potential health risks, more attention should be given to SPW quality.
000 annually in public pools in Singapore12). The anthropogenic inputs including body fluids (urine and sweat in particular) and personal care products (PCPs, e.g., sunscreen, body lotion, shampoos, and other cosmetics) from the swimmers in addition to the natural organic matter (NOM) from source water may result in the abundant formation of HAAs in SPWs.6 The HAAs in SPWs are often reported to be much or even several orders of magnitude higher than the MCLs regulated in DWs.12–14 The swimmers exposed to SPWs with high HAAs may potentially suffer from health risks.14 Due to the lack of public awareness to SPW safety, the occurrence and human exposure of HAAs in SPWs is investigated not as much as that in DWs.3 Nevertheless, formation, exposure, and health risks of DBPs in SPWs might have higher negative effects on human health.15 In addition, HAAs have yet to be included in any SPW quality standard. Given these uncertainties and potential health risks, more attention should be given to SPW quality.
There have been a handful of studies reporting the occurrence of HAAs in SPWs in some developed countries.12,13,16,17 It is summarized that the distinct regulated disinfectant concentration range in SPWs in different regions/countries has a significant effect on HAA formation.6 For example, the one or two orders of magnitude higher concentrations of HAAs in U.S. than Germany pools was mainly attributed to its much higher regulated free chlorine range (1–5 vs. 0.3–0.6 mg L−1). The different managerial approaches (e.g., SPW can be treated circularly or discharged directly) and usage frequencies of swimming pools in different regions/countries (leading to the diverse water characteristics) may affect HAA formation/accumulation as well. Therefore, the statistics of SPWs obtained in other regions/countries may not reflect the actual situation in the region of interest. As far as we know, in Shanghai, little attention has been paid to SPW quality (in particular, HAAs) and the relevant data can rarely be found in the existing literature, despite the high popularity of swimming activities. Thus, a local survey for SPWs and the corresponding human exposure assessment are needed to provide an overview of SPW quality and understand the potential risks that humans may suffer from. Such work may facilitate the designation of decisions on how to improve water quality and ensure swimmers' safety, and therefore is highly supported by local government and its citizens. In addition, the DW samples were used for comparison purposes.
In this study, HAAs, chlorine, and some routine water quality parameters including conductivity, pH, UV254, turbidity, total organic carbon (TOC), dissolved organic carbon (DOC), and total nitrogen (TN) in 27 SPW and 15 DW samples have been determined and compared. A linear model correlating HAAs with the individual water parameter and a power function model correlating HAAs with multiple water quality characteristics have been developed to evaluate the relative importance of each parameter to HAA formation, which may provide a preliminary insight into the effective HAA control and prediction. In addition, human exposure and risk assessment induced by HAAs have been evaluated. The obtained statistics for HAAs (concentrations and exposure) could enrich the database and promote the establishment/modification of HAA-related regulations, especially for those areas which pay little attention to SPW quality.
2. Materials and methods
2.1 Chemicals
Five EPA-regulated HAAs including CAA, BAA, DCAA, DBAA, and TCAA were monitored in this study. DBAA and TCAA were purchased from Dr Ehrenstorfer and Adamas Reagent respectively and the rest were from Aladdin Biotechnology. The HAA standards with the purity over 98% were in analytical grade, with one exception, i.e., BAA in GC grade. The solvents including methyl tert-butyl ether (MTBE) and methanol in GC grade (≥99.8%) and the other chemicals including sulfuric acid, sodium bicarbonate, copper sulfate, and sodium sulfate in analytical grade were used for the pre-treatment of HAA samples.
2.2 Field survey design
Twenty-seven SPW samples were collected randomly from 27 different swimming pools in Shanghai, China. The SPW samples listed from 1–10 were collected in October 2018, from 11–20 were collected in December 2018, and the rest were collected in March 2019 (Fig. 1A), in order to understand the effect of seasons on HAA formation. Fifteen DW samples were collected randomly from 15 taps in different locations, including campus dormitories and laboratories, residential buildings, and public toilets, in particular, five samples were collected in the early morning period (∼5:00 am, considering that the retention of water overnight may allow us to judge the effect of retention time on HAA formation). For each swimming pool and drinking water tap, at least duplicate samples were collected and the average values were used to eliminate the measurement uncertainty.
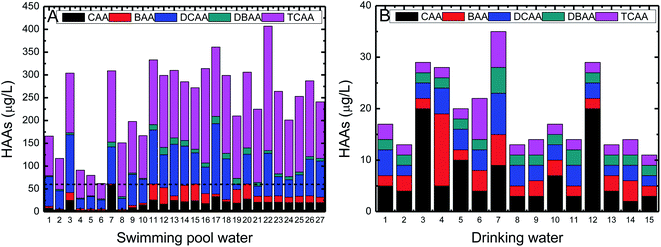 |
| | Fig. 1 The HAA concentrations in SPWs (A) and DWs (B). The dash line reveals the MCL of HAAs regulated by EPA in DWs. | |
2.3 Analytical methods
2.3.1 HAA quantification. The HAA sample with a volume of 40 mL was headspace-free collected in an amber glass with ∼4 mg ammonia chloride to quench the free chlorine. The HAA samples were transported to the laboratory immediately upon collection and stored at 4 °C until analysis within one week. The HAAs were quantified according to a modified EPA 552.3 method proposed in our previous research work.12 The HAA pre-treatment process generally included HAA extraction by MTBE and HAA derivatization by acidic methanol. The methylated HAAs were then analysed by a gas chromatography mass spectrometry (GCMS: TQ8050, Shimadzu, Japan) equipped with an analytical column (Rtx-5MS, Gs-Tek, USA, 30 m × 0.25 mm ID, 0.25 μm film thickness, Shimadzu, Japan). The seven mixture standards with 2, 5, 10, 20, 50, 80, and 100 μg L−1 of each HAA were used for calibration. The correlation coefficient R2 of the linear fitting for each HAA was over 0.99.
2.3.2 Other parameters. Total chlorine and free chlorine were determined immediately after sampling based on the dipropyl-p-phenylenediamine (DPD) method (Spectroquant® chlorine test, EPA 330.5, US Standard Methods 4500-Cl2 G, and EN ISO 7393). The combined chlorine was the subtraction between total chlorine and free chlorine. The conductivity was monitored by a potable conductivity meter (Myron L's Ultrameter II 4P, USA). The solution pH was determined by a pH meter (FE20 Plus, Mettler Toledo). The UV254 was determined by an ultraviolet spectrophotometer (UV-1800PC, Mapada) running under a wavelength of 254 nm. The turbidity was measured by a turbidity meter (HACH 2100Q, UAS). TOC and DOC were determined by a TOC analyser (TOC-V CPN, Shimadzu, Japan). TN was determined by a DBR200 digester and a DR3900 spectrophotometer (HACH, USA).
2.4 Statistical analysis
The SPSS (Statistical Package for the Social Sciences) software was used for statistical correlation analysis. The HAAs were generated by the reaction between free chlorine and organic precursors and their formation should be affected by the other water parameters as well. A linear model was developed to define the degree of correlation between HAA formation and the individual water parameter, including free chlorine, conductivity, pH, UV254, TOC, and turbidity. A power function model was developed to elucidate the statistical correlation between HAAs and multiple water quality characteristics and provide a preliminary insight into the relative importance of each parameter.18 The units of the dependent and independent variables used in the models are the same as those listed in Tables 1 and 2. The developed model could assist the fast prediction of HAA formation potential in source water prior to chlorination and the formed HAAs in chlorinated water (since the HAA quantification process is rather complicated). Total chlorine and DOC were not embodied in the model since free chlorine and TOC as similar indicators have been included. TN was not included since HAAs were not nitrogenous compounds.
Table 2 The characteristics of SPWs and DWsa
| Parameters |
Unit |
SPWs |
DWs |
| The SPW and DW samples were collected independently from 27 swimming pools and 15 drinking water taps. The combined chlorine was not available when total chlorine was less than the detection limit of 0.05 mg L−1, therefore indicated as N.A. HAAs were the sum of CAA, BAA, DCAA, DBAA, and TCAA. |
| Free chlorine |
mg L−1 |
0.5 ± 0.5 (<0.05–2.0) |
0.3 ± 0.3 (<0.05–0.9) |
| Combined chlorine |
mg L−1 |
0.4 ± 0.4 (0.1–1.4) |
0.2 ± 0.2 (N.A.b to 0.6) |
| Total chlorine |
mg L−1 |
0.9 ± 0.7 (0.2–3.0) |
0.5 ± 0.4 (<0.05–1.0) |
| Conductivity |
μs cm−1 |
766 ± 464 (394–2188) |
397 ± 84 (337–593) |
| pH |
— |
7.5 ± 0.3 (6.9–8.1) |
7.6 ± 0.2 (7.3–8.0) |
| UV254 |
cm−1 |
0.08 ± 0.10 (0.03–0.53) |
0.04 ± 0.02 (0.03–0.10) |
| Turbidity |
NTU |
0.6 ± 0.5 (0.2–2.9) |
0.6 ± 0.3 (0.3–1.4) |
| TOC |
mg L−1 |
15 ± 14 (4–64) |
7 ± 7 (0.3–24) |
| DOC |
mg L−1 |
13 ± 14 (1–63) |
6 ± 7 (0.2–24) |
| TN |
mg L−1 |
11 ± 5 (4–24) |
3 ± 2 (1–7) |
| HAAsc |
μg L−1 |
241 ± 87 (62–407) |
19 ± 7 (11–35) |
2.5 Exposure assessment
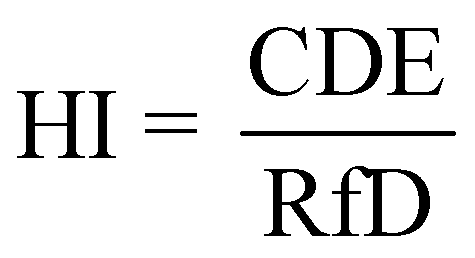
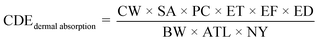
Human bodies are exposed to DBPs mainly via three pathways: (1) oral ingestion; (2) dermal absorption; (3) inhalation.6,19 Human exposure by HAAs in SPWs was evaluated by oral ingestion and dermal absorption (indicated by chronic daily exposures (CDE) as shown in eqn (1) and (2)), due to the low volatility of HAAs. Human exposure by HAAs in DWs was assessed by oral ingestion only (eqn (1)). The risk assessment was evaluated by both carcinogenic and non-carcinogenic indicators (i.e., cancer risk (CR) and hazard index (HI), eqn (3) and (4)) according to the EPA guidelines.20 The equations were listed as:21–23| |
 | (1) |
| |
 | (2) |
| |
 | (4) |
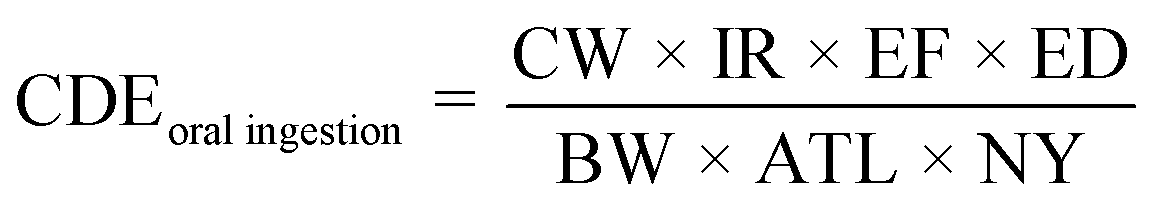
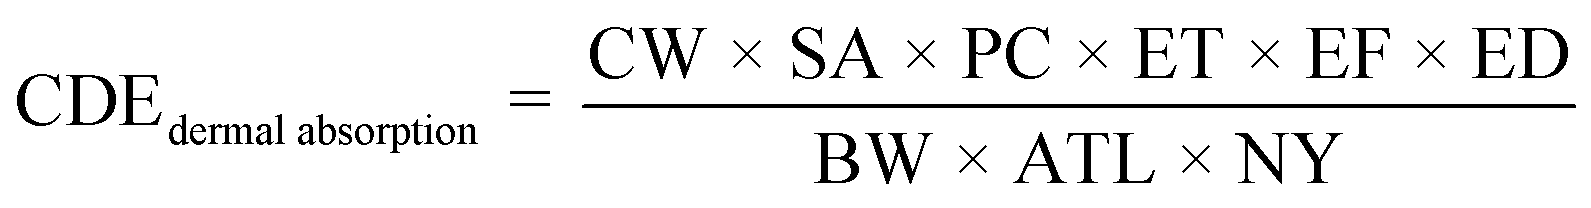
where CDEoral ingestion and CDEdermal absorption are chronic daily exposure of HAAs by oral ingestion and dermal absorption, respectively (mg (kg d)−1); CR and HI are cancer risk and hazard index, respectively (dimensionless); CW is the chemical concentration (mg L−1); IR is the ingestion rate (mL h−1); EF and ED are exposure frequency (event per year) and exposure duration (year), respectively; BW and SA are the body weight (kg) and skin surface area (m2), respectively; ATL is the average total lifetime (year); NY is the number of days per year (365 days per year); PC is the permeability constant (cm h−1) and ET is the exposure time (h per event); CSF is the cancer slope factor ((mg (kg d)−1)) and RfD is the chronic reference dose (mg (kg d)−1).
The BW (62.70 kg for males and 54.4 kg for females), SA (1.697 m2 for males and 1.531 m2 for females), and ATL (73.5 years for males and 79.7 years for females) were based on the literature.24 For adults in SPWs, IR, ET, EF, and ED were 25 mL h−1, 1.3 h per event, 120 event per year, and 30 years, respectively.25 For DWs, IR was 2.14 L per day for males and 2 L per day for females,26 EF was 365 days per year, and ED was the same as ATL. The PC was 1–3 × 10⁻³ cm h−1.27 The CSF (5 × 10⁻² and 7 × 10⁻² mg (kg d)−1 for DCAA and TCAA, respectively) and RfD (3 × 10⁻³, 4 × 10⁻³, and 2 × 10⁻² mg (kg d)−1 for CAA, DCAA, and TCAA, respectively) of the oral route were obtained from the Integrated Risk Information System (IRIS). The CSF of dermal absorption for HAAs was assumed the same as that of oral ingestion due to its unavailability in IRIS.23,28
3. Results and discussion
3.1 Comparison of general parameters in SPWs and DWs
The characteristics of SPWs and DWs have been shown in Table 2. The free chlorine (the summation of HClO and ClO−, as two active ingredients for disinfection29) in SPWs ranged widely from <0.05 to 2.0 mg L−1, of which 63% of the samples (Table 3) were out of the range of 0.3–1.0 mg L−1 regulated by water quality standard for SPWs in China (CJ/T 244-2016) (Table 1). A field survey study similarly showed that the free chlorine of some SPWs was out of the regulated range.12 The excess chlorine may lead to the substantial formation of DBPs.6 The swimmers exposed in SPWs with insufficient chlorine may carry the high risk of suffering from some infectious diseases.30 The current survey statistics show that how to control the chlorine content appropriately in SPWs is still a common challenge for pool operators. The combined chlorine (as an indicator of DBPs6) in SPWs was 0.4 mg L−1 in average, equivalent to its MCL, which indicates that a significant portion of SPW samples exceeded the prescribed limit (37%). The maximum combined chlorine reached 1.4 mg L−1, which indicates the high contamination level by DBPs. The free chlorine concentration at the end of pipeline network is regulated to be ≥0.05 based on the DW quality standard (GB 5749-2006). The residual chlorine is intended to sustain the continuous disinfection capability. Forty percent of DW samples had free chlorine less than 0.05 mg L−1, demonstrating their insufficient continuous disinfection capacity. The combined chlorine in DWs was 0.2 mg L−1 in average.
Table 3 The qualification rate of SPW and DW samples
| Qualification rate |
| Parameters |
SPWs |
DWs |
| The DW standard (GB 5749-2006) was used as reference since DCAA and TCAA were not included in SPW standard. N.A. indicates that the qualification rate was not available when the parameter is not included in the standard. |
| DCAA |
37%a |
100% |
| TCAA |
22%a |
100% |
| Free chlorine |
37% |
60% |
| Combined chlorine |
63% |
N.A.b |
| Turbidity |
59% |
93% |
| TOC |
N.A.b |
67% |
| pH |
85% |
100% |
The conductivity of SPWs ranged from 394 to 2188 μs cm−1, much lower than the reported value of ∼5000 μs cm−1 in Singapore pools,31 demonstrating the relatively lower popularity of swimming activities in the subtropical compared to tropical regions. The minimum conductivity of 394 μs cm−1 in SPWs was approximately equal to the average value of 397 μs cm−1 in DWs (Table 2), demonstrating that the salinity in SPWs was contributed both by source water and the swimmer inputs (i.e., urine and sweat as two main sources of contaminants released by swimmers during pool activities32). The organic contaminants in SPWs (NOM, body fluids and PCPs as main sources) were nearly doubled compared to those in DWs (mainly come from NOM), which were reflected by TOC, DOC, and UV254. The maximum TOC, DOC, and UV254 in SPWs reached 64 mg L−1, 63 mg L−1, and 0.53 cm−1 respectively. The turbidity of SPWs was 0.6 NTU in average, higher than the MCL of 0.5 NTU regulated by CJ/T 244–2016. The qualification rate for turbidity in SPWs was only 59%. The TOC concentrations in five DW samples exceeded the MCL of 5 mg L−1 (corresponding to a qualification rate of only 67%), of which the maximum value reached 24 mg L−1. NOM should be the main organic source in DWs, which possess a high potential towards the formation of DBPs (e.g., HAAs).6,12 The pH values in all DW samples were within the regulated range of 6.5–8.5, while only 85% of SPW samples had pHs within 7.2–7.8. The average concentrations of TN were 11 and 3 mg L−1 for SPWs and DWs, respectively.
3.2 Comparison of HAAs in SPWs and DWs
The sum of five HAAs in SPWs ranged from 62 to 407 μg L−1, with an average value of 241 μg L−1 (Table 2), much lower than the reported values of 1002 μg L−1 in Singapore pools and 1440 μg L−1 in U. S. pools, although the TOC concentrations in the investigated pools were significantly higher (i.e., 15 mg L−1 in local pools, 1.7 mg L−1 in Singapore pools, and 3.5 mg L−1 in U. S. pools).12,33 The average concentration of 1002 μg L−1 for Singapore pools collected during March and May may represent the annual average since its climate is similar all year round. Samples in local pools were collected dispersedly in October, December, and March, with an average HAA concentration of 165, 286, and 268 μg L−1, respectively. The regional difference (for example, water quality standards, swimming habits, pool managerial approach) seems to play a more significant role than seasonal difference in terms of HAA formation, although the comparison seems a bit rough. The lower regulated free chlorine range of 0.3–1.0 mg L−1 for China pools than 1–3 mg L−1 for Singapore pools and 1–5 mg L−1 for U. S. pools should be mainly responsible for the lower HAA concentration.6 It seems that although HAAs are formed by the reaction between chlorine and organics, chlorine plays a more dominant role on HAA formation than organics.12 Bond et al. similarly found that the yield of dihaloacetic acids and trihaloacetic acids was positively correlated with the chlorine dosage.34 The positive correlation between the regulated disinfectant concentration ranges and the HAA concentrations in pools in different countries has been well established,6 although the statistical correlation obtained in this study was not as ideal as expected (see more discussion in Section 3.3). It is worth noting that all SPW samples had HAAs higher than the MCL regulated by EPA in DWs (Fig. 1A) and the average HAA concentration in SPWs was 4 times as much as the MCL.11 The chlorinated HAAs, i.e., DCAA and TCAA, were observed as the predominant HAA compounds in SPWs, which accounted for 27% and 57% of total HAAs, respectively, possibly because that chlorination is the most commonly used disinfection method. According to the DW standard in China (GB 5749-2006), there were only 37% and 22% of SPW samples which had DCAA and TCAA less than the threshold values of 50 and 100 μg L−1, respectively (Table 3). The SPW samples collected in October (sample 1–10) had lower HAA concentrations than those in December and March (sample 11–27) (an average HAA concentration of 165, 286, and 268 μg L−1, respectively, Fig. 1A). More swimmers attended water activities in October than other periods (partially reflected by an average TOC concentration of 21 and 12 mg L−1, respectively), which reduces hydraulic retention time of fresh water in swimming pools (more swimmers require a higher water renewal rate according to pool managers) and avoids the long-term accumulation of HAAs. Since all swimming pools are indoor and water temperature is constant at ∼30 °C (based on our preliminary survey), the effects of pool types and water temperature on HAA formation can be eliminated.
HAAs in DWs were one order of magnitude lower than those in SPWs, with an average value of 19 μg L−1 and a standard deviation of 7 μg L−1 (ranging from 11 to 35 μg L−1, Table 2). HAAs in all DW samples fulfilled the water quality standards regulated by U. S. EPA and China (GB 5749-2006). The distribution of individual HAA compounds in DWs was relatively more uniform compared to that in SPWs (Fig. 1), with an decreasing order of CAA (35%) > BAA (19%) ≈ DCAA (19%) > TCAA (15%) > DBAA (12%). It demonstrates that the various water quality can not only affect the total HAA yield but also the HAA speciation.18 The nearly half magnitudes of chlorine and HAA precursors (indicated by TOC, DOC, and UV254) might be simultaneously responsible for the lower HAA formation in DWs compared to SPWs. The additional organic inputs, i.e., body fluids and PCPs released from the swimmers, are reported to be responsible for the higher HAA concentration in SPWs. For example, uric acid, citric acid and hippuric acid as the main ingredients in body fluids have been verified as the main precursors for HAA formation.12 The HAAs in DW samples collected in the early morning did not show a significant difference compared to other samples, indicating that the additional retention of one night was insufficient to differentiate the HAA formation.
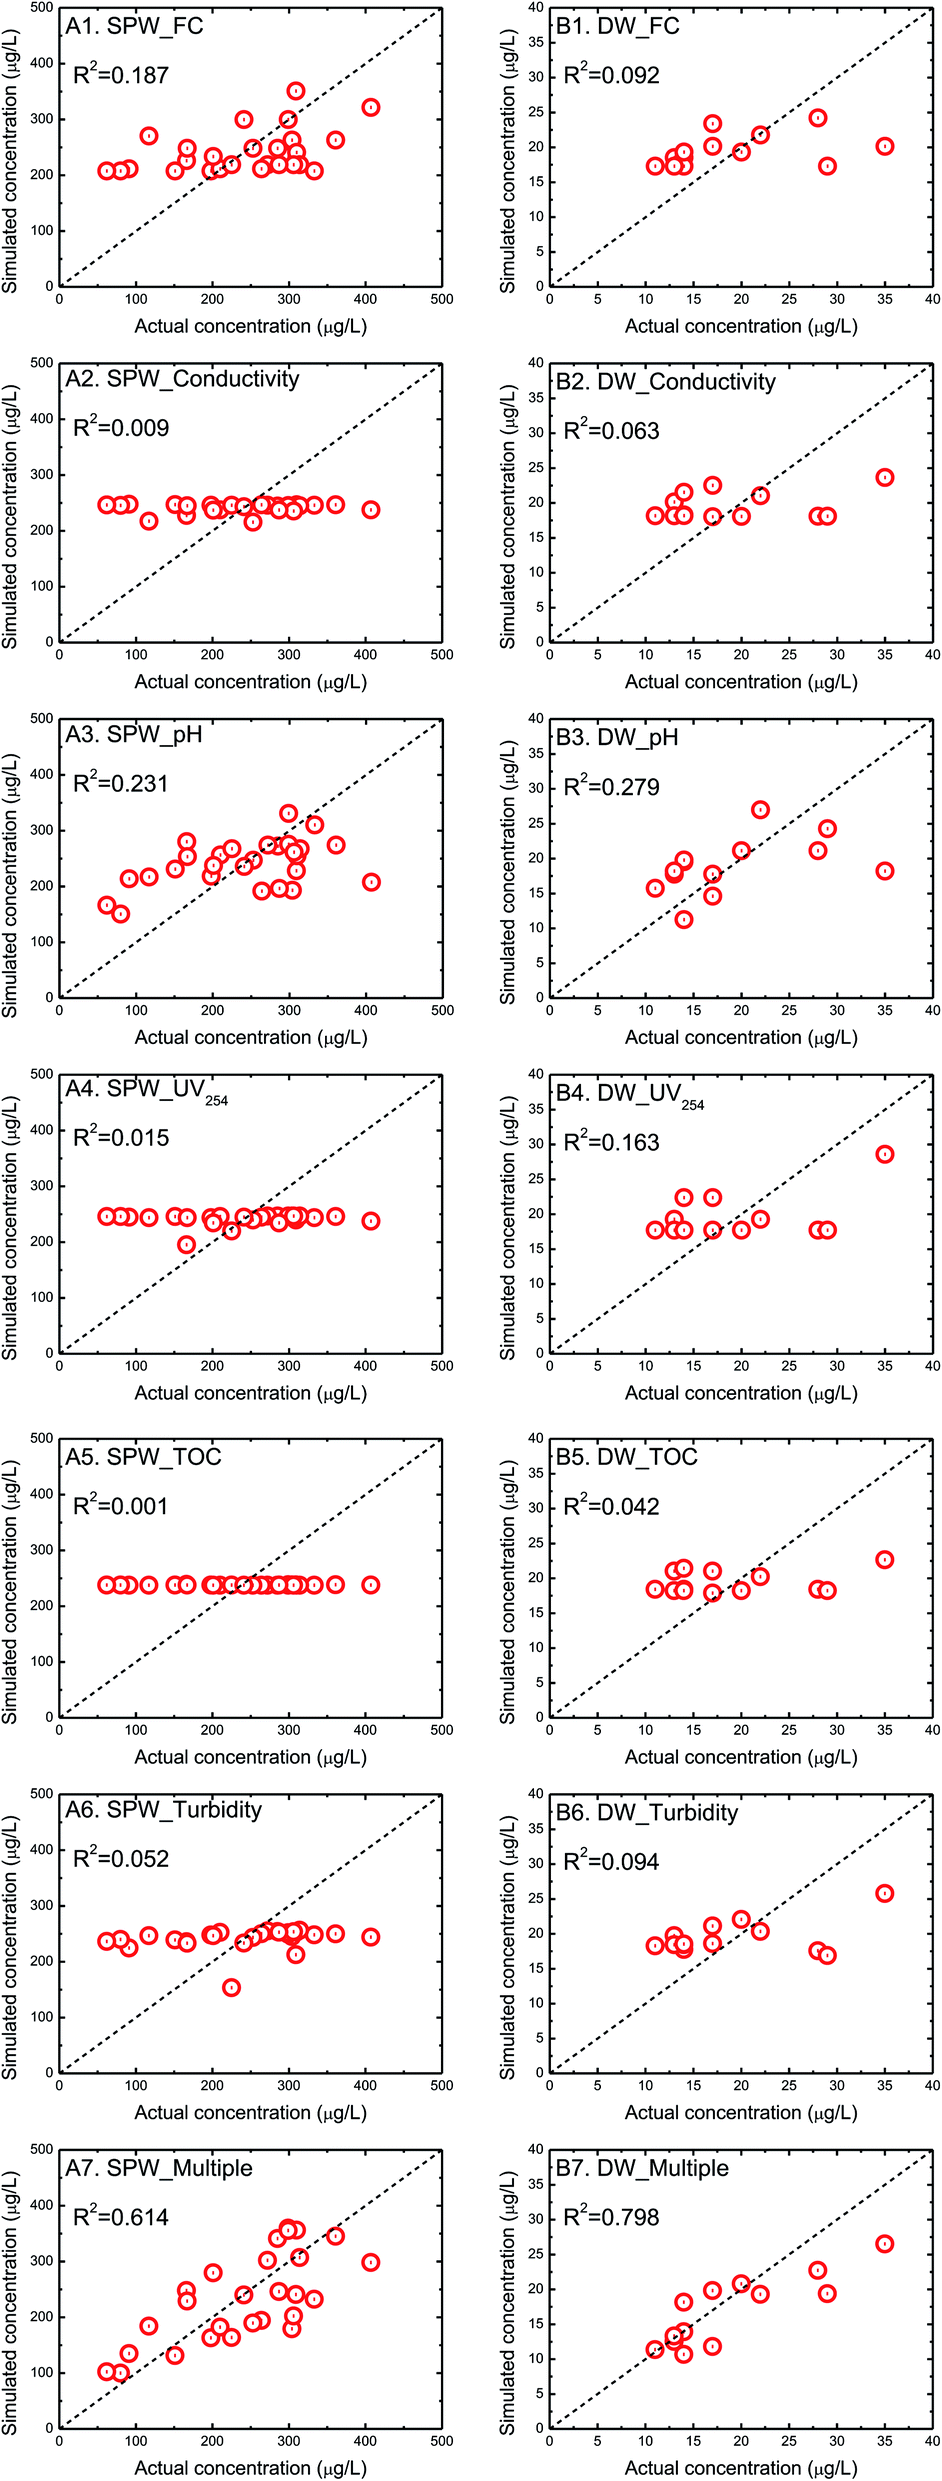
3.3 Correlation analysis of HAAs with water parameters
The HAAs are generated by the reactions between disinfectants and organic compounds and the formation is affected by the reaction condition as well.12 Therefore, the correlations between HAAs and the individual water parameter have been assessed by the linear models (Table 4). The formation of HAAs in both SPWs and DWs was positively correlated with free chlorine and TOC, although the correlation coefficients R2 were relatively low (Fig. 2), possibly due to the complicated water matrix in real water environment.14 Fabris et al.35 and Glauner et al.36 similarly found that the low TOC in SPWs or raw water is corresponding to the substantially weakened DBP formation potential, as a result, TOC is a commonly used parameter to reflect DBP precursors. The individual parameters, including conductivity, UV254, and turbidity, showed the poor correlation with HAAs (reflected by the extremely low correlation coefficients and/or the significant difference between simulated and actual HAA concentrations, Fig. 2). On the other hand, the solution pH was relatively higher correlated with HAAs with the correlation coefficient R2 of 0.231 for SPWs and 0.279 for DWs. It is interesting to observe that HAA concentrations in SPWs were negatively correlated with solution pH, while the positive influence was observed in DWs (the linear and power function models showed the consistent trends, Table 4). Hansen et al. similarly found that HAAs were positively correlated with pH in DWs.37 The pH variation influents the dissociation equilibrium for both disinfectants (e.g., the transformation between HClO and ClO−) and organic compounds (the transformation between neutral and ionic forms), which partially affects the reaction potential and finally resultant amount.38 The organic compositions with different pH-sensitivity in SPWs and DWs may be responsible for these opposite trends. The organic contaminants in DWs are normally dominated by NOM. In addition to NOM from the source water, body fluids (urine and sweat in particular) and PCPs (e.g., sunscreen, body lotion, shampoos, and other cosmetics) released from the swimmers are two additional organic sources in SPWs. Hansen et al.37 have mentioned that different source water types may result in opposite trends of HAA formation induced by pH variation.39 Therefore, the resultant HAA yield should be a result of the combined effects of pH-induced reaction potential, source water types, water matrices (i.e., SPWs or DWs), and other potential factors, considering the complexity of actual water quality. Further lab-scale control experiments (the change of single factor) may be needed to resolve the respective role. Similarly, HAA concentrations in SPWs were inversely correlated with the other water parameters, including conductivity, UV254, and turbidity, while the opposite trends were observed in DWs.
Table 4 The linear and power function models correlating HAAs with water parametersa
| SPWs |
DWs |
| The units of the variables are the same as those listed in Tables 1 and 2. The power function model was developed for SPWs. The power function model was developed for DWs. |
| [HAAs] = 204.033 + 73.488 [FC], R2 = 0.187 |
[HAAs] = 16.877 + 8.145 [FC], R2 = 0.092 |
| [HAAs] = 254.876 − 0.018 [Cond.], R2 = 0.009 |
[HAAs] = 10.604 + 0.022 [Cond.], R2 = 0.063 |
| [HAAs] = 1429.218 − 158.248 [pH], R2 = 0.231 |
[HAAs] = −152.478 + 22.489 [pH], R2 = 0.279 |
| [HAAs] = 249.948 − 103.314 [UV], R2 = 0.015 |
[HAAs] = 13.044 + 155.556 [UV], R2 = 0.163 |
| [HAAs] = 237.547 + 0.024 [TOC], R2 = 0.001 |
[HAAs] = 17.829 + 0.201 [TOC], R2 = 0.042 |
| [HAAs] = 263.997 − 38.113 [Turb.], R2 = 0.052 |
[HAAs] = 14.132 + 8.634 [Turb.], R2 = 0.094 |
| [HAAs] = 7.228 × 10⁶ × [FC]0.230[Cond.]−0.406[pH]−3.426[UV]0.276[TOC]−0.049[Turb.]−0.462, R2 = 0.614b |
| [HAAs] = 5.420 × 10 × [FC]0.119[Cond.]−2.749[pH]10.234[UV]1.625[TOC]−0.020[Turb.]0.032, R2 = 0.798c |
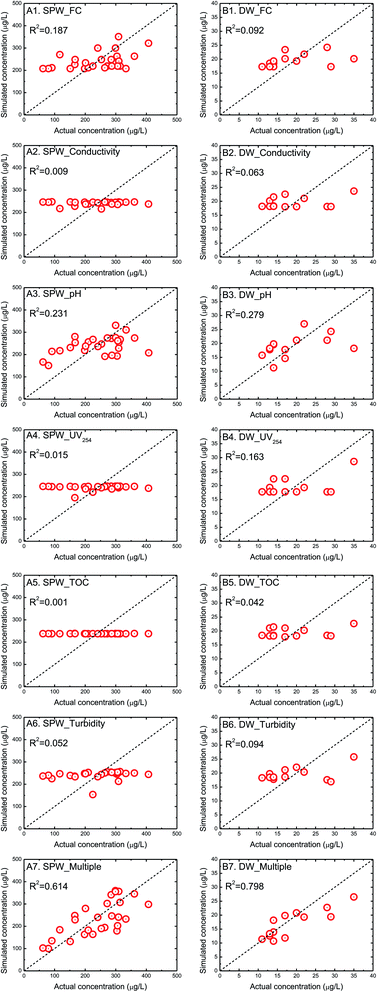 |
| | Fig. 2 The actual and simulated HAA concentrations in SPWs (A) and DWs (B). | |
Considering the poor correlation between HAAs and the individual water parameter, a power function model correlating HAAs with multiple water quality parameters was formulated. The power function model better correlated HAAs with multiple parameters, reflected by the higher correlation coefficients of 0.614 for SPWs and 0.798 for DWs (Table 4). The correlation of field-based data seems not as good as that of laboratory-based one because of some uncontrollable conditions in real water environment (R2: 0.56–0.92 vs. >0.8).38,40–42 It indicates that the formation of HAAs should be a combined result of disinfectants, organic compounds and reaction conditions. It seems that most models have the tendency to overestimate at the low HAA concentrations and underestimate at the high HAA concentrations. These trends are similar to the HAA prediction models developed in DW matrix.18,43 These model equations can assist the judgement of the relative importance of individual parameter to HAA formation and may somehow guide the decision makers to suggest the appropriate actions to minimize HAA formation. For example, the positive power exponents of free chlorine in models for both SPWs and DWs demonstrated the positive correlation between free chlorine and HAAs, which indicates that HAA minimization might be achieved by reducing chlorine dosage.
3.4 Human exposure assessment
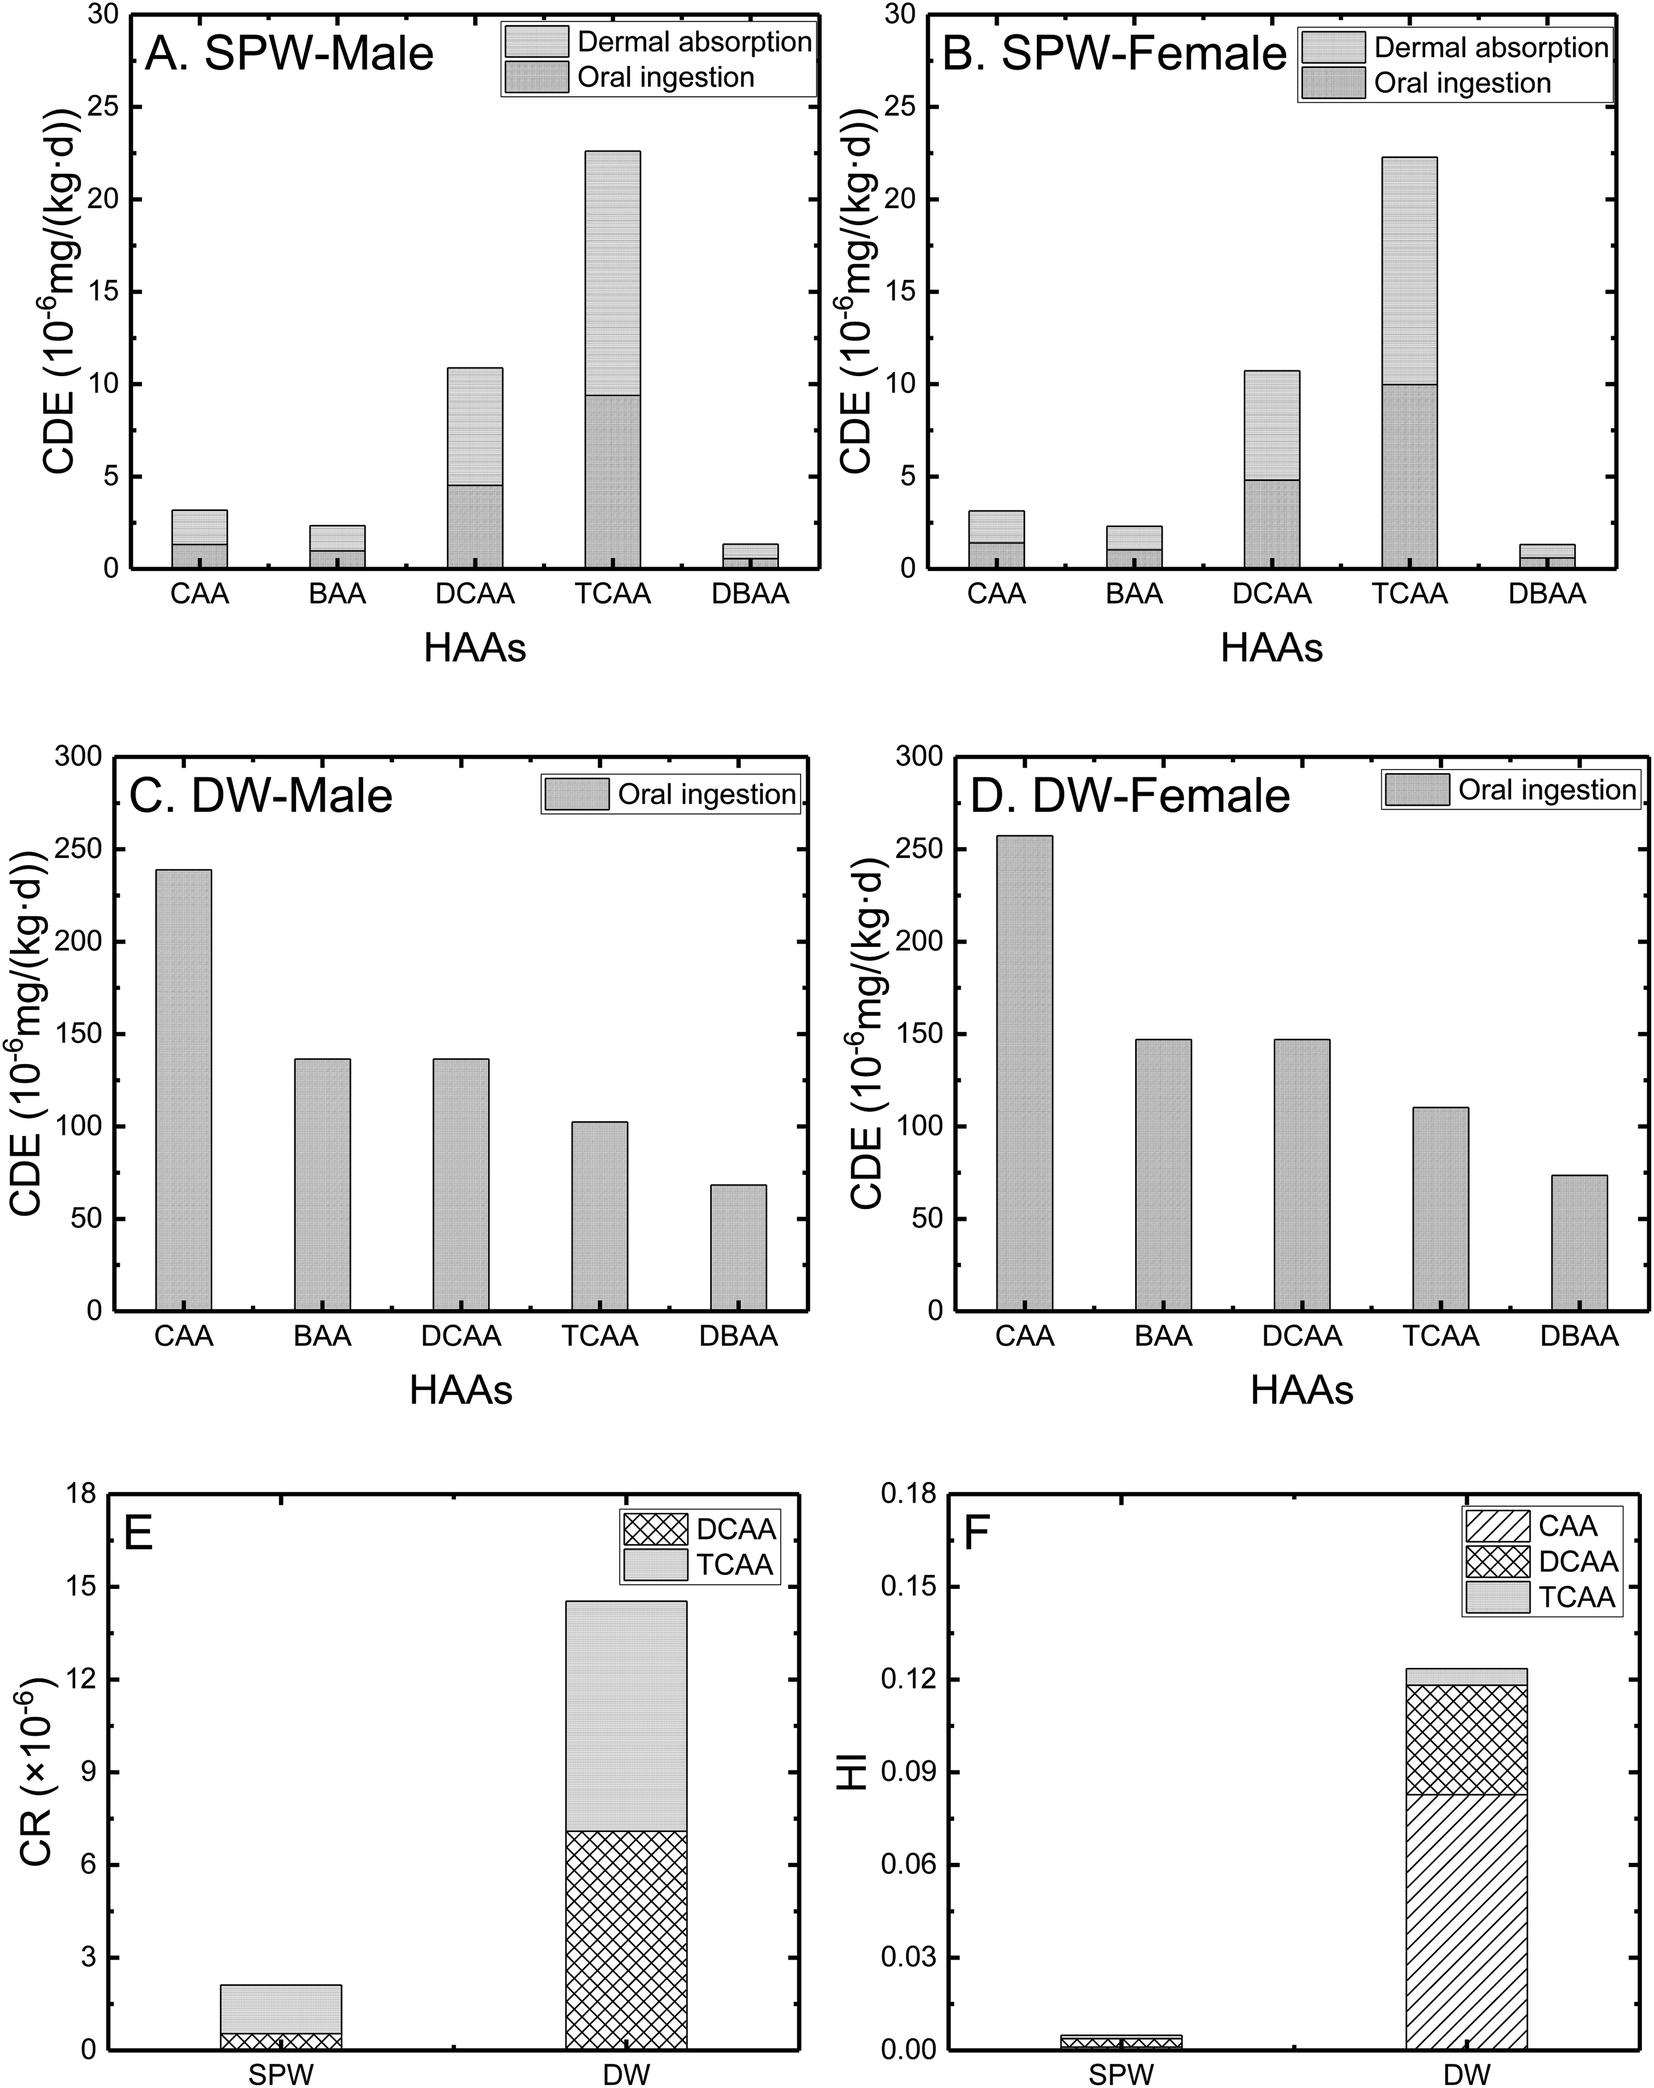
The chronic daily exposure (i.e., dermal absorption and oral ingestion via SPWs, and sole oral ingestion via DWs) by males and females has been shown in Fig. 3A–D. The difference of CDE between males and females was not significant in both SPWs and DWs. The CDE by each HAA was in a range of 1.3–22.6 × 10⁻⁶ mg (kg d)−1 in SPWs, and 6.8–25.7 × 10⁻⁵ mg (kg d)−1 in DWs. The CDE via DWs was nearly one order of magnitude higher than that via SPWs, attributing to the significantly higher ingestion rate of DWs than SPWs (2.14 vs. 0.6 L per day). Swimmers exposed significantly to TCAA and DCAA (i.e., CDE of 1.1 × 10⁻⁵ mg (kg d)−1 for DCAA and 2.3 × 10⁻⁵ mg (kg d)−1 for TCAA for males), due to their several times' higher concentrations compared to other HAA compounds in SPWs (Fig. 1). It seems that dermal absorption was the main human exposure pathway during pool activities (i.e., accounting for 58.5% of the total CDE for males), which is consistent with the existed research findings.44 The CDE to each HAA in DWs followed the same decreasing order of CAA > BAA ≈ DCAA > TCAA > DBAA as its concentrations.
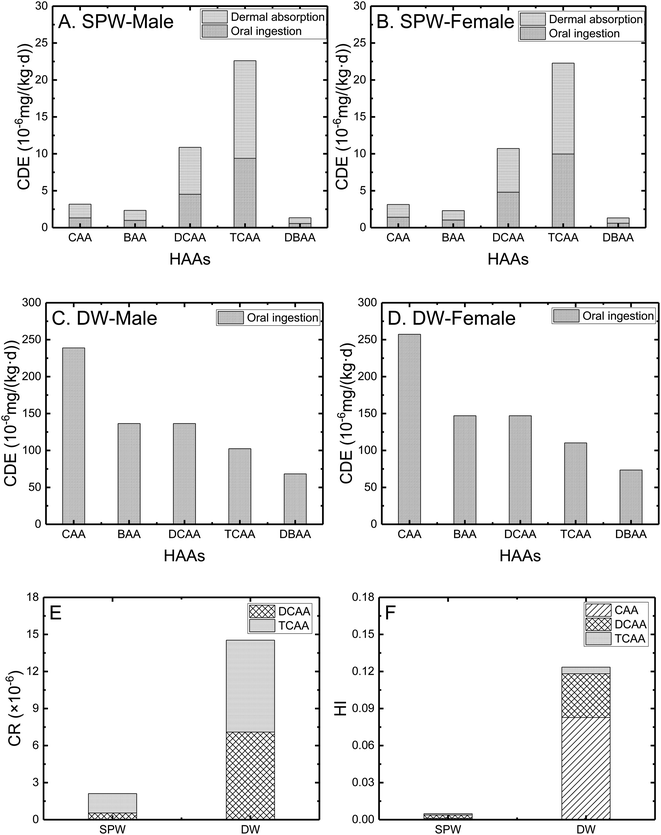 |
| | Fig. 3 Chronic daily exposure of humans to HAAs via SPWs (A and B) and DWs (C and D), and the corresponding cancer risk (E) and hazard index (F). | |
The cancer risk as shown in Fig. 3E was the average of males and females considering the insignificant difference caused by different genders (the same for hazard index in Fig. 3F). Only HAAs with the available constants (i.e., CSF and RfD) were included. The total cancer risk of DCAA and TCAA in DWs was ∼1.5 × 10⁻⁵, nearly one order of magnitude higher than that in SPWs (∼2 × 10⁻⁶). The cancer risk values were not higher than EPA's usual excess cancer risk range of 10−6 to 10−4 (ref. 45) and comparable with previous studies.15,44,46 The non-carcinogenic risk of humans exposed in DWs was higher than that in SPWs (indicated by hazard index, 0.12 vs. 0.005, Fig. 3F), and both hazard indexes were lower than the threshold of 1.0.45 It provides a precise assessment of chronic daily exposure, cancer risk, and non-cancer risk to HAAs by citizens in Shanghai and shows that the predicted human exposure to HAAs via both water matrices is within the acceptable levels. Human exposure assessment in this study was based on theoretical calculation rather than experimental validation, since the latter was out of the scope/control of this work (as human subject involved research requires specific permission). There will be inevitably some uncertain factors, i.e., actual exposure frequency, local water sanitation, human body constitution, physical protection, etc., affecting the accuracy of the results. For example, wearing long-sleeved suit reduces the body contact with water and therefore reduces human exposure. These additional potential influencing factors should be systematically considered for an effective comparison between theoretical and experimental results upon available in the future.
4. Conclusions
This study investigated the environmental occurrence and predicted human exposure of five EPA-regulated HAAs in 27 SPWs and 15 DWs in Shanghai, China. The HAAs in SPWs and DWs were 241 and 19 μg L−1, respectively, with the former dominated by TCAA and DCAA and the latter by CAA. The nearly doubled magnitudes of TOC, DOC, UV254 (as indicators of HAA precursors), and chlorine in SPWs than in DWs might be responsible for the higher HAA formation. The qualification rate of each parameter in SPWs and DWs has been evaluated. A linear model showed the positive correlation between HAAs and free chlorine and TOC. A power function model correlating HAAs with multiple water quality parameters was well developed with the correlation coefficient of 0.614 for SPWs and 0.798 for DWs. These models may provide the insights on how to minimize HAA formation by grasping the relative importance of each parameter and how to predict HAA formation in untreated source water or SPWs subjected to chlorination. Human intake was attributed mainly to TCAA and DCAA in SPWs and CAA in DWs due to their higher concentrations in the corresponding water matrices compared to other HAA compounds. The carcinogenic and non-carcinogenic risk of humans exposed in SPWs and DWs with HAAs is within the acceptable levels as regulated by EPA. This regional case study brought some raw data which may attract the local and even other regional government's attention (especially for the low qualification rate and the high HAA concentration) and contribute to the better water quality management. The model approach to evaluate the relative importance of each parameter to HAA formation should be generally applicable, on the base of which to minimize and predict HAA formation by pool managers. Nevertheless, more statistics for SPW and DW samples are needed to further optimize and validate the model approach, due to the rather complicated water matrix. In addition, experimental validation of human exposure should be of particular significance although such work is out of the scope of this study.
Conflicts of interest
There are no conflicts of interest to declare.
Acknowledgements
This study was sponsored by the Natural Science Foundation of Shanghai (programme number: 19ZR1412800).
References
- B. M. Andersen, Prevention and Control of Infections in Hospitals, Springer, 2019, pp. 815–834 Search PubMed.
- L.-A. Galeano, M. Guerrero-Flórez, C.-A. Sánchez, A. Gil and M.-Á. Vicente, Applications of Advanced Oxidation Processes (AOPs) in Drinking Water Treatment, Springer, 2017, pp. 257–295 Search PubMed.
- T. Manasfi, M. De Meo, B. Coulomb, C. Di Giorgio and J. L. Boudenne, Identification of disinfection by-products in freshwater and seawater swimming pools and evaluation of genotoxicity, Environ. Int., 2016, 88, 94–102 CrossRef CAS PubMed.
- K. Fischer, E. Fries, W. Körner, C. Schmalz and C. Zwiener, New developments in the trace analysis of organic water pollutants, Appl. Microbiol. Biotechnol., 2012, 94, 11–28 CrossRef CAS PubMed.
- S. D. Richardson, M. J. Plewa, E. D. Wagner, R. Schoeny and D. M. Demarini, Occurrence, genotoxicity, and carcinogenicity of regulated and emerging disinfection by-products in drinking water: a review and roadmap for research, Mutat. Res., 2007, 636, 178–242 CAS.
- L. Yang, X. Chen, Q. She, G. Cao, Y. Liu, V. W.-C. Chang and C. Y. Tang, Regulation, formation, exposure, and treatment of disinfection by-products (DBPs) in swimming pool waters: A critical review, Environ. Int., 2018, 121, 1039–1057 CrossRef CAS PubMed.
- A. Marsa, C. Cortes, A. Hernandez and R. Marcos, Hazard assessment of three haloacetic acids, as byproducts of water disinfection, in human urothelial cells, Toxicol. Appl. Pharmacol., 2018, 347, 70–78 CrossRef CAS PubMed.
- M. H. Dore, Threats to Human Health: Use of Chlorine, an Obsolete Treatment Technology, Springer International Publishing, 2015 Search PubMed.
- M. J. Plewa, Y. Kargalioglu, D. Vankerk, R. A. Minear and E. D. Wagner, Mammalian cell cytotoxicity and genotoxicity analysis of drinking water disinfection by-products, Environ. Mol. Mutagen., 2002, 40, 134–142 CrossRef CAS PubMed.
- H. Canada, Guidelines for Canadian drinking water quality: Guideline technical document Haloacetic acids, Water, Air and Climate Change Bureau, Health Environments and Consumer Safety Branch, Health Canada, Ottawa, 2008 Search PubMed.
- USEPA, National primary drinking water regulations: disinfectants and disinfection byproducts; final rule, Fed. Regist., 1998, 63, 69390–69476 Search PubMed.
- L. Yang, C. Schmalz, J. Zhou, C. Zwiener, V. W. C. Chang, L. Ge and M. P. Wan, An insight of disinfection by-product (DBP) formation by alternative disinfectants for swimming pool disinfection under tropical conditions, Water Res., 2016, 101, 535–546 CrossRef CAS PubMed.
- A. Kanan, M. Selbes and T. Karanfil, Recent Advances in Disinfection by-Products, Amer Chemical Soc, Washington, 2015, vol. 1190, pp. 405–430 Search PubMed.
- Y. Shi, W. Ma, F. Han, Y. Geng, X. Yu, H. Wang, S. Y. Kimura, X. Wei, A. Kauffman and S. Xiao, Precise exposure assessment revealed the cancer risk and disease burden caused by trihalomethanes and haloacetic acids in Shanghai indoor swimming pool water, J. Hazard. Mater., 2019, 388, 10 Search PubMed.
- C. Hang, B. B. Zhang, T. T. Gong and Q. M. Xian, Occurrence and health risk assessment of halogenated disinfection byproducts in indoor swimming pool water, Sci. Total Environ., 2016, 543, 425–431 CrossRef CAS PubMed.
- C. Schmalz, Formation, phase transfer and toxicity of halogenated disinfection by-products in the processing cycle of swimming pool water, PhD thesis, 2012.
- S. Simard, R. Tardif and M. J. Rodriguez, Variability of chlorination by-product occurrence in water of indoor and outdoor swimming pools, Water Res., 2013, 47, 1763–1772 CrossRef CAS PubMed.
- USEPA, Empirically based models for predicting chlorination and ozonation by-products - trihalomethanes haloacetic acids chloral hydrate and bromate, 1998 Search PubMed.
- WHO, Swimming pools and similar environments Guidelines for Safe Recreational Water Environments, 2006, vol. 2 Search PubMed.
- USEPA, Risk Assessment Guidance for Superfund (RAGS) Part A., Saúde Pública, 1989, vol. 804, pp. 636–640 Search PubMed.
- R. E. Albert, Carcinogen risk assessment in the US Environmental Protection Agency, Crit. Rev. Toxicol., 1994, 24, 75–85 CrossRef CAS PubMed.
- I. Sutzkover, D. Hasson and R. Semiat, Simple technique for measuring the concentration polarization level in a reverse osmosis system, Desalination, 2000, 131, 117–127 CrossRef CAS.
- S. C. Lee, H. Guo, S. M. J. Lam and S. L. A. Lau, Multipathway risk assessment on disinfection by-products of drinking water in Hong Kong, Environ. Res., 2004, 94, 47–56 CrossRef CAS PubMed.
- Z. S. Wang, X. L. Duan, P. Liu, J. Nie, N. Huang and J. L. Zhang, Human Exposure Factors of Chinese People in Environmental Health Risk Assessment, Res. J. Environ. Sci., 2009, 22, 1164–1170 CAS.
- L. Jin, H. Kwang-Tae and Z. Kyung-Duk, Characteristics of trihalomethane (THM) production and associated health risk assessment in swimming pool waters treated with different disinfection methods, Sci. Total Environ., 2009, 407, 1990–1997 CrossRef PubMed.
- H. Chen, Exposure evaluation of trihalomethane acetic acid disinfection by-products from drinking water in S city residents, Fudan University, 2012 Search PubMed.
- X. Xu, T. M. Mariano, J. D. Laskin and C. P. Weisel, Percutaneous absorption of trihalomethanes, haloacetic acids, and haloketones, Toxicol. Appl. Pharmacol., 2002, 184, 19–26 CrossRef CAS PubMed.
- M. J. Chen, C. H. Lin, J. M. Duh, W. S. Chou and H. T. Hsu, Development of a multi-pathway probabilistic health risk assessment model for swimmers exposed to chloroform in indoor swimming pools, J. Hazard. Mater., 2011, 185, 1037–1044 CrossRef CAS PubMed.
- G. White, Handbook of chlorination and alternative disinfectants, John Wiley and Sons, New York, 1999 Search PubMed.
- S. Chowdhury, K. Alhooshani and T. Karanfil, Disinfection byproducts in swimming pool: Occurrences, implications and future needs, Water Res., 2014, 53, 68–109 CrossRef CAS PubMed.
- L. Yang, J. Zhou, Q. She, M. P. Wan, R. Wang, V. W. C. Chang and C. Y. Tang, Role of calcium ions on the removal of haloacetic acids from swimming pool water by nanofiltration: Mechanisms and implications, Water Res., 2017, 110, 332–341 CrossRef CAS PubMed.
- W. L. Bradford, What bathers put into a pool: a critical review of body fluids and a body fluid analog, Int. J. Aquat. Res. Educ., 2014, 8, 168–181 CrossRef.
- X. Wang, M. G. Leal, X. Zhang, H. Yang and Y. Xie, Haloacetic acids in swimming pool and spa water in the United States and China, Front. Environ. Sci. Eng., 2014, 1–5 Search PubMed.
- T. Bond, J. Huang, N. J. D. Graham and M. R. Templeton, Examining the interrelationship between DOC, bromide and chlorine dose on DBP formation in drinking water - A case study, Sci. Total Environ., 2014, 470, 469–479 CrossRef PubMed.
- R. Fabris, C. W. K. Chowa, M. Drikas and B. Eikebrokk, Comparison of NOM character in selected Australian and Norwegian drinking waters, Water Res., 2008, 42, 4188–4196 CrossRef CAS PubMed.
- T. Glauner, P. Waldmann, F. H. Frimmel and C. Zwiener, Swimming pool water - fractionation and genotoxicological characterization of organic constituents, Water Res., 2005, 39, 4494–4502 CrossRef CAS PubMed.
- K. M. S. Hansen, S. Willach, M. G. Antoniou, H. Mosbcek, H.-J. Albrechtsen and H. R. Andersen, Effect of pH on the formation of disinfection byproducts in swimming pool water – Is less THM better?, Water Res., 2012, 46, 6399–6409 CrossRef CAS PubMed.
- R. Sadiq and M. J. Rodriguez, Disinfection by-products (DBPs) in drinking water and predictive models for their occurrence: A review, Sci. Total Environ., 2004, 321, 21–46 CrossRef CAS PubMed.
- C. M. M. Bougeard, I. H. S. Janmohamed, E. H. Goslan, B. Jefferson, J. S. Watson, G. H. Morgan and S. A. Parsons, Parameters affecting haloacetic acid and trihalomethane concentrations in treated UK drinking waters, ACS Symp. Ser., 2008, 995, 95–108 CrossRef CAS.
- AWWARF, Disinfection/Disinfection By-Products Data Base and Model Project, Rept. AWWA, Denver, Colo, 1991, pp. 2–84 Search PubMed.
- J. B. Serodes, M. J. Rodriguez, H. M. Li and C. Bouchard, Occurrence of THMs and HAAs in experimental chlorinated waters of the Quebec City area (Canada), Chemosphere, 2003, 51, 253–263 CrossRef CAS PubMed.
- C. M. Villanueva, M. Kogevinas and J. O. Grimalt, Haloacetic acids and trihalomethanes in finished drinking waters from heterogeneous sources, Water Res., 2003, 37, 953–958 CrossRef CAS PubMed.
- J. Sohn, G. Amy, J. W. Cho, Y. Lee and Y. Yoon, Disinfectant decay and disinfection by-products formation model development: chlorination and ozonation by-products, Water Res., 2004, 38, 2461–2478 CrossRef CAS PubMed.
- W. Ounsaneha, P. Kraisin, T. T. Suksaroj, C. Suksaroj and C. Rattanapan, Health risk assessment from haloacetic acids exposure in indoor and outdoor swimming pool water, Asian Environ., 2017, 10, 177–185 Search PubMed.
- USEPA, National primary drinking water regulations: Stage 2 disinfectants and disinfection byproducts rule, Fed. Regist., 2006, 71, 387–493 Search PubMed.
- S. Pan, W. An, H. Li, M. Su, J. Zhang and M. Yang, Cancer risk assessment on trihalomethanes and haloacetic acids in drinking water of China using disability-adjusted life years, J. Hazard. Mater., 2014, 280, 288–294 CrossRef CAS PubMed.
|
| This journal is © The Royal Society of Chemistry 2020 |
Click here to see how this site uses Cookies. View our privacy policy here. 
 Open Access Article
 This Open Access Article is licensed under a Creative Commons Attribution-Non Commercial 3.0 Unported Licence
 *abc,
Yejin Lia,
Weibo Xuea,
Kai Lia,
Yingqi Xiea,
Shujuan Meng
*abc,
Yejin Lia,
Weibo Xuea,
Kai Lia,
Yingqi Xiea,
Shujuan Meng