 Open Access Article
Bullet-like microstructured nickel ammonium phosphate/graphene foam composite as positive electrode for asymmetric supercapacitors
Badr A. Mahmoud,
Abdulmajid A. Mirghni,
Oladepo Fasakin,
Kabir O. Oyedotun and
Ncholu Manyala *
*
Department of Physics, Institute of Applied Materials, SARChI Chair in Carbon Technology and Materials, University of Pretoria, Crn Lynnwood and University Road, Hatfield, Pretoria 0002, South Africa. E-mail: ncholu.manyala@up.ac.za; Tel: + 27 124203549
First published on 24th April 2020
Abstract
Unique microstructured nickel ammonium phosphate Ni(NH4)2(PO3)4·4H2O and Ni(NH4)2(PO3)4·4H2O/GF composite were successfully synthesized through the hydrothermal method with different graphene foam (GF) mass loading of 30, 60 and 90 mg as a positive electrode for asymmetric supercapacitors. The crystal structure, vibrational mode, texture and morphology of the samples were studied with X-ray diffraction (XRD), Raman spectroscopy, Brunauer–Emmett–Teller (BET) surface area analysis and scanning electron microscopy (SEM). The prepared materials were tested in both 3-and 2-electrode measurements using 6 M KOH electrolyte. The composite material Ni(NH4)2(PO3)4·4H2O/60 mg exhibited a remarkable gravimetric capacity of 52 mA h g−1, higher than the 34 mA h g−1 obtained for the Ni(NH4)2(PO3)4·4H2O pristine sample, both at 0.5 A g−1. For the fabrication of the asymmetric device, activated carbon from pepper seed (ppAC) was used as a negative electrode while Ni(NH4)2(PO3)4·4H2O/60 mg GF was adopted as the positive electrode. The Ni(NH4)2(PO3)4·4H2O/60 mg GF//ppAC asymmetric device delivered a specific energy of 52 Wh kg−1 with an equivalent specific power of 861 W kg−1 at 1.0 A g−1 within a potential range of 0.0–1.5 V. Moreover, the asymmetric device displayed a capacity retention of about 76% for over 10![[thin space (1/6-em)]](https://www.rsc.org/images/entities/char_2009.gif) 000 cycles at a high specific current of 10.0 A g−1.
000 cycles at a high specific current of 10.0 A g−1.
1 Introduction
In the past few years, researchers have put intensive effort into energy storage research in order to develop suitable devices to store energy from renewable sources such as hydropower, solar cells and wind. This is because these renewable sources of energy are not available all of the time; for instance, solar energy could only be generated during daylight hours. Therefore, these renewable sources require highly effective energy storing devices. Fuel cells, batteries and electrochemical capacitors are considered to be crucial topics for researchers in the field of energy storage devices.1–3 Based on these features, supercapacitors can be used in an assortment of applications such as in portable electronics, backup energy systems and hybrid vehicles.2,4,5 Referring to their energy storage mechanism, supercapacitors can be divided into two major categories namely: electric double-layer capacitors (EDLCs), and faradaic.6–8 EDLC materials like carbon nanotube, activated carbon and graphene oxide have a high specific surface area and store energy electrostatically in the electrical double layers between the electrode and electrolyte interface. Furthermore, faradaic capacitors such as transition metal oxides (TMOs), transition metal phosphates and conducting polymers store energy in the reversible redox reaction on or near the electrode surface.9–12 Comparing to EDLC, faradaic can deliver higher specific capacity which is ascribed to their rich fast and reversible redox reaction.13–16 Different metal oxides are used as electrodes for supercapacitors, such as RuO2, NiO, CoO2, MnO2, etc.17,18 There are numerous reports on TMOs synthesized with different methods, for instance, metal organic frameworks (MOFs),19 MOF-based materials20 and Co3O4@Co-MOF.21 However, cost implication in some oxide materials such as RuO and high resistance of other transition metal oxides (TMOs) limits heir potential use in energy storage application.Transition/Ammonium phosphates based materials (NH4·MPO4·H2O) (M = Mn2+, Cu2+, Co2+, Ni2+) have been widely used over 50 years as fertilizers, only a few studies have been established on Transition/Ammonium phosphates based materials as electrodes for supercapacitors.22,23,49,50 For Instance, Huan Pang et al.24 synthesized NH4CoPO4·H2O micro bundle using a hydrothermal approach. The samples were tested in both three and two-electrode measurement using 3 M KOH aqueous electrolyte. In two-electrode, graphene nanosheet was used as a negative electrode together with NH4CoPO4·H2O as a positive electrode to form NH4CoPO4·H2O microbundles-graphene nanosheet asymmetric device. The asymmetric device showed maximum specific energy of 26 Wh kg−1 corresponding to the specific power of 788 W kg−1 at 1.5 Ag−1 specific currents. However, Peng Xiao et al.25 synthesized NH4CoxNi1−xPO4·H2O nanostructures via a facile one-step solvothermal method. The synthesized material was assembled in asymmetric device with activated carbon and showed specific energy of 37.5 Wh kg−1 corresponding to the specific power of 826 W kg−1 with a potential window of 0.0–1.65 V in a 3 M KOH.
The high electrical resistance is a major challenge of Ammonium/phosphate material, which restricts the mobility of ions and limits galvanostatic charge–discharge (GCD) capability.26 However, ammonium/phosphate materials own unique advantages over TMOs, such as abundant active sites for reactions with fast interfacial transport of charge carriers by reducing ions' diffusion path length. Besides, the materials possess strong P–O covalent bonds which makes them structurally and chemically very stable. In supercapacitor applications, a short diffusion path length of charge carriers and chemically stable structure of the electrode are very important. To solve the challenge in the electrical resistance of Ammonium/phosphate, graphene foam seems to be effective in the improvement of the electrical conductivity of these potential electrode materials. Hence, the addition of graphene foam (GF) into Ni(NH4)2(PO3)4·4H2O is expected to improve the electrical conductivity of the material and specific surface area which are essential for hybrid material application in supercapacitors.
Herein, Ni(NH4)2(PO3)4·4H2O microstructure with bullet-like morphology was synthesized via a hydrothermal method. Composite materials were also prepared with GF mass loading of 30, 60 and 90 mg to determine the appropriate amount of GF needed to improve the electrochemical properties of Ni(NH4)2(PO3)4·4H2O. All samples were tested in a 3-electrode system to confirm the favourable operating potential window. The composite containing a 60 mg GF Ni(NH4)2(PO3)4·4H2O/60 mg GF proved to deliver a maximum specific capacity of 52 mA h g−1 at a specific current of 0.5 A g−1 in 6 M KOH·Ni(NH4)2(PO3)4·4H2O/60 mg GF composite was used as a positive electrode and activated carbon from pepper seed (ppAC) as a negative electrode in an asymmetric device. The device could work at a wide voltage of 1.5 V and showed specific power and specific energy of 861 W kg−1 and 52 Wh kg−1 respectively at the specific current of 1.0 A g−1. The device has recorded capacity retention of 76% with ∼99% coulumbic efficiency after 10![[thin space (1/6-em)]](https://www.rsc.org/images/entities/char_2009.gif) 000 cycles at 10.0 A g−1 and floating test up to 100 h yielding about a 31% increase of the initial specific capacity.
000 cycles at 10.0 A g−1 and floating test up to 100 h yielding about a 31% increase of the initial specific capacity.
2 Experimental details
2.1 Materials
Ammonium phosphate (N2H9PO4, 98%) and nickel nitrate(II) (Ni(NO3)2·6H2O, 99%) were purchased from Sigma-Aldrich. Potassium hydroxide (KOH, 85%) was purchased from Merck. Nickel foam (1.6 mm, 420 g m2) was purchased from Alantum Chemical Process Technologies, Germany.2.2 Synthesis of Ni(NH4)2(PO3)4·4H2O microstructure
Ammonium phosphate N2H9PO4(1.0 g) and nickel nitrate(II) Ni(NO3)2·6H2O (1.0 g) were added to 15 ml of deionized (DI) water under stirring until the salts were completely dissolved and the solution became homogeneous. The mixture was placed in a Teflon-lined stainless steel autoclave and heated at 200 °C for 45 h. Thereafter, the precipitate was obtained and washed several times with deionized water to remove any impurities possibly remaining in the sample. Then, the sample was allowed to dry in an electric oven at 60 °C overnight to get pristine Ni(NH4)2(PO3)4·4H2O(see Scheme 1).2.3 Synthesis of Ni(NH4)2(PO3)4·4H2O/GF microstructure composite
The graphene foam (GF) used here was synthesized according to the procedure reported in our recent work27 using the chemical vapour deposition (CVD) system. The Ni(NH4)2(PO3)4·4H2O/GF composite was prepared using the same procedure reported in Section 2.2 but with the addition of GF. Briefly, 30, 60 and 90 mg GF was added separately to 15 ml of DI water and sonicated for 24 h at room temperature in order to get well dispersed GF. A mixture of 1.0 g nickel nitrate(II) (Ni(NO3)2·6H2O) and 1.0 g ammonium phosphate (N2H9PO4) were added to GF dispersion. Then the solution was stirred until the salt was completely dissolved to get a homogeneous solution. The mixture was then transferred into Teflon-lined stainless steel autoclave and heated at 200 °C for 45 h. The recovered precipitate was washed with DI water several times to remove any impurities in the final product. Then the sample was dried overnight in an electric oven at 60 °C to get Ni(NH4)2(PO3)4·4H2O/GF composite.2.4 Characterization and fabrication of electrode materials
The structural characterization of samples was done using X-ray Diffractometric technique, XPERT-PRO diffractometer, theta/2 theta geometry. A Bruker BV 2D Phaser Best Benchtop X-ray diffraction (XRD) analyzer with reflection geometry at 2θ values (10–80°) at a step size of 0.005°, equipped with a Cu Kα1 radiation source (λ = 0.15406 nm) at 50 kV and 30 mA was utilized to analyse the sample's structural phase at 2θ values, ranging from 10° to 80°. The Raman Microscopy technique (WITec alpha 300 R, Germany), laser wavelength (532 nm), 4 mW laser power was adopted to analyse the vibrational modes of the samples. The specific surface area measurement was done using Quantachrome (NOVAtouch NT 2LX-1, Volts 220, USA) deriving by Quantachrome TourchWin Software Version: 1.22. Zeiss Ultra plus 55 field emission scanning electron microscope (FE-SEM) was used to determine the morphology of the as-prepared samples. The powdered sample was first sprinkled on a carbon tape which was stacked onto an aluminium plate used as substrate and then coated with graphite, for a very short time (∼30–40 s) to make the material conductive for the analysis. For the preparation of electrodes, 80% of active materials was mixed with 10% of the binder (polyvinylidene difluoride (PVDF)), and 10% carbon black as conducting agent to compensate for resistance emanating from PVDF. Later on, 1-methyl-2-pyrrolidinone (NMP) was added in drops to make a slurry and coated on the current collector (nickel foam) with a diameter (1 cm × 1 cm) and dried overnight in an electric oven at 60 °C to evaporate NMP that was added to the electrode during the preparation. Then, the electrode was subject to pressing under a pressure of 15 MPa.The final masses of the 3-electrode were approximately 2.5 mg cm−2 each. The performance of the cell was tested using the electrochemical instrument (Bio-Logic VMP-300) controlled by EC-lab V11.27 software at room temperature. A glassy carbon and Ag/AgCl were used as a counter electrode, and reference electrode respectively. The 6 M KOH basic electrolyte was used in both three and two electrodes set-up. A Swagelok cell was used for 2-electrode measurements and microfiber filter paper as a separator. The cyclic voltammetry (CV) test was measured to confirm the cell electrochemical behaviour of the materials and operating potential window. The GCD test was carried out to calculate the specific capacity in three and two electrode measurements. The capacitive properties and conductivity of the electrode were investigated using electrochemical impedance spectroscopy (EIS) test in the frequency range of 100 kHz to 0.01 Hz.2.5 Theoretical calculations
The specific capacity/capacitance of hybrid materials was calculated using eqn (1):
 | (1) |
For the fabrication of an asymmetric device, Ni(NH4)2(PO3)4·4H2O/60 mg GF and (ppAC) are combined as positive and negative electrodes respectively. The charge balancing is calculated from eqn (2):
| m(+)Is(+)Δt+ = m(−)Is(−)Δt− | (2) |
Amass ratio between Ni(NH4)2(PO3)4·4H2O/60 mg GF and (ppAC) is calculated as:
 | (3) |
From eqn (2) and (3), the masses of negative and positive electrode are 2.4 mg cm−2 and 1.6 mg cm−2 respectively. The total mass of both electrodes is 4 mg cm−2.
The calculations of specific energy (Es) and specific power (Ps) of the asymmetric device were calculated using the following eqn (4) and (5):
 | (4) |
 | (5) |
 represents area under the discharge profile for the full cell.
3 Results and discussion
3.1 Physico-chemical analysis
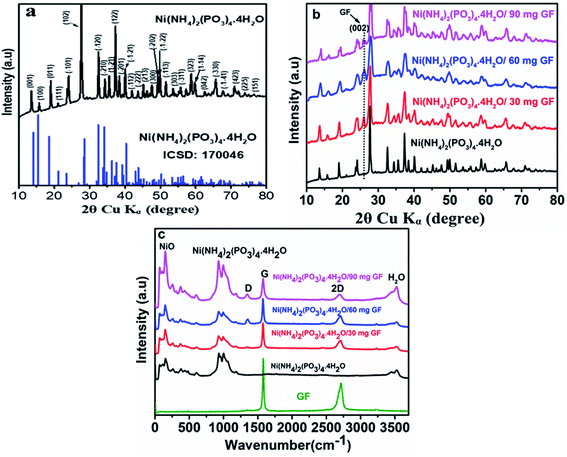
Fig. 1(a) displays the XRD patterns of Ni(NH4)2(PO3)4·4H2O as pristine material and the corresponding inorganic crystal structure database (ICSD) no.170046 with chemical formula Ni (NH4)2(PO3)4·4H2O), triclinic structure, space group:![[P with combining macron]](https://www.rsc.org/images/entities/i_char_0050_0304.gif) 1(2) and cell ratios: a/b = 0.9608, b/c = 0.9396 and c/a = 1.1077. The strong and narrow peaks were observed, indicating the crystallinity of the as-prepared materials. This analysis was carried out using the Diamond software -molecular crystal and structure visualization.28 Fig. 1(b) shows the diffraction pattern of Ni (NH4)2(PO3)4·4H2O and Ni (NH4)2(PO3)4·4H2O/GF composite with different GF mass loading. From the figure, it is observed that the addition of GF does not change the XRD pattern of the pristine Ni (NH4)2(PO3)4·4H2O. However, a peak (002) at about 26° corresponds to GF in the composite.29–31 Fig. 1(c) shows Raman vibrational modes of pure Graphene foam (GF), pristine Ni(NH4)2(PO3)4·4H2O and composite Ni(NH4)2(PO3)4·4H2O with various GFmass loading. The pure graphene foam shows the clear peaks at about 1578 and 2715 cm−1. These peaks are assigned to G and 2D vibrational modes respectively. A G mode expresses carbon–carbon vibration mode while 2D mode expresses the double resonance process.32,33 In the spectrum of the pristine Ni(NH4)2(PO3)4·4H2O sample, there are two peaks at around 928 and 995 cm−1 that were observed and referred to PO4 and PO2 vibrational stretching modes respectively. The vibration modes of NiO are showing at 66, 107.3, 149, 260, 375, 426 and 602 cm−1 agreeing with what was reported in the literature, the vibration modes could be allocated to Ni–O vibrational modes.34,35 The peak at about 3528 cm−1 is assigned to a vibration mode of H2O.36 A slight reduction in the intensity of 2D peak was observed in the composite samples as compared to GF sample. This decrease in the 2D peak is a clear indication of the interaction between GF and the phosphate material because this mode is very sensitive to defects.37,38 This explanation is also confirmed by a prominent appearance of D peak at about 1348 cm−1 as the GF mass loading is increased.
1(2) and cell ratios: a/b = 0.9608, b/c = 0.9396 and c/a = 1.1077. The strong and narrow peaks were observed, indicating the crystallinity of the as-prepared materials. This analysis was carried out using the Diamond software -molecular crystal and structure visualization.28 Fig. 1(b) shows the diffraction pattern of Ni (NH4)2(PO3)4·4H2O and Ni (NH4)2(PO3)4·4H2O/GF composite with different GF mass loading. From the figure, it is observed that the addition of GF does not change the XRD pattern of the pristine Ni (NH4)2(PO3)4·4H2O. However, a peak (002) at about 26° corresponds to GF in the composite.29–31 Fig. 1(c) shows Raman vibrational modes of pure Graphene foam (GF), pristine Ni(NH4)2(PO3)4·4H2O and composite Ni(NH4)2(PO3)4·4H2O with various GFmass loading. The pure graphene foam shows the clear peaks at about 1578 and 2715 cm−1. These peaks are assigned to G and 2D vibrational modes respectively. A G mode expresses carbon–carbon vibration mode while 2D mode expresses the double resonance process.32,33 In the spectrum of the pristine Ni(NH4)2(PO3)4·4H2O sample, there are two peaks at around 928 and 995 cm−1 that were observed and referred to PO4 and PO2 vibrational stretching modes respectively. The vibration modes of NiO are showing at 66, 107.3, 149, 260, 375, 426 and 602 cm−1 agreeing with what was reported in the literature, the vibration modes could be allocated to Ni–O vibrational modes.34,35 The peak at about 3528 cm−1 is assigned to a vibration mode of H2O.36 A slight reduction in the intensity of 2D peak was observed in the composite samples as compared to GF sample. This decrease in the 2D peak is a clear indication of the interaction between GF and the phosphate material because this mode is very sensitive to defects.37,38 This explanation is also confirmed by a prominent appearance of D peak at about 1348 cm−1 as the GF mass loading is increased.
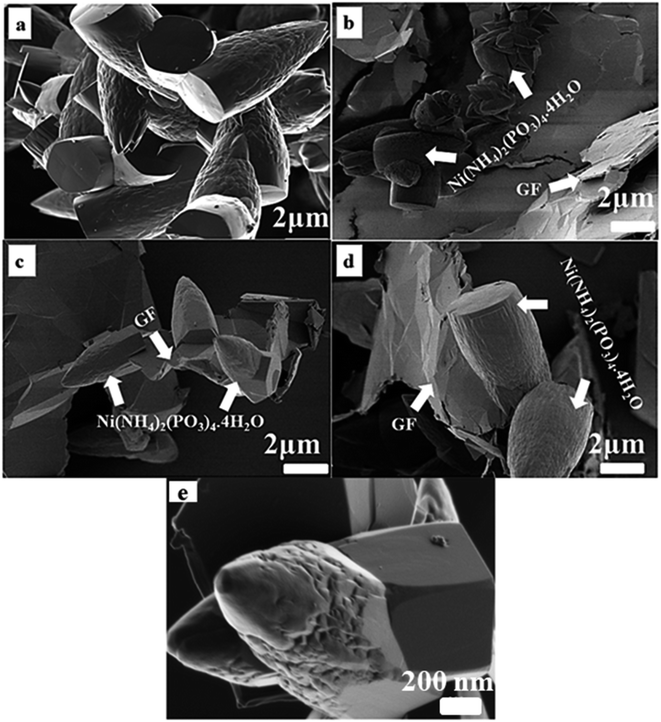
Fig. 2(a) shows the N2 isotherms and pore size distribution of Ni(NH4)2(PO3)4·4H2O and Ni(NH4)2(PO3)4·4H2O/GF composite with different GF mass-loading. As can be observed in Fig. 2(a) all the samples show a type III isotherm with hysteresis loop H3 indicating that materials are having both micropores and mesopores.39 The micropores are for the charge to be stored and ion adsorption whereas mesopores are channels allowing the ions to move between the electrolyte and electrode/electrolyte interface. Fig. 2(b) displays the pore size distribution obtained with the Barrett–Joyner–Halenda (BJH) exploration in the range of 0–12 nm. The pore size distribution of all samples showed the existence of mesoporous and micropores because of three peaks seen at about 1.7, 2.4 and 3.9 nm respectively. The specific surface areas recorded for Ni(NH4)2(PO3)4·4H2O, Ni(NH4)2(PO3)4·4H2O/30 mg GF, Ni(NH4)2(PO3)4·4H2O/60 mg GF, and Ni(NH4)2(PO3)4·4H2O/90 mg GF composites were 2.627, 3.634, 53.304 and 15.574 m2 g−1 respectively. In the case of Ni(NH4)2(PO3)4·4H2O/60 mg GF, as the applied pressure with respect to atmospheric pressure increases from 0 to 1.0, the sample was observed to absorb nitrogen atoms drastically compared to the other samples, which could be due to appropriate amount of GF contained in the sample. Also, the sample's opened adsorption/desorption isotherm compared to that of the other samples further affirms a strong synergy between Ni(NH4)2(PO3)4·4H2O material and its 60 mg GF composite. This was also observed from the composites' pore size distribution and thus accounted for the Ni(NH4)2(PO3)4·4H2O/60 mg GF higher specific surface area of 53.304 m2 g−1 compared to the other samples. The high specific surface area obtained for Ni(NH4)2(PO3)4·4H2O/60 mg GF can be accredited to the existence of the appropriate amount of graphene foam in the composite. Graphene is known to exhibit exceptionally high theoretical specific surface area of up to 2675 m2 g−1. Therefore, an introduction of its appropriate amount into the active matrix of the bullets-like composite sample resulted in effective synergy with the graphene sheet been firmly attached within and around the material's bullets-like particles as shown by the SEM images (Fig. 3(c, d)). The moderate dispersion of Ni(NH4)2(PO3)4·4H2O within the graphene sheet provides the needed large surface required for efficient charge transport and storage. However, one should be cautious about the appropriate amount of GF to be added to effectively synergize with the material since overlaying of GF on a material may result in less conductivity and lower surface area, which will adversely affect the electrochemical performance.
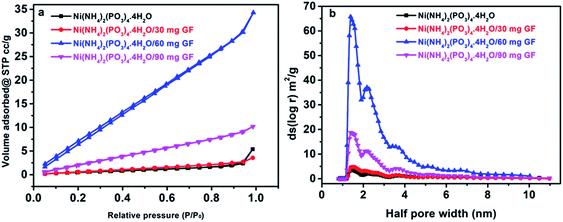 | ||
| Fig. 2 (a) The nitrogen isotherms and (b) pore size distribution of as-prepared Ni(NH4)2(PO3)4·4H2O and Ni(NH4)2(PO3)4·4H2O/GF composite samples. | ||
Consequently, the electrochemical performance of Ni(NH4)2(PO3)4·4H2O/60 mg GF composite is expected to have better electrochemical properties than other composites as well as pristine samples.
Fig. 3 displays the SEM images of as-prepared pristine Ni(NH4)2(PO3)4·4H2O and composite Ni(NH4)2(PO3)4·4H2O/GF with different GF mass loading. Fig. 3(a) shows pristine Ni(NH4)2(PO3)4·4H2O in low magnification. It is evident that the as-prepared Ni(NH4)2(PO3)4·4H2O is made up of uniform micro bullet-like particles. Fig. 3(b–d) are SEM images of Ni(NH4)2(PO3)4·4H2O/GF composites. Also, Fig. 3(c) clearly showed the growth of grains on the Graphene sheets. Fig. 3(e) shows the high-resolution SEM image of the Ni(NH4)2(PO3)4·4H2O/60 mg GF composite, which clearly shows a bullet-like structure.
3.2 Electrochemical characterization of the materials
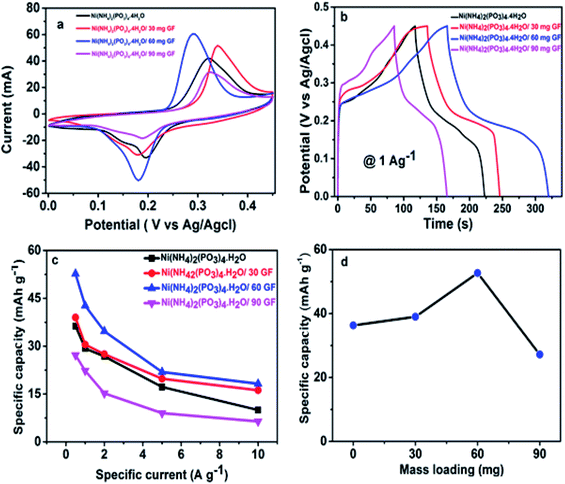
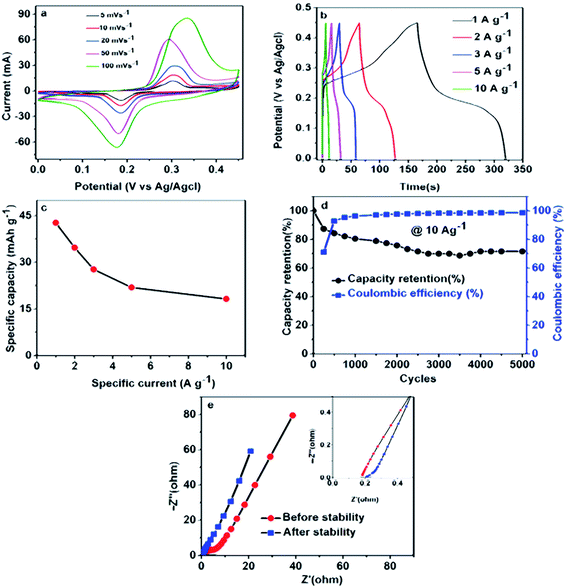
Fig. 4(a) shows CV curves of the pristine Ni(NH4)2(PO3)4·4H2O and Ni(NH4)2(PO3)4·4H2O/GF composite with various GF mass loading at 50 mV s−1 scan rate in the voltage range of 0.0 to 0.45 (V vs. Ag/AgCl) using 6 M KOH electrolyte. The curves show a clear oxidation and reduction peaks at about 0.18 and 0.26 V respectively for the pristine and composite samples suggesting a faradaic characteristic signature of the material.56,57 The two defined peaks observed in the CV curves in Fig. 4(a) are mainly due to the variable redox reaction between Ni2+ ↔ Ni3+ process.35 Fig. 4(a), shows that the addition of GF to the pristine material up to 60 mg increased considerably the current response of the pristine material and thereafter, a further increase of GF mass loading was noticed to have decreased the performance of the sample. It was observed that the 60 mg GF was the moderate added amount to effect maximum electrical conduction in the pristine material beyond which it became saturated in mass and lead to a loss of performance.40–42 A further addition of 90 mg GF to pristine material was found to have a negative impact on the electrochemical properties of the electrode, which clearly shows a sharp drop in the current response of the electrode material. This could be due to excess carbon content in the matrix of the pristine Ni(NH4)2(PO3)4·4H2O resulting in less efficient electrode/electrolyte interaction thus the decrease in performance of the composite. Fig. 4(b) compares the GCD curves of the pristine and composite materials at a specific current of 1.0 A g−1. It could also be seen that Ni(NH4)2(PO3)4·4H2O/60 mg GF composite is delivering a longer discharge time in agreement with CVs current response in Fig. 4(a). Fig. 4(c) displays specific capacity (mA h g−1) as a function of specific current. A composite with 60 mg GF delivered the highest values of specific capacities at different specific currents in agreement with CV curves and GCD curves in Fig. 4(a and b). The prepared electrodes gave a maximum specific capacity value of 52.7 mA h g−1 for Ni(NH4)2(PO3)4·4H2O/60 mg GF composite at 0.5 A g−1 compared to 36.3, 39.0 and 27.2 mA h g−1 of the pristine Ni(NH4)2(PO3)4·4H2O/30 mg GF and Ni(NH4)2(PO3)4·4H2O/90 mg GF respectively.Fig. 5(a) displays the CV curve of Ni(NH4)2(PO3)4·H2O/60 mg GF at various scan rates 5–100 mV s−1 in the voltage range of 0.0 to 0.45 V. The CV curves of the Ni(NH4)2(PO3)4·H2O/60 mg GF composite show quite visible peaks of oxidation and reduction at 0.18 V and 0.28 V respectively. These peaks are associated with the reversible electrochemical activities of Ni2+ ↔ Ni3+ at an interface between the electrode and electrolyte. This behaviour suggests that the material displays a faradaic signature. Fig. 5(b) shows GCD plots at a specific current range of 1–10 A g−1. It can be observed that at low specific current, the composite material takes longer time to charge and discharge; this can be explained as a result of enough time for ions to interact within the material at a low specific current. Fig. 5(c) shows the specific capacity of Ni(NH4)2(PO3)4·H2O/60 mg GF at different specific currents using the eqn (1). Fig. 5(d) shows a plot of cyclic test for the Ni(NH4)2(PO3)4·H2O/60 mg GF composite. A ∼99% coulombic efficiency was recorded for the material for over 5000 cycles at a specific current of 10.0 A g−1. The material also proved satisfying capacity retention of 72% as can be seen from the figure. Looking at the capacity retention, it can be seen that the specific capacity has dropped rapidly in the first 250 cycles, which might be due to the activation of the electrode material. Afterward, there is a gradual decline of specific capacity in the next cycles until 3500 then stabilized at about 73% of its initial specific capacity for 5000 cycles. However, the coulombic efficiency maintained almost 99% throughout 5000 cycles.35,43 This is similar to the work reported by Mirghni et al.39 Fig. 5(e) shows the Nyquist plot of Ni (NH4)2(PO3)4·H2O/60 mg GF composite before and after stability. The equivalent series resistance (ESR) values of Ni(NH4)2(PO3)4·H2O/60 mg GF electrode before and after stability were 0.185 Ω and 0.200 Ω respectively. The RS values indicate no significant change in the values before and after stability. In fact, after stability, the Nyquist plot curve was rather seen with a slight shift towards the Y-axis and a reduction in diffusion length. This enhancement is attributed to more accessibility of ions in the electrode material.37
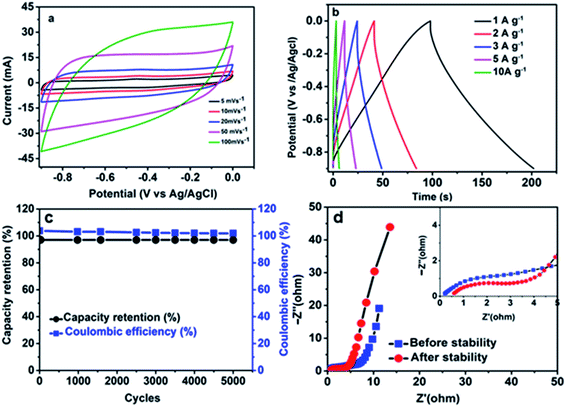
The electrochemical performances of the activated carbon from pepper seed (ppAC) were also tested in 6 M KOH and plotted in Fig. 6(a–d). In Fig. 6(a) as a negative electrode, CV plots display a good behaviour of EDLC. The GCD plot in Fig. 6(b) gives a specific capacity of 29, 23, 20, 16 and 8 mA h g−1 at corresponding specific currents of 1.0–10.0 A g−1 respectively. Fig. 6(c) displays stability of the ppAC electrode after being subjected to lengthy GCD of 5000 cycles at 10.0 A g−1. Coulumbic efficiency remains 100% throughout the cycles with capacitance retention of 98% over 5000 GCD cycles. Fig. 6(d) shows the EIS plot for ppAC electrode, which gave the values of Rs before and after stability as 0.2 Ω and 0.5 Ω, respectively. The exceptional performance of ppAC in 6 M KOH suggests that the porous carbon could be a good negative electrode for the design of an asymmetric device. The detailed carbonization method and full characterization of activated carbon from pepper seed ppAC can be found in the previously published work.44
The composite material Ni(NH4)2(PO3)4·4H2O/60 mg GF showed excellent electrochemical performance as a positive electrode and ppAC as a negative electrode, therefore the electrodes were assembled as an asymmetric device and tested in two-electrode measurement.
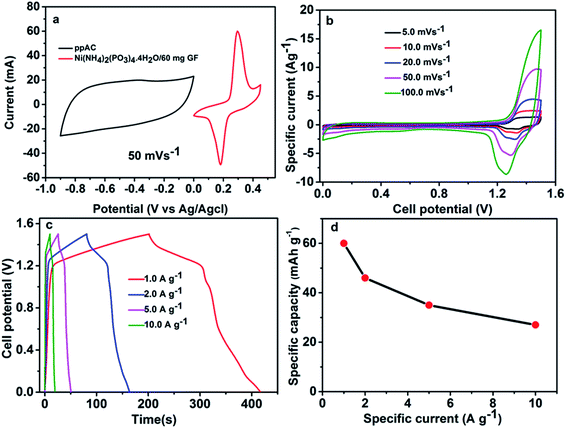
Fig. 7(a) depicts CV curves of the Ni(NH4)2(PO3)4·4H2O/60 mg GF and ppAC electrodes at 50 mV s−1 in three-electrode measurements respectively, stable at working potential range of −0.9 to 0.0 V for ppAC electrode and 0.0 V to 0.45 V for Ni(NH4)2(PO3)4·4H2O/60 mg GF electrode. Fig. 7(b) displays the CV curves of Ni(NH4)2(PO3)4·4H2O/60 mg GF//ppAC asymmetric device at different scan rates from 5–100 mV s−1 within a stable potential window of 1.5 V. The curves show an EDLC nature at the potential range of 0.0–1.1 V and a faradaic nature at the range of 1.1 and 1.5 V. The presence of both charge storage mechanisms confirms the impact of metal phosphate in the positive part and the activated carbon (AC) in the negative part. However, it can be observed from CV curves at different scan rates that the combination EDLC (non-faradaic) and battery-type (faradaic) behaviour are displayed for an asymmetric supercapacitor.10 The GCD curves of the device at different specific currents are displayed in Fig. 7(c). The curves matched well with CV curves plotted in Fig. 7(b), as they depict a combined behaviour between EDLC and faradaic shapes. The obtained values of specific capacity calculated by using eqn (1) are shown in Fig. 7(d) for the asymmetric device. A specific capacity values of 60, 46, 35, and 27 mA h g−1 at a specific current of 1.0, 2.0, 5.0 and 10 A g−1, respectively, were recorded for the device.
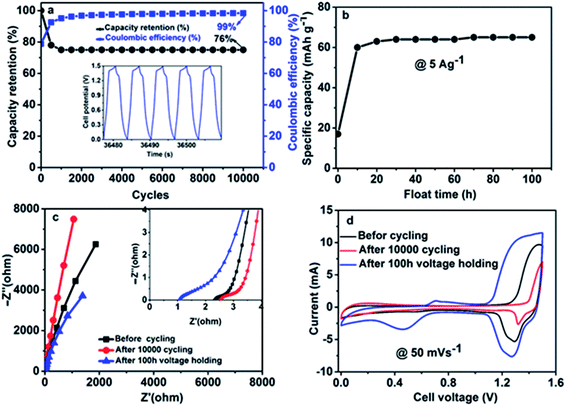
Fig. 8(a, b) shows the device cycle life, this is important to evaluate the performance of supercapacitors. In Fig. 8(a), a constant GCD test was conducted for 10![[thin space (1/6-em)]](https://www.rsc.org/images/entities/char_2009.gif) 000 cycles at 10 A g−1. In the first 2000 cycles, the specific capacity is not stable, after that, it shows good stability and this was connected to the reactivation of some active sites within the matrix of the hybrid device. However, the capacity retention was maintained at 65% up to 10
000 cycles at 10 A g−1. In the first 2000 cycles, the specific capacity is not stable, after that, it shows good stability and this was connected to the reactivation of some active sites within the matrix of the hybrid device. However, the capacity retention was maintained at 65% up to 10![[thin space (1/6-em)]](https://www.rsc.org/images/entities/char_2009.gif) 000 cycles with 99% coulumbic efficiency. The inset to Fig. 8(a) shows a portion of GCD curves for a few cycles' numbers. The floating test also called the voltage-holding test, is an established alternative and dependable technique for analysing the stability of supercapacitor electrodes. The technique provides a factually correct resistance effect after being subjected to maximum potential, which may be close to practical application.51 The technique in this study, was done at a constant load by holding the device at its highest potential and estimating its capacity over the entire period as depicted in Fig. 8(b) in a repeated sequence. The figure shows a variation of the device's specific capacity over a floating time of 100 h at its peak operating potential, with the specific capacity being monitored at a time interval of 10 h. The test carried out at a specific current of 5.0 A g−1 is displayed in Fig. 8(b). As it can be observed in the first 10 h, the specific capacity increased drastically due to inaccessible redox sites during the aging time. Then the floating test retained a stable specific capacity over 100 hours. Fig. 8(c) displays Nyquist plots of Ni(NH4)2(PO3)4·4H2O/60 mg GF//ppAC before stability, after stability and after floating test in the frequency range of 100 kHz to 0.01 Hz. Rs values were recorded as 2.5, 2.4 and 1.02 Ω before stability, after stability and after floating test respectively. It is obvious that the device has been improved after voltage holding, which could be due to the fact that ions have more access to the surface of the electrodes as a result of complete wettability of the material. This is in correlation with the higher CV current response recorded for the asymmetric device after voltage holding as shown in Fig. 8(d).
000 cycles with 99% coulumbic efficiency. The inset to Fig. 8(a) shows a portion of GCD curves for a few cycles' numbers. The floating test also called the voltage-holding test, is an established alternative and dependable technique for analysing the stability of supercapacitor electrodes. The technique provides a factually correct resistance effect after being subjected to maximum potential, which may be close to practical application.51 The technique in this study, was done at a constant load by holding the device at its highest potential and estimating its capacity over the entire period as depicted in Fig. 8(b) in a repeated sequence. The figure shows a variation of the device's specific capacity over a floating time of 100 h at its peak operating potential, with the specific capacity being monitored at a time interval of 10 h. The test carried out at a specific current of 5.0 A g−1 is displayed in Fig. 8(b). As it can be observed in the first 10 h, the specific capacity increased drastically due to inaccessible redox sites during the aging time. Then the floating test retained a stable specific capacity over 100 hours. Fig. 8(c) displays Nyquist plots of Ni(NH4)2(PO3)4·4H2O/60 mg GF//ppAC before stability, after stability and after floating test in the frequency range of 100 kHz to 0.01 Hz. Rs values were recorded as 2.5, 2.4 and 1.02 Ω before stability, after stability and after floating test respectively. It is obvious that the device has been improved after voltage holding, which could be due to the fact that ions have more access to the surface of the electrodes as a result of complete wettability of the material. This is in correlation with the higher CV current response recorded for the asymmetric device after voltage holding as shown in Fig. 8(d).
Fig. 9(a) shows the specific energy vs. specific power for Ni(NH4)2(PO3)4·4H2O/60 mg GF//ppAC at various specific currents also compared to similar devices found in the literature. The higher specific energy of Ni(NH4)2(PO3)4·4H2O/60 mg GF//ppAC asymmetric device was obtained to be 52 Wh kg−1 with a specific power of 861 W kg−1 at 1 A g−1 which are much better than the values reported in the literature.5,22–24,52–55 The phase angle vs. frequency for the Ni(NH4)2(PO3)4·4H2O/60 mg GF//ppAC asymmetric device in Fig. 9(b) shows the phase angle value of about −83°. This value is very near to the phase angle of −90° which suggests that the asymmetric device shows very good capacitive behaviour. The comparisons of the reported results in the literature with this material are included in Table 1 below:
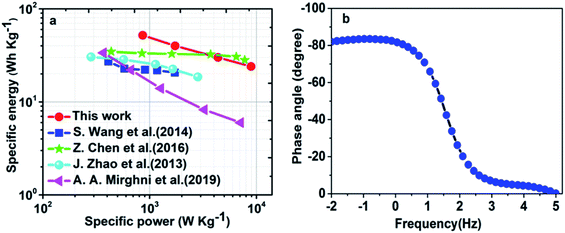 | ||
| Fig. 9 (a) The Ragone plot of Ni(NH4)2(PO3)4·4H2O/60 mg GF//ppAC asymmetric cell and other similar works found in the literature and (b) the phase angle vs. frequency. | ||
| Asymmetric supercapacitors | Cell potential (V) | Specific energy (Wh kg−1) | Specific power (W kg−1) | Cycling stability (%) | Ref. |
|---|---|---|---|---|---|
| NCNP//HPC | 1.6 | 29.5 | 11 | 93.5 after 10![[thin space (1/6-em)]](https://www.rsc.org/images/entities/char_2009.gif) 000 cycles 000 cycles |
23 |
| NH4CoPO4·H2O//GF | 1.1 | 26.6 | 852 | 92.7 after 3000 cycles | 24 |
| NiCo(PO4)3/GF//AC | 1.4 | 34.8 | 377 | 99 after 10![[thin space (1/6-em)]](https://www.rsc.org/images/entities/char_2009.gif) 000 cycles 000 cycles |
5 |
| NCoNiP@NCoNiP//HPC | 1.55 | 44.5 | 7.4 | N/A after 7000 cycles | 45 |
| DBS-Ni2Co1PO4//GF | 1.5 | 36.5 | 150 | N/A | 46 |
| NaMn1/3Co1/3Ni1/3PO4 | 3.0 | 50 | 180 | 95 after 1000 cycles | 47 |
| NaMn1/3Co1/3Ni1/3PO4 | 1.6 | 15 | 400 | N/A | 48 |
| Ni(NH4)2(PO3)4·4H2O/60 mg GF//ppAC | 1.5 | 52 | 861 | 99 after 10![[thin space (1/6-em)]](https://www.rsc.org/images/entities/char_2009.gif) 000 cycles 000 cycles |
This work |
4 Conclusion
Microstructured bullet-like pristine Ni(NH4)2(PO3)4·4H2O and Ni(NH4)2(PO3)4·4H2O/GF composite materials with various graphene foam loading masses were synthesized via hydrothermal method. An addition of GF to the pristine enhanced the electrochemical performance of Ni(NH4)2(PO3)4·4H2O. Also, the specific capacity of Ni(NH4)2(PO3)4·4H2O/GF increased with the amount of graphene mass loading up to 60 mg, and it decreased as it reached 90 mg GF mass loading. Hence, Ni(NH4)2(PO3)4·4H2O/60 mg GF composite was found to be the best sample as compared to the rest of the other samples. This improvement could be due to the good interaction between the Ni(NH4)2(PO3)4·4H2O and GF up to 60 mg.35 The asymmetric device using (ppAC) as a negative electrode and as Ni(NH4)2(PO3)4·4H2O/60 mg GF as a positive electrode, exhibited higher specific energy and power of 52 Wh kg−1 and 861 W kg−1 respectively at 1 A g−1. The device also showed a long-term stability, which retained 65% capacity retention after 10![[thin space (1/6-em)]](https://www.rsc.org/images/entities/char_2009.gif) 000 cycle with 99% coulombic efficiency at 10.0 A g−1. The remarkable performance of the device shows that Ni(NH4)2(PO3)4·4H2O/60 mg GF composite could be a good candidate in the future for high specific energy and moderate specific power of an asymmetric supercapacitor.
000 cycle with 99% coulombic efficiency at 10.0 A g−1. The remarkable performance of the device shows that Ni(NH4)2(PO3)4·4H2O/60 mg GF composite could be a good candidate in the future for high specific energy and moderate specific power of an asymmetric supercapacitor.
Author contributions
All authors have given approval to the final manuscript.Conflicts of interest
There are no conflicts to declare.Acknowledgements
This work is based on research supported by the South African Research Chairs Initiative (SARChI) of the Department of Science and Technology and the National Research Foundation (NRF) of South Africa (Grant No. 61056). Any opinion, finding and conclusion or recommendation expressed in this material is that of the author(s) and the NRF does not accept any liability in this regard. Badr A. Mahmoud acknowledges the financial support from the University of Pretoria, the NRF through the SARChI in Carbon Technology and Materials.References
- P. F. Ribeiro, B. K. Johnson, M. L. Crow, A. Arsoy and Y. Liu, Proc. IEEE, 2001, 89, 1744–1756 CrossRef.
- A. Afif, S. M. Rahman, A. Tasfiah Azad, J. Zaini, M. A. Islan and A. K. Azad, J. Energy Storage, 2019, 25, 100852 CrossRef.
- A. Ehsani, A. A. Heidari and H. M. Shiri, Chem. Rec., 2019, 19, 908–926 CrossRef CAS PubMed.
- F. Barzegar, A. Bello, J. K. Dangbegnon, N. Manyala and X. Xia, Appl. Energy, 2017, 207, 417–426 CrossRef CAS.
- A. A. Mirghni, K. O. Oyedotun, B. A. Mahmoud, A. Bello, S. C. Ray and N. Manyala, Composites, Part B, 2019, 174, 106953 CrossRef CAS.
- T. S. Mathis, N. Kurra, X. Wang, D. Pinto and P. Simon, Adv. Energy Mater., 2019, 9, 1–13 Search PubMed.
- M. R. Lukatskaya, B. Dunn and Y. Gogotsi, Nat. Commun., 2016, 7, 1–13 Search PubMed.
- A. Muzaffar, M. B. Ahamed, K. Deshmukh and J. Thirumalai, Renewable Sustainable Energy Rev., 2019, 101, 123–145 CrossRef CAS.
- C. Hu, Y. Lin, J. W. Connell, H. M. Cheng, Y. Gogotsi, M. M. Titirici and L. Dai, Adv. Mater., 2019, 31, 1–14 Search PubMed.
- N. M. Ndiaye, B. D. Ngom, N. F. Sylla, T. M. Masikhwa, M. J. Madito, D. Momodu, T. Ntsoane and N. Manyala, J. Colloid Interface Sci., 2018, 532, 395–406 CrossRef CAS PubMed.
- J. Iqbal, L. Li, A. Numan, S. Rafique, R. Jafer, S. Mohamad, M. Khalid, K. Ramesh and S. Ramesh, New J. Chem., 2019, 43, 13183–13195 RSC.
- T. Nguyen, M. Boudard, M. J. Carmezim and M. F. Montemor, Sci. Rep., 2017, 7, 1–10 CrossRef PubMed.
- A. A. Khaleed, D. Y. Momodu, M. Naguib, K. O. Oyedotun, T. M. Masikhwa, N. Manyala, M. Kebede and A. A. Mirghni, Electrochim. Acta, 2019, 301, 487–499 CrossRef.
- A. Noori, M. F. El-Kady, M. S. Rahmanifar, R. B. Kaner and M. F. Mousavi, Chem. Soc. Rev., 2019, 48, 1272–1341 RSC.
- G. Wang, L. Zhang and J. Zhang, Chem. Soc. Rev., 2012, 41, 797–828 RSC.
- Y. Wang, Y. Song and Y. Xia, Chem. Soc. Rev., 2016, 45, 5925–5950 RSC.
- Y. C. Choi, S. M. Lee and D. C. Chung, Adv. Mater., 2001, 13, 497–500 CrossRef.
- H. Shao, N. Padmanathan, D. McNulty, C. O'Dwyer and K. M. Razeeb, ACS Appl. Mater. Interfaces, 2016, 8, 28592–28598 CrossRef CAS PubMed.
- Z. Liang, R. Zhao, T. Qiu, R. Zou and Q. Xu, EnergyChem, 2019, 1, 1–32 CrossRef.
- X. Li, X. Yang, H. Xue, H. Pang and Q. Xu, EnergyChem, 2020, 2, 1–29 CrossRef PubMed.
- S. Zheng, Q. Li, H. Xue, H. Pang and Q. Xu, Natl. Sci. Rev., 2020, 7, 305–314 CrossRef.
- J. Zhao, H. Pang, J. Deng, Y. Ma, B. Yan, X. Li, S. Li, J. Chen and W. Wang, CrystEngComm, 2013, 15, 5950–5955 RSC.
- Z. Chen, D. B. Xiong, X. Zhang, H. Ma, M. Xia and Y. Zhao, Nanoscale, 2016, 8, 6636–6645 RSC.
- S. Wang, H. Pang, S. Zhao, W. Shao, N. Zhang, J. Zhang, J. Chen and S. Li, RSC Adv., 2014, 4, 340–347 RSC.
- Q. Li, Y. Li, H. Peng, X. Cui, M. Zhou, K. Feng and P. Xiao, J. Mater. Sci., 2016, 51, 9946–9957 CrossRef CAS.
- H. Jiang, T. Zhao, C. Li and J. Ma, J. Mater. Chem., 2011, 21, 3818–3823 RSC.
- B. A. Mahmoud, A. A. Mirghni, K. O. Oyedotun, D. Momodu, O. Fasakin and N. Manyala, J. Alloys Compd., 2020, 818, 1–13 CrossRef.
- G. Bergerhoff, M. Berndt and K. Brandenburg, J. Res. Natl. Inst. Stand. Technol., 2012, 101, 221 CrossRef PubMed.
- H. Xiang, K. Zhang, G. Ji, J. Y. Lee, C. Zou, X. Chen and J. Wu, Carbon, 2011, 49, 1787–1796 CrossRef CAS.
- T. Lu, Y. Zhang, H. Li, L. Pan, Y. Li and Z. Sun, Electrochim. Acta, 2010, 55, 4170–4173 CrossRef CAS.
- J. Ji, L. L. Zhang, H. Ji, Y. Li, X. Zhao, X. Bai, X. Fan, F. Zhang and R. S. Ruoff, ACS Nano, 2013, 7, 6237–6243 CrossRef CAS PubMed.
- V. Mazzaracchio, M. R. Tomei, I. Cacciotti, A. Chiodoni, C. Novara, M. Castellino, G. Scordo, A. Amine, D. Moscone and F. Arduini, Electrochim. Acta, 2019, 317, 673–683 CrossRef CAS.
- J. H. Lehman, M. Terrones, E. Mansfield, K. E. Hurst and V. Meunier, Carbon, 2011, 49, 2581–2602 CrossRef CAS.
- W. Paraguassu, P. T. C. Freire, V. Lemos, S. M. Lala, L. A. Montoro and J. M. Rosolen, J. Raman Spectrosc., 2005, 36, 213–220 CrossRef CAS.
- A. A. Mirghni, M. J. Madito, K. O. Oyedotun, T. M. Masikhwa, N. M. Ndiaye, S. J. Ray and N. Manyala, RSC Adv., 2018, 8, 11608–11621 RSC.
- M. Stomp, J. Huisman, L. J. Stal and H. C. P. Matthijs, ISME J., 2007, 1, 271–282 CrossRef CAS PubMed.
- A. A. Mirghni, M. J. Madito, T. M. Masikhwa, K. O. Oyedotun, A. Bello and N. Manyala, J. Colloid Interface Sci., 2017, 494, 325–337 CrossRef CAS PubMed.
- A. A. Mirghni, K. O. Oyedotun, O. Olaniyan, B. A. Mahmoud, N. F. Sylla and N. Manyala, RSC Adv., 2019, 9, 25012–25021 RSC.
- A. A. Mirghni, K. O. Oyedotun, O. Olaniyan, B. A. Mahmoud, N. F. Sylla and N. Manyala, RSC Adv., 2019, 9, 25012–25021 RSC.
- C. Zhang, T. Kuila, N. H. Kim, S. H. Lee and J. H. Lee, Carbon, 2015, 89, 328–339 CrossRef CAS.
- A. Bello, O. O. Fashedemi, J. N. Lekitima, M. Fabiane, D. Dodoo-Arhin, K. I. Ozoemena, Y. Gogotsi, A. T. Charlie Johnson and N. Manyala, AIP Adv., 2013, 3, 3–9 Search PubMed.
- S. Kasap, I. I. Kaya, S. Repp and E. Erdem, Nanoscale Adv., 2019, 1, 2586–2597 RSC.
- L. L. Zhang, R. Zhou and X. S. Zhao, J. Mater. Chem., 2010, 20, 5983–5992 RSC.
- D. Momodu, N. F. Sylla, B. Mutuma, A. Bello, T. Masikhwa, S. Lindberg, A. Matic and N. Manyala, J. Electroanal. Chem., 2019, 838, 119–128 CrossRef CAS.
- M. Wang, Y. Zhao, X. Zhang, R. Qi, S. Shi, Z. Li, Q. Wang and Y. Zhao, Electrochim. Acta, 2018, 272, 184–191 CrossRef CAS.
- X. Zhang, N. Shang, S. Gao, C. Wang, Y. Gao and Z. Wang, Appl. Surf. Sci., 2019, 483, 529–535 CrossRef CAS.
- M. Minakshi, D. Meyrick and D. Appadoo, Energy Fuels, 2013, 27, 3516–3522 CrossRef CAS.
- M. M. Sundaram, T. Watcharatharapong, S. Chakraborty, R. Ahuja, S. Duraisamy, P. T. Rao and N. Munichandraiah, Dalton Trans., 2015, 44, 20108–20120 RSC.
- M. Minakshi, D. R. G. Mitchell, R. T. Jones, N. C. Pramanik, A. Jean-Fulcrand and G. Garnweitner, ChemistrySelect, 2020, 5, 1597–1606 CrossRef CAS.
- M. Minakshi, S. Higley, C. Baur, D. R. G. Mitchell, R. T. Jones and M. Fichtner, RSC Adv., 2019, 9, 26981–26995 RSC.
- K. O. Oyedotun, T. M. Masikhwa, A. A. Mirghni, B. K. Mutuma and N. Manyala, Electrochim. Acta, 2020, 334, 1–12 CrossRef.
- J. Liu, L. Zhang, H. Bin Wu, J. Lin, Z. Shen and X. W. Lou, Energy Environ. Sci., 2014, 7, 3709–3719 RSC.
- P. C. Metz, A. C. Ladonis, P. Gao, T. Hey and S. T. Misture, RSC Adv., 2020, 10, 1484–1497 RSC.
- B. Fang, J. H. Kim, M. S. Kim, A. Bonakdarpour, A. Lam, D. P. Wilkinson and J. S. Yu, J. Mater. Chem., 2012, 22, 19031–19038 RSC.
- Y. Z. Wei, B. Fang, S. Iwasa and M. Kumagai, J. Power Sources, 2005, 141, 386–391 CrossRef CAS.
- J. Liu, J. Wang, C. Xu, H. Jiang, C. Li, L. Zhang, J. Lin and Z. X. Shen, Adv. Sci., 2018, 5, 17003221–17003229 Search PubMed.
- V. Augustyn and B. Dunn, Energy Environ. Sci., 2014, 7, 1597–1614 RSC.
| This journal is © The Royal Society of Chemistry 2020 |


