 Open Access Article
MOF-derived (MoS2, γ-Fe2O3)/graphene Z-scheme photocatalysts with excellent activity for oxygen evolution under visible light irradiation†
Ang Lia,
Yuxiang Liua,
Xuejun Xub,
Yuanyuan Zhanga,
Zhichun Si *a,
Xiaodong Wuc,
Rui Ranc and
Duan Wengac
aTsinghua Shenzhen International Graduate School, Tsinghua University, Shenzhen City, 518055, China. E-mail: si.zhichun@sz.tsinghua.edu.cn
bCollege of Materials Science and Energy Engineering, Foshan University, Foshan City, 528000, China
cThe Key Laboratory of Advanced Materials of Ministry of Education, School of Materials Science and Engineering, Tsinghua University, Beijing City, 10084, China
First published on 1st May 2020
Abstract
Constructing Z-scheme heterojunctions is considered as an effective strategy to obtain catalysts of high efficiency in electron–hole separation in photocatalysis. Unfortunately, suitable heterojunctions are difficult to fabricate because the direct interaction between two semiconductors may lead to unpredictable negative effects such as electron scattering or electron trapping due to the existence of defects which causes the formation of new substances. Furthermore, the van der Waals contact between two semiconductors also results in bad electron diffusion. In this work, a MOF-derived carbon material as a Z-scheme photocatalyst was synthesized via one-step thermal treatment of MoS2 dots @Fe-MOF (MIL-101). Under visible light irradiation, the well-constructed Z-scheme (MoS2, γ-Fe2O3)/graphene photocatalyst shows 2-fold photocatalytic oxygen evolution activity (4400 μmol g−1 h−1) compared to that of γ-Fe2O3/graphene (2053 μmol g−1 h−1). Based on ultraviolet photoelectron spectrometry (UPS), Mott–Schottky plot, photocurrent and photoluminescence spectroscopy (PL) results, the photo-induced electrons from the conduction band of γ-Fe2O3 could transport quickly to the valence band of MoS2 via highly conductive graphene as an electron transport channel, which could significantly enhance the electron–hole separation efficiency as well as photocatalytic performance.
1. Introduction
With the huge consumption of fossil energy resulting in serious environmental and social problems, the production and application of clean energies have become hot topics in the 21st century. Utilizing sunlight and water to generate a clean energy, hydrogen, via photocatalytic or photoelectrocatalytic water splitting is considered as an ideal strategy to solve these energy and environmental problems in the future.1–3 The water splitting reaction consists of water reduction (hydrogen evolution reaction, HER) and water oxidation (oxygen evolution reaction, OER).4 Since the oxygen evolution reaction is a four-hole reaction and the reaction rate is rather slow, it is always considered to be the rate-determining step of the overall photocatalytic water splitting reaction.5,6Among the catalysts for photocatalytic oxygen evolution, iron oxide is one of the most promising materials with advantages of earth abundant, nontoxic to the environment, and responsive to almost the whole visible region of the solar spectrum.7 However, the intrinsic deficiencies of Fe2O3, such as short diffusion lengths of photo-induced holes and low electroconductivity, restrain its practical applications.8–10 Doping by metal/non-metal elements (such as Al/Fe2O3,11,12 Ti/Fe2O3,13 S,N/Fe2O3 (ref. 14)), constructing composite catalysts (ZnO/Fe2O3,15 WO3/Fe2O3 (ref. 16)) and synthesizing iron oxide nanoparticles of specific morphology17–19 have been adopted to improve the catalytic performance of Fe2O3. Among these approaches, constructing Z-scheme heterojunctions is considered to be an efficient method due to enhanced charge separation efficiency of Fe2O3. Cong et al. prepared Fe2O3–MoS2–Cu2O nanocomposites by electrodeposition and hydrothermal methods. Thanks to the distinctive electron–hole pair separation via Z mechanism, the photoelectrochemical performance was improved. However, limited by poor electronic conduction between semiconductors, the photocatalytic performances of these Z scheme photocatalysts are not good enough and other strategies need to be developed for further improvement of photocatalytic performance.20
Various carbon-based materials have been designed and applied to photocatalysis and energy storage fields. The main advantages of carbon-based materials include high electrical conductivity, large specific surface area, good mechanical strength and portability. Embedding semiconductor photocatalyst into carbon materials, such as graphene or reduced graphene oxide (RGO), exhibited outstanding photocatalytic performance.21–23 Han et al. reported that the composite of Fe2O3 and graphene achieved significantly enhanced photocatalytic performance, and proved that the high conductivity of graphene helps the transfer and storage of photogenerated electrons from Fe2O3.24 Chen et al. fabricated a 3D quasi-hierarchical Z-scheme RGO-Fe2O3–MoS2 nanocomposite and obtained enhanced MB photocatalytic degradation performance.25 During the photocatalytic reaction, the RGO layers act as the current collector to enhance carriers transport, and form the heterojunctions with Fe2O3 and MoS2 to promote the separation of photogenerated carriers.
Recently, the carbon materials derived from metal–organic frameworks (MOFs) have been widely studied in battery materials and catalysis.26–29 Thanks to the high BET surface areas, the tunability of the metal–organic combination and diverse structures, MOFs have become promising sacrificial templates and precursors for the preparation of carbon-based nanomaterials.30 Compared with other carbon materials, MOF-derived carbon nanomaterials have great advantages in terms of large porosity and easy functionalization with metal/metal oxides, which make them highly efficient for numerous reactions. In this work, well-constructed MoS2/graphene/γ-Fe2O3 ternary heterojunctions were fabricated via one-step calcination of the MoS2 dots @Fe-MOF composite under inert atmosphere at elevated temperature. To our knowledge, this is the first report of a MOF-derived carbon material as the Z-scheme photocatalyst. Photocatalytic oxygen evolution for the MoS2/graphene/γ-Fe2O3 heterojunctions were tested and the mechanism for photocatalytic water oxidation reaction was proposed. According to this scheme, more Z-scheme photocatalysts could be constructed, and it would be helpful for the application of MOF-derived carbon materials in photocatalysis.
2. Experimental
2.1 Materials
All the chemicals used were AR purity without further purification. Thiourea (CH4N2S, 99%), hexaammonium molybdate tetrahydrate ((NH4)6Mo7O24·4H2O, 99%), iron chloride hexahydrate (FeCl3·6H2O, 99%), dimethylformamide (DMF, 99.5%), p-phthalic acid (PTA, 99%) and silver nitrate (AgNO3, 99.8%) were purchased from Aladdin Corp. Nafion D520 dispersion was purchased from Alfa Aesar.2.2 Synthesis of MoS2 dots
Bulk MoS2 sheets were synthesized according to the previous work.31 Firstly, 2 mmol (NH4)6Mo7O24·4H2O and 60 mmol CH4N2S were dissolved in 70 mL water. After continuous stirring for 30 min, the homogeneous solution was transferred into a 100 mL Teflon-lined stainless steel autoclave and heated for 18 h at 230 °C. After cooling down to the room temperature, the black precipitate was washed by water and ethanol for several times, and dried in vacuum for 12 h at 60 °C.MoS2 dots were obtained through an ultrasonic exfoliation method. 10 mg bulk MoS2 powder was dispersed in 200 mL ethanol in a beaker, and then ultrasonically grinded for 3 h (FS-450N, ShengXi Ultrasonic Instrument Co. Shanghai, China). Then the suspension was transferred to a 250 mL volumetric flask and calibrated to 250 mL with ethanol. Finally, the MoS2 dots ethanol solution with a concentration of 40 mg L−1 was obtained.
2.3 Synthesis of MIL-101(Fe)
MIL-101(Fe) was synthesized using the previously-reported method.32 Terephthalic acid (0.824 g, 4.96 mmol) and iron chloride hexahydrate (FeCl3·6H2O, 2.649 g, 9.8 mmol) were dissolved in dimethylformamide (DMF, 60 mL). The mixture was transferred to a 100 mL Teflon-lined stainless steel autoclave and heated at 110 °C for 20 h. After cooling to room temperature naturally, the generated precipitate was collected by centrifugation at 8000 rpm for 10 min, washed with ethanol more than 3 times and dried in vacuum at 60 °C for 12 h.2.4 Synthesis of MM (MoS2/MIL-101(Fe))
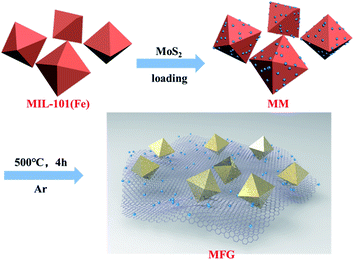
MoS2/MIL-101(Fe) was synthesized via an impregnation method. To be specific, 0.5 g MIL-101(Fe) was dissolved in the solution of MoS2 dots (concentration of MoS2 is 40 mg L−1). After stirring for 24 h, the solution was dried at 85 °C in air to remove ethanol and then dried in vacuum at 60 °C for 12 h to obtain MoS2/MIL-101(Fe) catalyst (MM).2.5 Synthesis of FG (γ-Fe2O3/graphene) and MFG ((MoS2, γ-Fe2O3)/graphene)
The precursor, MIL-101(Fe) and MoS2/MIL-101(Fe), were heated to 500 °C with the heating rate of 5 °C min−1 in Ar. After calcination treatment for 4 hours, the carbonized samples were collected and labeled as FG and MFG catalysts.2.6 Characterizations
Crystalline and phase structures of catalysts were characterized by a Bruker D8 Advance X-ray diffractometer (XRD) using Cu Kα (λ = 1.5406 Å) radiation. The microstructure and morphology were observed using field emission scanning electron microscopy (FESEM, HITACHI SU8010) and transmission electron microscopy (TEM, FEI TECNAI G2 F30). The molybdenum sulfide dots were characterized by atomic force microscope (AFM, MDTC-EQ-M16-01). Raman spectra were measured by a Raman microscope (HORIBA LabRAM HR800) at 532 nm excitation wavelength. The X-ray photoelectron spectra (XPS) data was recorded on PHI-5000 Versaprobe II instrument using a monochromatic Al Kα source to analyze the composition and chemical state. The accurate atom ratios were measured by coupled plasma emission spectrometry (ICP-OES, PE7300dv). The photoluminescence (PL) spectra were collected on a fluorescence spectrophotometer (Edinburgh Instruments FLS 980) with the excitation wavelength of 325 nm. The ultraviolet photoelectron spectrometer (UPS) tests were carried on the X-ray photoelectron spectra (Thermo Fisher, ESCALAB 250i) and the Mott–Schottky (MS) tests were carried on the electrochemical workstation (Chenhua Shanghai, CHI660E).2.7 Photocatalytic activity measurements
The photocatalytic oxygen evolution reaction activities of catalysts were carried out on a testing apparatus from Ceaulight Company (CEL-SPH2N-D9). The produced oxygen was measured by a gas chromatography (Ceaulight, GC-7920) and high purity argon was used as carrier gas. Briefly, 10![[thin space (1/6-em)]](https://www.rsc.org/images/entities/char_2009.gif) mg of photocatalyst powder was dispersed into 100 mL ultra-pure water containing sacrificial reagent (0.01 M AgNO3) and vacuumized more than 30
mg of photocatalyst powder was dispersed into 100 mL ultra-pure water containing sacrificial reagent (0.01 M AgNO3) and vacuumized more than 30![[thin space (1/6-em)]](https://www.rsc.org/images/entities/char_2009.gif) minutes to remove oxygen in the solution. A 300 W Xe lamp (Ceaulight, CEL-HXF300) with a 400 nm cut-off filter was applied as visible light source and the incident light intensity was 100 mW cm−2 on average.
minutes to remove oxygen in the solution. A 300 W Xe lamp (Ceaulight, CEL-HXF300) with a 400 nm cut-off filter was applied as visible light source and the incident light intensity was 100 mW cm−2 on average.
2.8 Photoelectrochemical measurements
Photocatalyst for photoelectrochemical characterization is pre-treated and the experiments were carried out in a three-electrode system. Briefly, 10 mg photocatalyst was dispersed in 400 μL isopropanol containing 20 μL of Nafion solution under ultrasonication for half an hour. Then, pipetted 20 μL of the mixed solution with a pipette and spin-coated it on the conductive side of ITO glass with size of 1 cm × 1 cm. Finally, samples were dried in vacuum at 60 °C for 6 hours and working electrode was prepared. Platinum plate was used as the counter electrode and Ag/AgCl (3.5 M KCl) electrode as reference electrode. 100 mL of 0.1 M Na2SO4 aqueous solution was used for electrolyte. The transient photocurrent measurements were carried out with a bias voltage of 0.2 V vs. Ag/AgCl and 20 s on/off period. The MS plots were measured under frequency of 1000 Hz in the dark environment.3. Results and discussion
3.1 Structural and morphological analyses
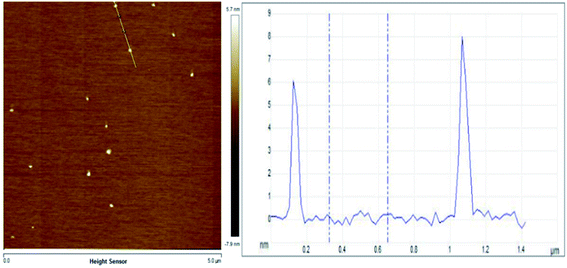
Evenly dispersed MoS2 was prepared by ultrasonically crushing bulk MoS2 sheets into nanodots. The atomic force microscope (AFM) is used to characterize the size of MoS2 dots. The thickness of the molybdenum sulfide dots obtained by the ultrasonic vibration grinding treatment was 5–20 nm (Fig. 1).SEM images of MIL-101(Fe), MM, FG and MFG were recorded to explore the microstructure and morphology of the materials. The morphology of MIL-101(Fe) is an octahedral structure in size of 0.5–3 μm (Fig. 2(a)). The MM maintains the octahedron morphology of MIL-101(Fe) with rough surface as result of the loading of MoS2 dots (Fig. 2(b)). As shown in Fig. 2(c), MIL-101(Fe) transformed to octahedral γ-Fe2O3 in size of 100–500 nm and graphene substrate after calcination, which is consistent with previous results.33 At the initial stage of calcination, the iron oxide clusters crystallized on the octahedral surface during the gradual decomposition of MIL-101(Fe). The contraction force derived from the iron oxide crystallite leads to the inward contraction of the surface Fe2O3 layer. Due to the smaller size, carbon atoms diffuse out in form of the interstitial solute atoms and form graphene under the catalysis of iron. Eventually, a structure in which octahedral iron oxide supported on graphene is formed. When rising the temperature of MM heating treatment, highly dispersedγ-Fe2O3 octahedrons around 100–500 nm and MoS2 dots (5–10 nm) located on graphene substrate could be obtained (Fig. 2(d)).
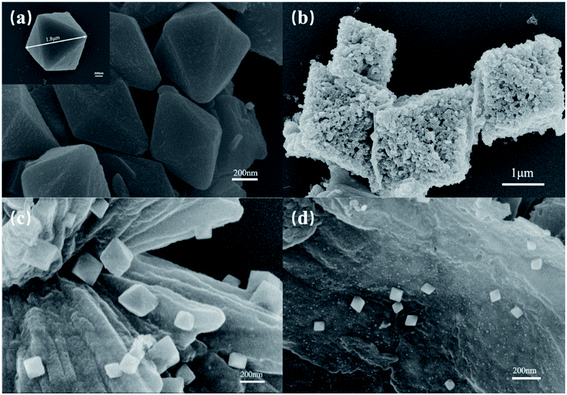 | ||
| Fig. 2 SEM images of (a) MIL-101(Fe), (b) MoS2/MIL-101(Fe), (c) γ-Fe2O3/graphene and (d) (MoS2, γ-Fe2O3)/graphene. | ||
The phase purity and crystal structure of the MFG were examined by X-ray diffraction (XRD). The XRD patterns in Fig. 3(a) and S1† show that the main phase of iron oxide in MFG and FG is γ-Fe2O3. The peaks at 30.2°, 35.6°, 37.2°, 43.3°, 53.7°,57.3°, 62.9°, 71.4° and 74.5° are obvious which are indexed to (220), (311), (222), (400), (511), (422), (440), (620) and (533) lattice planes of γ-Fe2O3 (JCPDS card 39–1346), respectively.34 Peak at 26.5° is owing to (002) lattice planes of graphene. Another one at 39.6° is related to the (103) lattice planes of MoS2, which could not be found in XRD pattern of FG (Fig. S1†), revealing the existence of MoS2 in MFG.35,36 The formation of graphene is further determined by Raman, which is shown in Fig. 3(b). Three peaks can be obtained from the figure, D peak (1329 cm−1), G peak (1585 cm−1) and 2D peak (2837 cm−1), respectively. The integral intensity ratio of D band to G band (ID/IG) is 0.676, confirming that the MFG has a considerable degree of graphitization. The content of Mo was 1.4% and Fe was 44% by ICP-OES shown in Table S1.† The peaks of MoS2 cannot be distinguished in Raman spectrum due to its low content.
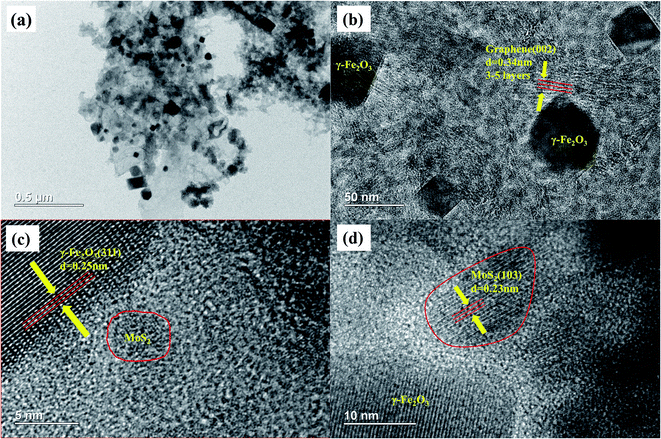
The microstructure of the MFG was characterized by TEM, and the results are shown in Fig. 4. The dark octahedral structures shown in Fig. 4(a) and (b) are γ-Fe2O3 particles and the particle size is 50–500 nm. The distinct distance of plane about 0.34 nm attributed to the interplanar spacing of (002) plane of graphene is observed in Fig. 4(b), revealing that the graphene of 3–5 layers formed via the decomposition of MOF-101. It can be seen from Fig. 4(c) that the large dark region has an interplanar crystal spacing of 0.25 nm, which corresponds to the (311) plane of γ-Fe2O3. Fig. 4(d) shows that the interplanar crystal spacing of 0.23 nm corresponds to the (103) plane of MoS2.36 The above results confirm that MoS2/graphene/Fe2O3 heterojunctions are well constructed via the in situ thermal treatment of MoS2/Fe-MOF composites, which is shown in Scheme 1.
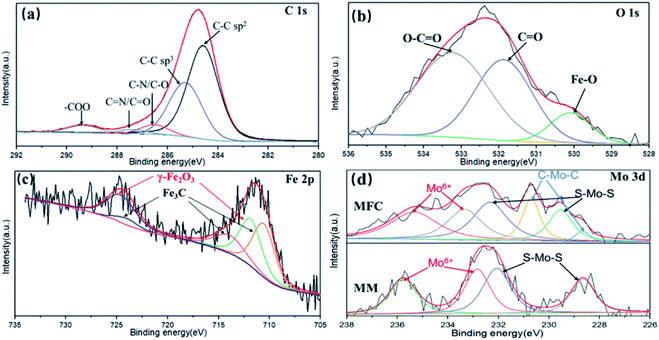
XPS was used to investigate the surface chemical states of samples and the results are shown in Fig. 5. As shown in Fig. 5(a), the C 1s spectrum can be deconvoluted into several peaks, including the sp2 C–C bond of the graphene skeleton (C![[double bond, length as m-dash]](https://www.rsc.org/images/entities/char_e001.gif) C, 284.2 eV), sp3 hybrid carbon (C–C/C–H, 285.2 eV), alcohol, epoxy and ether groups (C–O, 286.3 eV), carbonyl (C
C, 284.2 eV), sp3 hybrid carbon (C–C/C–H, 285.2 eV), alcohol, epoxy and ether groups (C–O, 286.3 eV), carbonyl (C![[double bond, length as m-dash]](https://www.rsc.org/images/entities/char_e001.gif) O, 287.5 eV) and carboxylic acid/ester groups (–O–C
O, 287.5 eV) and carboxylic acid/ester groups (–O–C![[double bond, length as m-dash]](https://www.rsc.org/images/entities/char_e001.gif) O, 289.3 eV), respectively.37–39 As shown in Fig. 5(b), the O 1s spectrum can be deconvoluted into three peaks at 530.1, 531.8 and 533.3 eV, which are attributed to Fe–O, C
O, 289.3 eV), respectively.37–39 As shown in Fig. 5(b), the O 1s spectrum can be deconvoluted into three peaks at 530.1, 531.8 and 533.3 eV, which are attributed to Fe–O, C![[double bond, length as m-dash]](https://www.rsc.org/images/entities/char_e001.gif) O and O–C
O and O–C![[double bond, length as m-dash]](https://www.rsc.org/images/entities/char_e001.gif) O, respectively. As shown in Fig. 5(c), the XPS peaks of Fe 2p1/2 (724.6 eV) and Fe 2p3/2 (711.3 eV) are assigned to the Fe2O3 and the peaks of Fe 2p1/2 (724.0 eV), satellite Fe 2p3/2 (713.4 eV) and Fe 2p3/2 (710.9 eV) are assigned to the Fe3C phase in MFG.40 As shown in Fig. 5(d), Mo shows two valence states in MM (MoS2/MOF). In details, the XPS peaks of Mo 3d3/2 (228.7 eV) and Mo 3d5/2 (232.3 eV) correspond to Mo4+ in MoS2, Mo 3d3/2 (232.8 eV) and Mo 3d5/2 (235.8 eV) correspond to Mo6+ in MoO3.41 The appearance of Mo6+ is mainly attributed to the surface oxidation of MoS2 during ultrasonication. The MFG obtained by carbonization of MM has two more XPS peaks at 228.2 and 231.1 eV, which are attributed to the Mo–C bond formed during the carbonization of MM.42 The XPS results shows the co-existence of Fe–C and Mo–C, which indicates the strong interaction between MoS2/graphene and Fe2O3/graphene interfaces in MFG.
O, respectively. As shown in Fig. 5(c), the XPS peaks of Fe 2p1/2 (724.6 eV) and Fe 2p3/2 (711.3 eV) are assigned to the Fe2O3 and the peaks of Fe 2p1/2 (724.0 eV), satellite Fe 2p3/2 (713.4 eV) and Fe 2p3/2 (710.9 eV) are assigned to the Fe3C phase in MFG.40 As shown in Fig. 5(d), Mo shows two valence states in MM (MoS2/MOF). In details, the XPS peaks of Mo 3d3/2 (228.7 eV) and Mo 3d5/2 (232.3 eV) correspond to Mo4+ in MoS2, Mo 3d3/2 (232.8 eV) and Mo 3d5/2 (235.8 eV) correspond to Mo6+ in MoO3.41 The appearance of Mo6+ is mainly attributed to the surface oxidation of MoS2 during ultrasonication. The MFG obtained by carbonization of MM has two more XPS peaks at 228.2 and 231.1 eV, which are attributed to the Mo–C bond formed during the carbonization of MM.42 The XPS results shows the co-existence of Fe–C and Mo–C, which indicates the strong interaction between MoS2/graphene and Fe2O3/graphene interfaces in MFG.
3.2 Photocatalytic performance and discussion
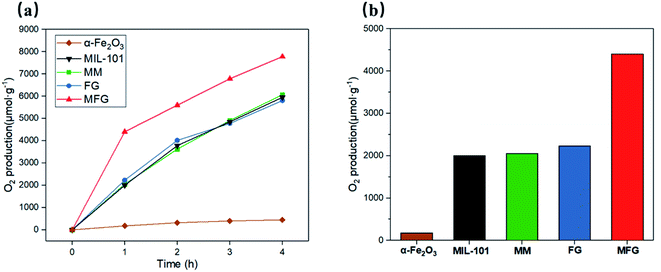
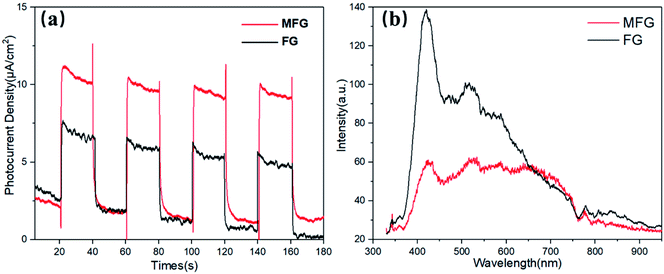
The photocatalytic performance of the as-prepared α-Fe2O3, MIL-101, MM, FG and MFG was evaluated by oxygen evolution in 0.01 M AgNO3 aqueous solution under visible light irradiation (Fig. 6(a) and (b)). A rate of 2053 μmol g−1 h−1 was detected with the catalyst MM for the first hour and an average oxygen evolution of 1637 μmol g−1 h−1 was recorded after three hours of irradiation. The FG obtained by carbonization of Fe-MOF showed comparable photocatalytic oxygen evolution activity to that of MM and pristine MIL-101. With the catalyst α-Fe2O3, which was obtained by heat treating MIL-101 in air at 500 °C for 4 hours, a rate of 180 μmol g−1 h−1 was detected in the first hour, and an average oxygen evolution of 130 μmol g−1 h−1 was recorded after three hours of irradiation. For MFG, the photocatalytic oxygen evolution activity of 4400 μmol g−1 h−1 was detected in the first hour, which was more than twice compared to that of MM and FG. After three hours of irradiation, the average photocatalytic oxygen evolution of 2262 μmol g−1 h−1 was recorded, which was 1.4 times as that of MM and FG.To further explore the mechanism for the enhancement in the photocatalytic activity of MFG, energy band structure alignment and the charge-transfer and separation efficiency studies were carried out. Fig. 7(a) shows the photocurrents of the FG and MFG electrodes under visible light irradiation with the on/off period of the light irradiation 20 s. The photocurrent density of MFG is about 1.6 times as that of FG. The higher photocurrent density of MFG suggests that the photogenerated electron–hole pairs in MFG have higher separation efficiency and longer lifetime, which is beneficial to improve the photocatalytic activity. As shown in Fig. 7(b), the PL emission spectra is also consistent with the result of photocurrent density. The intensity of emission peak of MFG is much lower than that of FG, indicating that the photogenerated electron–hole pairs recombination is suppressed and the charge separation is improved.43
The UV-visible diffuse reflectance spectrums of the catalysts were shown in ESI (Fig. S2†). Since most of the composition of MFG and FG is carbon, which enhanced the absorption of light, the band gap cannot be studied by UV-visible diffuse reflectance spectrum. So, we chose the method of Mott–Schottky tests and UPS to study the energy band of the catalysts.
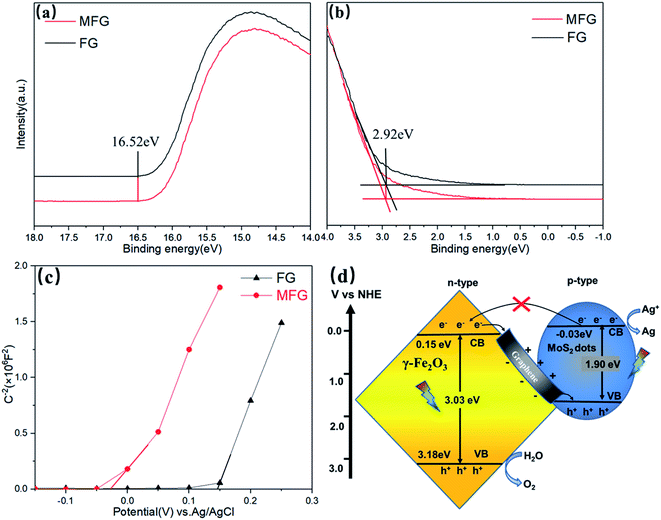
The valence band edge (EVB) of the semiconductor can be estimated by UPS.44–46 The preparation process of samples for tests is listed in ESI.† As shown in Fig. 8(a), the high binding energy (BE) cutoff region (secondary electron cutoff edge, SEE) of MFG is 16.52 (±0.03) eV, which is consistent with FG. Fig. 8(b) shows the corresponding low binding energy portion of the UPS spectrum close to the Fermi level, with a tangent to get Eonset = 2.92 (±0.03) eV. The ionization potential of the FG and MFG samples under vacuum conditions is 7.62 (±0.06) eV calculated from the formula φ = hv − (Ecutoff − Eonset) with the excitation energy of the He I UPS spectrum 21.22 eV. The value of EVB can be converted to an electrochemical potential according to a reference standard, where 0 V vs. RHE (reversible hydrogen electrode) is equal to 4.44 eV vs. evac (vacuum level), thereby the obtained EVBs of the FG and MFG are 3.18 (±0.06) V vs. RHE. The potential of the conduction band edge (ECB) of the semiconductor was estimated by the Mott–Schottky (MS) tests.47 The MS plots of FG and MFG were measured at a frequency of 1000 Hz in the dark. As shown in Fig. 8(c), the positive slope of the linear MS curve reveals that FG and MFG are n-type semiconductors. The ECB can be determined by the intercept on the x-axis in the MS plots. Compared with the Ag/AgCl electrode, the derived ECB potential of FG in the aqueous solution is 0.15 V, while the MS curve of the MFG shifts to the negative direction of the coordinate axis. The derived ECB potential of MFG in the aqueous solution is −0.03 V, which confirms that the bottom of the conduction band is extended to a more negative potential compared with that of FG.
Fig. 8(d) is a schematic diagram showing the band alignment of MFG and the possible mechanism of photocatalytic oxygen evolution on MFG catalysts.43,48–50 Based on the above results, the ECB potential of Fe2O3 is 0.15 eV and EVB potential of Fe2O3 is 3.18 eV, while the ECB potential of MoS2 is −0.03 eV and the band gap of MoS2 is 1.9 eV,43 respectively. The band alignment of MFG is matched with Z-scheme. When light is irradiated onto the MFG, the photo-induced electron–hole pairs are generated in octahedral iron oxide and molybdenum sulfide. Due to the strong bonding with graphene substrate via Mo–C and Fe–C bond, the electrons in well crystalized iron oxide conduction band can quickly transfer to the valence band of molybdenum sulfide through highly conductive graphene, and combine with the generated photogenerated holes. Thus, lifetime of photogenerated holes in iron oxide is significantly increased. At the same time, the electrons in the molybdenum sulfide conduction band reduce the silver ions to the nano silver particles, and the holes in the iron oxide oxidize the water to oxygen. In addition, it was reported that carbon doping could create empty 2p orbitals perpendicular to the basal plane, enabling energetically favorable water adsorption and dissociation, which indicates the formation of Fe–C and Mo–C bond could be beneficial to the catalytic reaction.42
4. Conclusion
In this work, (MoS2, γ-Fe2O3)/graphene catalyst of well-constructed MoS2/graphene/Fe2O3 heterojunctions was synthesized via one-step calcination of MoS2@Fe-MOF composite. The (MoS2, γ-Fe2O3)/graphene catalyst produce 4400 μmol g−1 h−1 of oxygen under visible light irradiation, which is more than twice compared to that of γ-Fe2O3/graphene. The Z scheme band-alignment between MoS2 and γ-Fe2O3 and the high conductivity of graphene as a transfer channel of photogenerated electrons result in enhanced efficiency of charge separation and remarkable performance of catalyst in water oxidation reaction. This work provides a novel method to design a highly efficient catalyst via constructing effective heterojunctions for photocatalytic water oxidation and other photocatalysis reactions.Conflicts of interest
There are no conflicts to declare.References
- D. Gust, T. A. Moore and A. L. Moore, Acc. Chem. Res., 2009, 42, 1890–1898 CrossRef CAS PubMed.
- A. J. Bard and M. A. Fox, Acc. Chem. Res., 1995, 28, 141–145 CrossRef CAS.
- H. Tong, S. Ouyang, Y. Bi, N. Umezawa, M. Oshikiri and J. Ye, Adv. Mater., 2012, 24, 229–251 CrossRef CAS PubMed.
- X. B. Chen, S. H. Shen, L. J. Guo and S. S. Mao, Chem. Rev., 2010, 110, 6503–6570 CrossRef CAS PubMed.
- S. R. Pendlebury, M. Barroso, A. J. Cowan, K. Sivula, J. Tang, M. Graetzel, D. Klug and J. R. Durrant, Chem. Commun., 2011, 47, 716–718 RSC.
- J. Tang, J. R. Durrant and D. R. Klug, J. Am. Chem. Soc., 2008, 130, 13885–13891 CrossRef CAS PubMed.
- M. Mishra and D.-M. Chun, Appl. Catal., A, 2015, 498, 126–141 CrossRef CAS.
- G. Wang, Y. Ling, D. A. Wheeler, K. E. N. George, K. Horsley, C. Heske, J. Z. Zhang and Y. Li, Nano Lett., 2011, 11, 3503–3509 CrossRef CAS PubMed.
- C. J. Sartoretti, M. Ulmann, B. D. Alexander, J. Augustynski and A. Weidenkaff, Chem. Phys. Lett., 2003, 376, 194–200 CrossRef.
- L. Li, Y. Yu, F. Meng, Y. Tan, R. J. Hamers and S. Jin, Nano Lett., 2012, 12, 724–731 CrossRef CAS PubMed.
- F. B. Li, X. Z. Li, C. S. Liu and T. X. Liu, J. Hazard. Mater., 2007, 149, 199–207 CrossRef CAS PubMed.
- Z. Zhang, M. F. Hossain, T. Miyazaki and T. Takahashi, Environ. Sci. Technol., 2010, 44, 4741–4746 CrossRef CAS PubMed.
- M. Rioult, H. Magnan, D. Stanescu and A. Barbier, J. Phys. Chem. C, 2014, 118, 3007–3014 CrossRef CAS.
- G. K. Pradhan, N. Sahu and K. M. Parida, RSC Adv., 2013, 3, 7912–7920 RSC.
- G. K. Pradhan, S. Martha and K. M. Parida, ACS Appl. Mater. Interfaces, 2012, 4, 707–713 CrossRef CAS.
- D. Bi and Y. Xu, J. Mol. Catal. A: Chem., 2013, 367, 103–107 CrossRef CAS.
- J. Zhu, Z. Yin, D. Yang, T. Sun, H. Yu, H. E. Hoster, H. H. Hng, H. Zhang and Q. Yan, Energy Environ. Sci., 2013, 6, 987–993 RSC.
- L. Li, Y. Chu, Y. Liu and L. Dong, J. Phys. Chem. C, 2007, 111, 2123–2127 CrossRef CAS.
- T. K. Townsend, E. M. Sabio, N. D. Browning and F. E. Osterloh, Energy Environ. Sci., 2011, 4, 4270–4275 RSC.
- Y. Q. Cong, Y. H. Ge, T. T. Zhang, Q. Wang, M. L. Shao and Y. Zhang, Ind. Eng. Chem. Res., 2018, 57, 881–890 CrossRef CAS.
- Q. Xiang, J. Yu and M. Jaroniec, J. Phys. Chem. C, 2011, 115, 7355–7363 CrossRef CAS.
- Q. Li, B. Guo, J. Yu, J. Ran, B. Zhang, H. Yan and J. R. Gong, J. Am. Chem. Soc., 2011, 133, 10878–10884 CrossRef CAS PubMed.
- Y. H. Ng, A. Iwase, A. Kudo and R. Amal, J. Phys. Chem. Lett., 2010, 1, 2607–2612 CrossRef CAS.
- S. C. Han, L. F. Hu, Z. Q. Liang, S. Wageh, A. A. Al-Ghamdi, Y. S. Chen and X. S. Fang, Adv. Funct. Mater., 2014, 24, 5719–5727 CrossRef CAS.
- L. X. Chen, F. He, N. Q. Zhao and R. S. Guo, Appl. Surf. Sci., 2017, 420, 669–680 CrossRef CAS.
- K. Shen, X. D. Chen, J. Y. Chen and Y. W. Li, ACS Catal., 2016, 6, 5887–5903 CrossRef CAS.
- J. Yao, J. Y. Chen, K. Shen and Y. W. Li, J. Mater. Chem. A, 2018, 6, 3571–3582 RSC.
- Q. Li, P. Xu, W. Gao, S. G. Ma, G. Q. Zhang, R. G. Cao, J. Cho, H.-L. Wang and G. Wu, Adv. Mater., 2014, 26, 1378–1386 CrossRef CAS PubMed.
- F. Xie, G.-P. Lu, R. Xie, Q.-H. Chen, H.-F. Jiang and M. Zhang, ACS Catal., 2019, 9, 2718–2724 CrossRef CAS.
- W. Chaikittisilp, K. Ariga and Y. Yamauchi, J. Mater. Chem. A, 2013, 1, 14–19 RSC.
- J. Xie, H. Zhang, S. Li, R. Wang, X. Sun, M. Zhou, J. Zhou, X. W. Lou and Y. Xie, Adv. Mater., 2013, 25, 5807–5813 CrossRef CAS PubMed.
- Y. Horiuchi, T. Toyao, K. Miyahara, L. Zakary, V. Dang Do, Y. Kamata, T.-H. Kim, S. W. Lee and M. Matsuoka, Chem. Commun., 2016, 52, 5190–5193 RSC.
- J. Shao, Z. Wan, H. Liu, H. Zheng, T. Gao, M. Shen, Q. Qu and H. Zheng, J. Mater. Chem. A, 2014, 2, 12194–12200 RSC.
- W. Wu, X. H. Xiao, S. F. Zhang, T. C. Peng, J. Zhou, F. Ren and C. Z. Jiang, Nanoscale Res. Lett., 2010, 5, 1474–1479 CrossRef CAS PubMed.
- R. Li, L. Yang, T. Xiong, Y. Wu, L. Cao, D. Yuan and W. Zhou, J. Power Sources, 2017, 356, 133–139 CrossRef CAS.
- Y.-Y. Li, J.-H. Wang, Z.-J. Luo, K. Chen, Z.-Q. Cheng, L. Ma, S.-J. Ding, L. Zhou and Q.-Q. Wang, Sci. Rep., 2017, 7, 7178 CrossRef PubMed.
- L. Zhang, X. Wang, R. Wang and M. Hong, Chem. Mater., 2015, 27, 7610–7618 CrossRef CAS.
- M. Lotya, Y. Hernandez, P. J. King, R. J. Smith, V. Nicolosi, L. S. Karlsson, F. M. Blighe, S. De, Z. Wang, I. T. McGovern, G. S. Duesberg and J. N. Coleman, J. Am. Chem. Soc., 2009, 131, 3611–3620 CrossRef CAS.
- H. A. Becerril, J. Mao, Z. Liu, R. M. Stoltenberg, Z. Bao and Y. Chen, ACS Nano, 2008, 2, 463–470 CrossRef CAS.
- W. Kou, G. Chen, Y. Liu, W. Guan, X. Li, N. Zhang and G. He, J. Mater. Chem. A, 2019, 7, 20614–20623 RSC.
- X. Xue, J. Zhang, I. A. Saana, J. Sun, Q. Xu and S. Mu, Nanoscale, 2018, 10, 16531–16538 RSC.
- Y. Zang, S. Niu, Y. Wu, X. Zheng, J. Cai, J. Yee, Y. Xie, Y. Liu, J. Zhou, J. Zhu, X. Liu, G. Wang and Y. Qian, Nat. Commun., 2019, 10, 1217 CrossRef PubMed.
- J. Wan, X. Du, E. Liu, Y. Hu, J. Fan and X. Hu, J. Catal., 2017, 345, 281–294 CrossRef CAS.
- J. Liu, Y. Liu, N. Liu, Y. Han, X. Zhang, H. Huang, Y. Lifshitz, S.-T. Lee, J. Zhong and Z. Kang, Science, 2015, 347, 970–974 CrossRef CAS.
- W. Chen, Y. Zhou, L. Wang, Y. Wu, B. Tu, B. Yu, F. Liu, H.-W. Tam, G. Wang, A. B. Djurisic, L. Huang and Z. He, Adv. Mater., 2018, 30, 1800515 CrossRef.
- Y. Karpov, T. Erdmann, I. Raguzin, M. Al-Hussein, M. Binner, U. Lappan, M. Stamm, K. L. Gerasimov, T. Beryozkina, V. Bakulev, D. V. Anokhin, D. A. Ivanov, F. Gunther, S. Gemming, G. Seifert, B. Voit, R. Di Pietro and A. Kiriy, Adv. Mater., 2016, 28, 6003–6010 CrossRef CAS.
- J. Wang, P. Guo, M. Dou, J. Wang, Y. Cheng, P. G. Jonsson and Z. Zhao, RSC Adv., 2014, 4, 51008–51015 RSC.
- Z.-F. Huang, L. Pan, J.-J. Zou, X. Zhang and L. Wang, Nanoscale, 2014, 6, 14044–14063 RSC.
- Z. Jiang, W. Wan, H. Li, S. Yuan, H. Zhao and P. K. Wong, Adv. Mater., 2018, 30, 1706108 CrossRef PubMed.
- L. J. Zhang, S. Li, B. K. Liu, D. J. Wang and T. F. Xie, ACS Catal., 2014, 4, 3724–3729 CrossRef CAS.
Footnote |
| † Electronic supplementary information (ESI) available. See DOI: 10.1039/d0ra02083d |
| This journal is © The Royal Society of Chemistry 2020 |

