 Open Access Article
Surface modification of a PES membrane by corona air plasma-assisted grafting of HB-PEG for separation of oil-in-water emulsions†
Hooman Adib and
Ahmadreza Raisi *
*
Department of Chemical Engineering, Amirkabir University of Technology (Tehran Polytechnic), Hafez Ave., P.O. Box 15875-4413, Tehran, Iran. E-mail: raisia@aut.ac.ir; Fax: +9821 66405847; Tel: +9821 64543125
First published on 1st May 2020
Abstract
The main goal of this study is to modify a polyethersulfone (PES) membrane by grafting with hyperbranched polyethylene glycol (HB-PEG) using corona air plasma to intensify the anti-fouling properties of the prepared membrane. The separation efficiency and fouling tendency of the modified membranes were evaluated for the treatment of a synthetic oily wastewater. A mechanism was proposed for the HB-PEG grafting on the surface of the corona treated PES membranes and all steps of the grafting were described in detail. The effects of corona treatment operating conditions on the morphology, surface properties, separation performance and anti-fouling efficiency of the modified PES membranes were investigated. Also, the HB-PEG grafted PES membranes were characterized by FTIR, AFM and contact angle analysis. Finally, the HB-PEG grafting on the surface of the PES membranes altered the surface hydrophilicity and led to the improvement of the anti-fouling property and oil–water permeation flux of all modified membranes without any remarkable changes in oil rejection.
Introduction
Microfiltration (MF) and ultrafiltration (UF) are extensively utilized membrane separation processes based on the use of a perm-selective porous membrane.1 The MF process is commonly employed to separate macromolecules, suspended particles and micro-organisms, while the UF process is applied to separate biomolecules, polymers, colloidal particles, emulsions and micelles.2 Due to several advantages, including low energy requirements, high selectivity, ease of separation, easy scale-up, mild operation conditions, absence of phase transition, no use of additional solvents, continuous and automatic operation and relatively low capital and running costs3,4 the MF and UF processes have been widely used for the treatment of polluted water in different industries such as chemical, paper, textile, dye, oil and gas, petrochemical and food. However, the concentration polarization and fouling phenomena are major issues during the operation of these membrane processes. Fouling is the build-up of undesired deposits and accumulation of hydrophobic solutes, nonpolar species or microorganisms either within the membrane's pores or on the membrane's surface.5,6 The membrane fouling consistently results in a significant decline in the permeation flux and rejection of the membrane during the operation period and subsequently leads to increased maintenance costs and higher energy demand.7,8 Moreover, the membrane fouling can impede the utilization of the membrane technologies.9–11 Various techniques like manipulating operating parameters, backwashing, physical cleaning and membrane modification have been applied to reduce and control membrane fouling.12 Many studies have investigated the membrane fouling phenomenon and concluded that the fouling is directly attributed to the surface chemistry and hydrophobicity of the membrane.13,14 Therefore, the hydrophilization of the hydrophobic polymer membranes like polyethersulfone (PES) polysulfone (PSf) and polyvinylidene difluoride (PVDF) reduces the tendency of the membrane towards fouling.15–17 Plasma treatment,18–21 surface grafting22–24 and blending1,25,26 are among a variety of surface modification methods proposed for introducing hydrophilicity onto the membrane surface in order to promote the anti-fouling property during the MF and UF processes. Hydrophilic agents such as polymers and inorganic fillers are combined as a simple method for modifying PES membranes during membrane preparation, although the results are not always satisfactory.27–30 During surface grafting, the modifier agent is covalently grafted onto a surface activated by plasma, ultraviolet (UV) or heat treatment. The reputation of surface grafting as an efficient modification method is due to the fact that its effects are stable and hydrophilic agents are not lost during filtration operation.31,32 To enhance the hydrophilicity and anti-fouling characteristics of PES membranes, researchers have employed a wide range of modifier agents such as polyethylene glycol,33,34 maleic anhydride35 and hydrophilic monomers.36,37 The plasma modification of the membranes has been the focus of various studies, as this method is capable of alerting the hydrophilicity of the membrane surface. For example, Sadeghi et al.20 employed the corona air plasma to modify the surface of the PES UF membranes to minimize the membrane fouling and investigated the effect of corona treatment time and power on the separation performance of the modified membranes. Wavhal et al.38 studied the influence of CO2 plasma treatment on the PSf UF membrane and reached a membrane with a hydrophilic surface and reversible fouling for protein solution. Saxena et al.39 reported the Ar–O2 plasma treatment of the PES UF membranes increased the surface hydrophilicity and permeation flux of the membranes. Steen et al.40,41 used the H2O plasma for modification of the PSf, PES, and polyethylene (PE) membranes all showing improvement in the surface wettability; however, the treatment depends deeply on the polymer material. Tyszler et al.42 applied the corona treatment for modification of the PES UF membrane to reduce the fouling tendencies of the membranes in the wastewater treatment by the membrane biological reactors. The low-temperature plasma treatment has also been used as a pretreatment in the graft polymerization process for the surface modification of the membranes. Guo et al.43 employed the corona discharge as a pre-treatment before the graft polymerization of acrylic acid on the surface of the high-density polyethylene membrane (HDPE) microfiltration membrane to increase the membrane hydrophilicity. Zhu et al.44 used the corona-induced graft polymerization for coating an acrylic acid layer onto the PES membranes to reduce the fouling tendency for the protein solution.Grafted polymers might block surface pores once the hydrophilic agent is grafted onto the membrane surface. The phenomenon might cause a decline in the permeation flux, especially in the case of linear grafted monomers. However, surface pores are less likely to be blocked and surface grafting yield can be easily modified on the membrane surface if the modifier agents have a branched structure.31,45 Since the structure of hyperbranched polymers (HBPs) is highly branched and such polymers are much more convenient to prepare, they have become an increasingly valuable class of substances.46,47 HBPs with multifunctional end groups in each molecule, lower packing density, and smaller rheological volumes in solution are an appealing alternative to modifier agents in the surface grafting process.48,49 In this work, corona air plasma in combination with grafting the hyperbranched polyethylene glycol (HB-PEG) with hydroxyl end groups were employed to modify the surface of the PES UF membranes to improve the anti-fouling properties of the membranes. In this way, the surface of the PES membranes was firstly activated by the corona treatment, and then the HB-PEG modified agent was covalently grafted onto the surface of the corona treated membranes. The influence of the corona treatment operating conditions on the morphology, surface properties, separation performance and fouling tendency of the modified PES membranes were investigated. The surface properties, morphology and hydrophilicity of the membranes were evaluated by the Fourier Transform Infrared Spectrometer (FTIR), Atomic Force Microscopy (AFM) and contact angle tests. Moreover, the separation performance of the HB-PEG grafted membranes was investigated in oily wastewater treatment process. The main innovative aspect of this work is the use of HB-PEG in combination with the corona air plasma to modify the PES membranes for the wastewater treatment. Another important contribution is the development of a mechanism for the grafting reaction between the HB-PEG and corona treated PES membranes.
Experimental
Materials
The commercial PES polymer (Ultrason E6020P, molecular weight of 58![[thin space (1/6-em)]](https://www.rsc.org/images/entities/char_2009.gif) 000 g mol−1) was purchased from BASF (Ludwigshafen, Germany). N,N-Dimethyl formamide (DMF) and ethanol were used as solvents provided by Merck (Darmstadt, Germany). Finally, hyperbranched PEG was provided from Polymer Factory Co. (Sweden).
000 g mol−1) was purchased from BASF (Ludwigshafen, Germany). N,N-Dimethyl formamide (DMF) and ethanol were used as solvents provided by Merck (Darmstadt, Germany). Finally, hyperbranched PEG was provided from Polymer Factory Co. (Sweden).
Fabrication of PES membrane
The PES membrane was prepared by the non-solvent induced phase inversion technique as described by Sadeghi et al.20 The polymer powder was dried in an oven at 80 °C for 3 h. After that, a 16% wt PES was dissolved in the DMF solvent and stirred unendingly for 12 h to obtain a clear homogenous solution. Then, the obtained polymer solution was de-aerated by a vacuum system and cast on a flat glass plate by a casting knife device. The casted film was then dipped into a non-solvent bath containing deionized water at the room temperature to perform the phase inversion process and form the PES membrane. Then, the PES membrane was kept in another water bath for about 24 h to remove the remaining solvent. At the end, the prepared PES membrane was dried at the room temperature.HB-PEG grafting on membrane surface
In order to graft the HB-PEG onto the surface of the prepared PES membranes, the membrane surface was activated via corona air plasma treatment. Firstly, the PES membrane was washed with the deionized water, and then the membrane was exposed to air to be dried for 0.5 h and dried for 6 h in a vacuum oven at 80 °C. After that, the corona treatment of the PES membranes was conducted in the air at atmospheric pressure. A membrane sample with size of 7 × 9 cm was placed on the backing roller of the corona device which its surface shielded with silicon coating and rotating at a specified speed. The adjusted distance between silicon backing roll and aluminum electrodes was kept to 1.5 mm. The process of corona treatment was performed within the air gap between the electrode and backing roll at different input powers of 180–450 W and operating times of 2–6 min. The corona treatment conditions of the PES membrane was presented in Table 1. Also, the schematic of the grafting process was presented in Fig. S1 (ESI file†).| Membrane sample | Input power (W) | Time duration (min) |
|---|---|---|
| M0 | — | — |
| M1 | 180 | 2 |
| M2 | 180 | 4 |
| M3 | 180 | 6 |
| M4 | 270 | 2 |
| M5 | 270 | 4 |
| M6 | 270 | 6 |
| M7 | 360 | 2 |
| M8 | 360 | 4 |
| M9 | 360 | 6 |
| M10 | 450 | 2 |
| M11 | 450 | 4 |
| M12 | 450 | 6 |
In the next step, the corona treated PES membrane was immersed in a solution of 10 g L−1 of HB-PEG solution in ethanol. The mixed solution was purged with nitrogen for 15 min and then heated to 80 °C and kept about 12 h at this temperature; let the hydroxyl functional groups of HB-PEG react with the free radicals on the surface-activated PES. The membrane sample was taken out and rinsed with the deionized water for 3 h to remove the remaining solvent and unreacted HB-PEG molecules from the membrane surface. At the end, the membrane sample was dried at 60 °C for 12 h to obtain the HB-PEG grafted PES membrane.
Characterization tests
The FTIR analysis by a Nicolet spectrometer device (Nicolet Nexus 670, Nicolet Instrument Co., WI, USA) in the wave number range of 4000–650 cm−1 was employed to detect the functional groups on the surface of the HB-PEG grafted PES membrane.The AFM analysis (AFM, NanoEducator, NT-MDT Co., Zelenograd, Russia) was utilized to characterize the surface roughness of the prepared membranes. Moreover, the water contact angle test was employed to detect the alterations in the hydrophilicity property of the modified PES membranes after grafting of HB-PEG onto its surface. The contact angle of different membranes was measured at the room temperature using optical contact angle equipment (OCA-20; Data Physics Instruments GmbH, Filderstadt, Germany). The water contact angle of five different points on the membrane surface was determined and the average was reported.
In order to calculate the porosity of the neat and HB-PEG grafted membranes, the dry membrane was cut in a specific area and then dipped in the deionized water for 72 h. After that, water on the membrane surface was attentively removed with a clean tissue and the membrane sample was weighed to measure the membrane weight (Ww) in the wet-state. After that, the membrane sample was dried in an oven for 24 h and weighed again to determine the membrane weight (Wd) in the dry-state. The membrane porosity (ε) was determined using the below relation:
 | (1) |
The mean pore diameter (dp) of the membranes was specified by the filtration velocity technique based on the Guerout–Elford–Ferry equation.20
 | (2) |
Ultrafiltration of oily wastewater
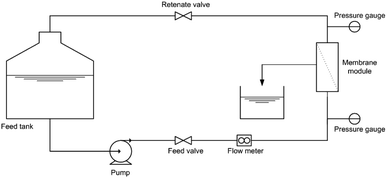
The separation performance of the HB-PEG grafted PES membranes was studied for the treatment of a synthetic oily wastewater with oil concentration of 3000 ppm at the ambient temperature and operational pressure of 1.5 bar. All the experiments were conducted by a cross flow flat sheet module contains a membrane with an area of 35 cm2. The schematic of the filtration apparatus is shown in Fig. 1. The UF set-up contains a feed storage tank and a rotary pump (Hypro 400XL4-Roller pump, USA) to transfer the feed stream to the module for the treatment. To set the pressure to a specific value and a set of pressure controller and pressure gauge have been utilized in the filtration apparatus. A regulative valve and a flow meter were used to adjust the feed flow rate. The filtration tests were performed based on the batch mode and the permeate stream was ceaselessly gathered and weighed. The permeate flux (J) and oil rejection (R) were calculated by the below relations:20
 | (3) |
 | (4) |
The oil concentration of feed and permeate was determined by the chemical oxygen demand (COD) analysis based on the opened reflux approach.50 The size distribution of oil droplets in the feed stream was also specified by the Dynamic Light Scattering (DLS) test using a laser diffraction particle size analyzer device (ZEN3600, Malvern Co., UK). Moreover, the flux recovery ratio (FRR) was applied to peruse the anti-fouling property of the HB-PEG grafted PES membranes. The FRR was calculated by below relation:
 | (5) |
The reversible fouling ratio (Rr) and irreversible fouling ratio (Rir) were also defined and calculated by the following equations, respectively:51
 | (6) |
 | (7) |
Results and discussion
Mechanism of grafting reactions
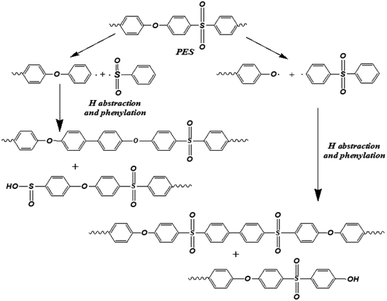
In this work, the surface modification of the PES UF membranes was performed by a two-step grafting method: (i) the membrane surface activation with corona discharge treatment, and (ii) grafting HB-PEG on the surface of the corona treated membrane. Since it is believed that photo-degradation of the PES to be initiated by breaking of C–S or C–O bonds under corona discharge,52 two mechanisms were proposed for the corona-degradation and hydrogen abstraction of the PES as indicated in Fig. 2. In the first mechanism, it is proposed that the corona discharge cleaves the C–S bond in the PES chains, and in another mechanism, the C–O bond is cleaved under corona discharge.Kuroda et al.53 investigated the photo degradation of the PES polymer and likely proposed two mechanisms. In the first mechanism, they showed that the SO2 formation is only a secondary reaction, though it is also affected by the mobility of polymer molecules. The other explanation is that the SO2 formation is the initial step of degradation followed by successive chain transfer accompanying the formation of crosslinks. In another research, Kuroda et al.54 showed that during C–S cleavage of the PES, phenylation reactions leads to the formation of biphenyl systems. Also, the Allen and Mckellar55 reported photo-degradation of the commercial PES membranes led to the cleavage of the C–O bond followed by hydrogen abstraction. These descriptions are consistent with the mechanisms proposed for the corona-degradation of the PES membranes in the present research.
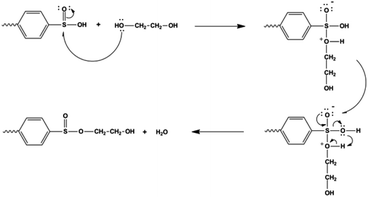
The corona treatment of the PES chains creates surface radicals. As shown in Fig. 2, the phenylation leads to the reaction of the degraded chains via the benzyl rings and the hydrogen abstraction resulted in the polymer surface with the hydrogen on surface.56 The acidic environment protonates the sulfoxide group in Fig. 2, causing the group to become susceptible to attacks by the hydroxyl group in HB-PEG. Since oxygen is much more electronegative compared to sulfur, it attracts the electrons from sulfur, which acquires a slight positive charge exposing it to attacks by a pair of electrons.56–58 When a molecule such as HB-PEG is in close proximity, the lone pairs from the oxygen atoms in the hydroxyl group attack sulfur atoms. As illustrated in Fig. 3, the electron pairs are transferred from the double sulfur–oxygen bond to oxygen, thereby giving oxygen a negative charge while the oxygen in the hydroxyl functional group acquired a positive charge. This intermediate compound causes a rearrangement of electrons. Finally, the hydroxyl group from the HB-PEG attaches and the existing hydrogen along with the hydroxyl group on the PES is released as a water molecule.56
Fig. S2† shows a comparison between the FTIR spectra of the corona treated PES, HB-PEG grafted PES and neat PES membranes. As indicated in Fig. S2,† there are differences between the FTIR spectra of the neat PES membrane and the membrane that was just exposed to the corona air plasma at the input power of 360 W and exposure time of 4 min. In the FTIR spectrum of the corona treated membrane (Fig. S2a†), the peak of hydroxyl groups appears at the wave number of 3433 cm−1, which attributed to the formation of sulfinic acid.59,60 Hashimoto et al.61 reported the O–H stretch of the HOSO2 radical has the IR peak at wave number range of 3300–3540 cm−1 and the analogous mode for sulfinic acid would be expected to have a similar frequency. Therefore, the results obtained from Fig. S2a† are in compatible with proposed mechanism for the bonds breakage of the PES membrane under the corona air plasma in Fig. 2. Also, Fig. S2b† represents a comparison between the FTIR spectra of the neat and HB-PEG grafted PES membranes. According to the proposed mechanism for the reaction between the HB-PEG and surface activated PES membrane depicted in Fig. 3, some new bonds such as O–H, stretching alkyl (C–H) and C![[double bond, length as m-dash]](https://www.rsc.org/images/entities/char_e001.gif) O of HB-PEG has been appeared in the FTIR spectrum of the HB-PEG grafted PES membranes as indicated in Fig. S2b.†
O of HB-PEG has been appeared in the FTIR spectrum of the HB-PEG grafted PES membranes as indicated in Fig. S2b.†
ATR-FTIR spectroscopy
The HB-PEG grafted PES membranes and neat one were characterized by the FTIR analysis to identify the variations in the functional groups of membrane surface after grafting HB-PEG onto the corona treated membranes and the results are demonstrated in Fig. S3.† The FTIR spectrum of the neat PES membrane has several absorbance peaks which are ascribed to the functional group in the PES molecule. Two peaks which were detected at wave numbers of 1320 and 1147 cm−1 are attributed to the sulfone group (SO2) in the PES structure which is due to asymmetric and symmetric stretches of this group. The peak corresponding to C–O appears at the wave number of 1103 cm−1. The absorbance peak at wavenumbers of 830 and 699 cm−1 are ascribed to out-of-plane vibrations of C–H bond and vibration band of C–S bond, respectively. The peaks at 1485 and 1576 cm−1 are ascribed to the aromatic C![[double bond, length as m-dash]](https://www.rsc.org/images/entities/char_e001.gif) C asymmetric stretching vibrations that is a characteristic bond for the PES molecule.62 A comparison between spectra of the corona treated membranes illustrates that there are new absorbance bands in the FTIR spectra of the HB-PEG grafted PES membranes. The absorbance bands at wave numbers of 2850 to 3000 and 3200 to 3600 cm−1 are attributed to the stretching alkyl (CH2) and hydroxyl (–OH) groups, respectively, in the molecular structure of HB-PEG on the PES membrane surface. Likewise, some new peaks at 2874 and 963 cm−1 which are attributed to C–H symmetric stretch, C–H rock and C–C stretch of the HB-PEG, respectively. These observations revealed that the HB-PEG chains were covalently attached onto the surface of the PES membrane.
C asymmetric stretching vibrations that is a characteristic bond for the PES molecule.62 A comparison between spectra of the corona treated membranes illustrates that there are new absorbance bands in the FTIR spectra of the HB-PEG grafted PES membranes. The absorbance bands at wave numbers of 2850 to 3000 and 3200 to 3600 cm−1 are attributed to the stretching alkyl (CH2) and hydroxyl (–OH) groups, respectively, in the molecular structure of HB-PEG on the PES membrane surface. Likewise, some new peaks at 2874 and 963 cm−1 which are attributed to C–H symmetric stretch, C–H rock and C–C stretch of the HB-PEG, respectively. These observations revealed that the HB-PEG chains were covalently attached onto the surface of the PES membrane.
Fig. 4 demonstrates the influence of corona operating time on the functional groups of the surface of the modified PES membranes. As indicated in this figure, at the minimum operating time of corona treatment (2 min), the changes in the peak intensity of the PES bonds do not significant. By increasing the time of the corona treatment, it is expected that intensity of all bonds to be increased. However, some fluctuation could be observed in some bonds. This could be attributed to the creation of more radical sites through the bond opening within extended exposure time to corona.20,63 Generally, the decrease or increase of the peak intensity at various corona treatment times, demonstrate two possible phenomena, which are damaging effect and building effect during the corona air plasma process.20 At higher treatment times, the building effect overcomes, and therefore, active sites on the surface of the PES membrane increase. However, decreasing the exposure time slows down the formation of active sites, and ultimately damaging effect dominated. These two phenomena might counteract each other or surpass the other, therefore, different impacts can be observed in different conditions.20,64,65 Fig. 5 indicates the influence of corona input power on the functional groups of the surface of modified PES membranes. As indicated in this figure, at the input power of 360 W, the peak density of different functional group is greater than other corona powers. At the exposure time of 2 min, by increasing the input power of corona treatment, it is observed that the bond degradation intensified. This can be due to the fact that the short exposure time of 2 min cannot provide the sufficient ionized energy and thus damaging effect dominated.63 At the input power of 360 W and the exposure time of 6 min, the highest bonds intensity could be observed and it could be regarded the best operating conditions for the corona air plasma treatment in the present research.
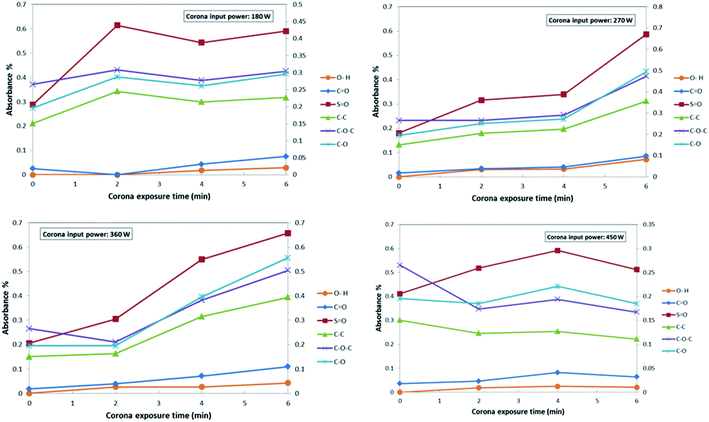 | ||
| Fig. 4 The effect of the corona exposure time on the functional groups of the PES membranes at various input powers. | ||
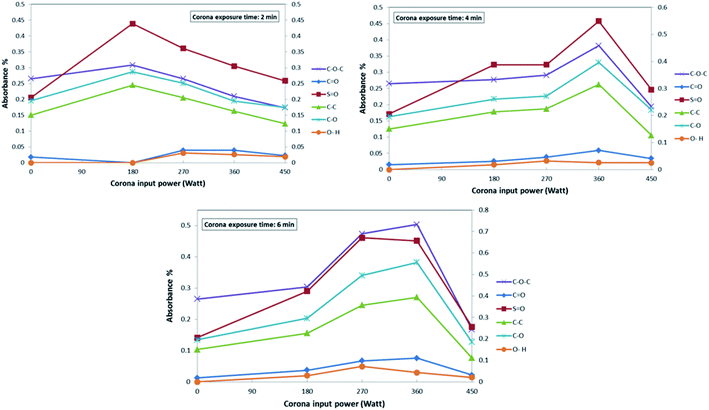 | ||
| Fig. 5 The effect of corona input power on the functional groups of the PES membranes at various exposure times. | ||
AFM analysis
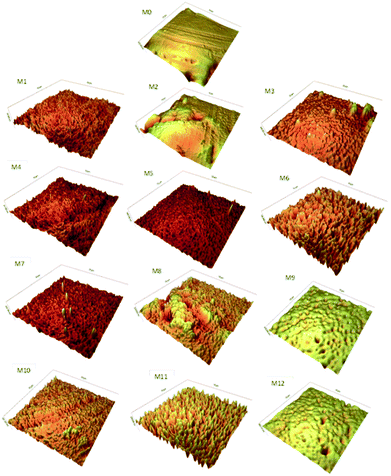
The AFM analysis was applied to investigate the changes of roughness and surface morphology of the PES membranes after the corona treatment process. One of the most important factor in membrane fouling is the membrane surface roughness. As the roughness of the membrane increased, the membrane is more susceptible to organic fouling and traps more particles and thus it causes to intensify the fouling on the surface of the membrane.65 Fig. 6 presents the 3D AFM images of the untreated and corona treated PES membranes. Also, Table 2 illustrates the root mean square (RMS) and surface average roughness (Ra) of the corona treated PES membranes. As presented in this table, at a specified input power, the surface roughness of the PES membranes intensified as the corona exposure time changes from 2 to 6 min. Likewise, a similar trend was detected for the influence of the input power on the surface roughness of the modified membranes, as the corona input power varied from 180 to 450 W at a specified exposure time. Generally, three reasons can describe the effect of the corona treatment on the surface of the PES membrane. First of all, etching and ablation causes opening up new pores and pore enlargement which leads in roughening the PES membrane surface.66,67 Second, the air corona treatment causes introduce various functional groups on the surface of the PES membrane and it will lead to crosslinking and chain scission, thus changes the surface morphology.68 Third, deposition of volatile products or polymer wreckages from the etched surface causes the surface of the PES membrane smoother and pores become narrower. Therefore, during the corona treatment of the membrane, there would be a competition between decomposition and etching effect which the operating conditions can determine which effect can overcome the other effect and identify the PES membrane surface morphology.66,69| Membrane sample | RMS (nm) | Ra (nm) |
|---|---|---|
| M0 | 28.5 | 16.3 |
| M1 | 3.7 | 2.9 |
| M2 | 58.8 | 41.0 |
| M3 | 42.4 | 26.4 |
| M4 | 4.5 | 3.5 |
| M5 | 11.1 | 6.8 |
| M6 | 23.8 | 19.2 |
| M7 | 9.0 | 6.2 |
| M8 | 29.6 | 22.9 |
| M9 | 32.6 | 24.1 |
| M10 | 16.1 | 11.8 |
| M11 | 31.6 | 25.8 |
| M12 | 41.9 | 28.8 |
Contact angle analysis
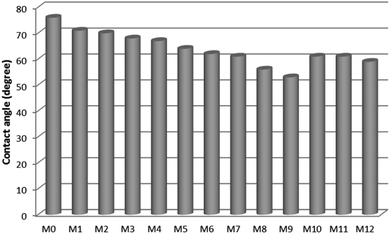
The water contact angle of the HB-PEG grafted corona treated membranes was determined and compared with that of the unmodified one and the results are presented in Fig. 7. It was observed that the contact angles of the prepared membranes were reduced from 76° to 53° after the HB-PEG grafting. The lowest water contact angle between all samples was found for the M9 sample. As mentioned in the previous section, the best corona treatment operating conditions occurred at the input power of 360 W and exposure time of 6 min (M9 sample). The results of water contact angle test affirm that hydrophilic HB-PEG was effectively grafted on the corona treated PES membranes.Pore size and porosity
The mean pore diameter and porosity of the HB-PEG grafted PES membrane and the neat one are presented in Table 3. As can be seen, the pore size value for the neat PES membrane was slightly higher than those of the modified ones which is due to the partial plugging of the surface pores of the membranes and by deposition of volatile products or polymer fragments from the etched surface during the corona treatment as well as by the HB-PEG during the grafting process. Likewise, the porosity of various prepared membranes is in the range 85–88%.| Membrane samples | Mean pore size (nm) | Porosity (%) |
|---|---|---|
| M0 | 30 ± 0.6 | 85 |
| M1 | 22 ± 0.6 | 85 |
| M2 | 22 ± 0.9 | 87 |
| M3 | 26 ± 0.5 | 86 |
| M4 | 26 ± 0.6 | 86 |
| M5 | 24 ± 0.9 | 87 |
| M6 | 24 ± 0.8 | 88 |
| M7 | 30 ± 0.5 | 84 |
| M8 | 28 ± 0.8 | 84 |
| M9 | 30 ± 0.6 | 85 |
| M10 | 26 ± 0.6 | 86 |
| M11 | 26 ± 0.9 | 88 |
| M12 | 28 ± 0.9 | 87 |
Separation and anti-fouling performance of membranes
In order to evaluate the separation performance of the HB-PEG grafted PES membranes, the pure water flux and the permeation flux of a of 3000 ppm oil in water emulsions were measured through the UF experiments. Fig. S4† shows the size distribution of the oil droplets in the feed stream which contains 3000 ppm oil in water emulsion. As indicated in this figure, the oil droplets size varied in the range of 52–946 nm with an average size of 570 nm. The separation and anti-fouling properties of the prepared PES membranes at various corona treatment conditions are given in Table 4. It is observed that the pure water flux and oil–water flux of the HB-PEG grafted PES membranes, which were treated at the corona input power of 180 W and different exposure times, are lower than that of the neat PES membrane. The decrease in the fluxes in these cases could be attributed to this phenomenon that the corona treatment creates some imperfections on the surface of the PES membrane and redeposition of etched fragments also arises.63,70 By increasing the exposure time of the corona treatment, the pure water and oil–water fluxes enhance due to increasing the surface hydrophilicity and overcoming the etching effects. Similar trends were observed for the HB-PEG membranes treated at the corona input power of 360 and 450 W. Moreover, for the effect of input power at constant exposure time, it can be seen that the pure water and oil–water flux increase by a variation in the corona power from 180 to 450 W. Table 4 also represents that the oil–water flux of all samples are significantly lower than pure water flux. It could be ascribed to the membrane fouling which caused by pore blocking of the PES membranes due to deposition of organic particles and oil droplets on the pore walls during UF separation process.71 According to Table 4, it can be observed that all modified PES membranes had higher oil rejection than the neat membrane. As mentioned before, by increasing the corona exposure time, deposition of polymer fragments from the etched surface or other particles on the surface of the PES membrane causes the pores become narrower and thus smaller portion of oil can pass through the membrane and the oil rejection increases with respect to the neat membrane sample. On the other hand, by increasing the corona input power, the surface roughness of the PES membranes increases and thus oil particles might be trapped in these holes and thus intensify the membrane fouling and oil rejection decreases. Therefore, there would be a competition between these two effects which the operating conditions can determine which effect can overcome the other and identify the anti-fouling properties of the membranes. The anti-fouling properties of the membrane at input power 360 W and exposure time of 6 min shows the best separation performance which could be regarded the best operating condition in the present research. As Table 4 illustrates, the oil rejection of all corona treated PES membranes is about 93%. There are two reasons for the oil rejection of 93%: (i) the values for the pore radius in Table 3 (in the range of 22 to 30 nm) are the average values and the membranes certainly have pore size higher than 52 nm, therefore, the small oil droplets can pass through the large membrane pores. (ii) The DLS analysis (Fig. S2†) revealed that a large amount of the oil is suspended in water and a small portion of oil is dissolved in water. Generally, the oil droplets smaller than 35 nm dissolved in water can pass through the membrane pores.| Membrane samples | Pure water flux (kg m−2 h−1) | Oil–water flux (kg m−2 h−1) | FRR (%) | Rejection (%) |
|---|---|---|---|---|
| M0 | 138.5 ± 9.8 | 91.8 ± 9.9 | 56 | 91.8 |
| M1 | 123.2 ± 8.6 | 51.4 ± 8.3 | 56 | 93.6 |
| M2 | 136.9 ± 9.1 | 62.6 ± 8.4 | 58 | 93.4 |
| M3 | 138.2 ± 9.7 | 58.8 ± 6.9 | 57 | 93.1 |
| M4 | 146.8 ± 7.1 | 69.8 ± 9.8 | 61 | 93.3 |
| M5 | 132.5 ± 9.2 | 64.8 ± 9.2 | 61 | 93.1 |
| M6 | 134.6 ± 6.9 | 68.2 ± 9.1 | 64 | 92.8 |
| M7 | 164.2 ± 9.3 | 96.8 ± 7.4 | 71 | 93.6 |
| M8 | 173.2 ± 7.2 | 96.4 ± 8.2 | 68 | 93.5 |
| M9 | 178.6 ± 8.6 | 113.7 ± 8.5 | 74 | 93.1 |
| M10 | 157.3 ± 5.2 | 93.1 ± 9.1 | 71 | 92.4 |
| M11 | 164.2 ± 9.9 | 95.8 ± 8.9 | 71 | 92.0 |
| M12 | 165.9 ± 7.4 | 99.5 ± 5.8 | 72 | 91.8 |
Moreover, the flux recovery ratio of the HB-PEG grafted membranes and neat PES membrane is calculated to investigate the fouling resistance and recycling property of the membranes. It can be seen that the FRR value for the all of modified membranes was higher than the unmodified one except at corona input power of 180 W. As it was mentioned, it is due to some imperfections on the surface of the PES membrane and re-deposition of the etched fragments on the PES surface membrane at the input power of 180 W. By increasing the corona input power and exposure times, the FRR values intensified significantly. This confirms that the fouling resistance of the membranes modified by the HB-PEG grafting after the air corona treatment enhanced. For a better visualization of the efficiency of the grafting process, Table 4 made a comparison of the modified PES membranes with different operating conditions. Among the grafted PES membranes, the M9 sample showed the best anti-fouling property. Because this membrane had the lowest water contact angle, the low hydrophobic interaction between the grafted PES membrane and the oil droplets in the feed streams was expected. Finally, the results indicated that, the HB-PEG grafted membranes have higher anti-fouling properties than the unmodified membrane. It means that the surface modification of the PES membrane and the grafting hydrophilic HB-PEG on the membrane surface have notable effect on the separation performance of the membrane and lead to higher efficiency of the membranes.
Also, in order to verify the stability and performance of the modified membranes, a comparison between the long-term filtration tests of the neat membrane and HB-PEG grafted membranes (M9 sample) was provided. Fig. 8 shows the oil–water flux of the membranes for the long-term UF test as a function of the operating time. As can be seen in this figure, at the early period of the filtration, the permeate flux of the neat PES membrane rapidly reduces due to the membrane pore blocking and oil droplets deposition. Also, after 100 min, the reduction rate of permeation flux continued and therefore, the membrane's performance is degraded. In other hand, the reduction rate in the permeate flux of the HB-PEG grafted PES membrane becomes very slow after 100 min and the flux approaches the pseudo-steady values. The results indicated that the M9 membrane had good performance and stability for the long time with the oil rejection of 92.8%.
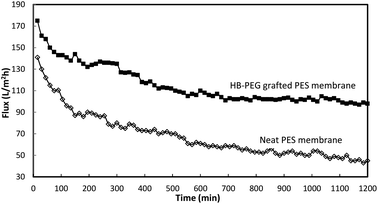 | ||
| Fig. 8 The oil–water flux of the neat and HB-PEG grafted PES membranes in the long term filtration test. | ||
Chemical stability
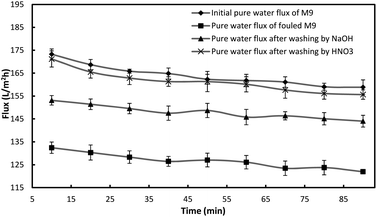
To evaluate the chemical stability of the prepared PES membranes, a five-step chemical washing procedure was used. In this procedure, the fouled M9 membrane was washed and regenerated between subsequent runs as shown in Table 5. After each experiment, the membrane module was rinsed with tap water for 20 min at a Reynolds number of 2500 and pressure of 1 bar in order to remove the reversible polarized layer. Then it was submitted to two washing steps using a NaOH aqueous solution and a HNO3 aqueous solution. These two steps were carried out for 30 min duration. At the end of each step the membrane module was rinsed with tap water for 20 min and the permeate flux was measured. The cleaning effectiveness was measured by comparing the un-cleaned flux to the cleaned flux based on the following equation:1
 | (8) |
| Step | Time (min) | Washing solution | Concentration (%wt) | Temperature (°C) |
|---|---|---|---|---|
| 1 | 20 | Pure H2O | Pure | 25 |
| 2 | 30 | Basic solution | 0.2% NaOH | 25 |
| 3 | 20 | Pure H2O | Pure | 25 |
| 4 | 30 | Acidic solution | 0.2% HNO3 | 25 |
| 5 | 20 | Pure H2O | Pure | 25 |
| Steps | Pure water flux recovery (%) |
|---|---|
| After washing by NaOH solution | 57.0 |
| After washing by HNO3 solution | 96.6 |
Membrane reversibility
The membrane fouling consists of reversible fouling and irreversible fouling. The reversible oil adsorption causes to reversible fouling, which could be removed by a simple chemical cleaning. On the contrary, the irreversible fouling results from the strong adsorption of oil droplets molecules on the surface or the entrapment of oil droplets in the pores.72,73 The reversible fouling ratio and irreversible fouling ratio values for the neat PES membrane and HB-PEG grafted PES membrane (M9 sample) were presented in Fig. 10. As indicated in this figure, the irreversible resistance (Rir) of the HB-PEG grafted membrane was considerably reduced from 16% to 4% with respect to the neat PES membrane. On the other hand, reversible resistance (Rr) of the neat PES membrane increased from 9.9% to 32.3%. These results demonstrated that the HB-PEG grafted membrane show remarkable antifouling properties due to its hydroxyl end groups. Also, several characteristic parameters of membrane such as hydrophilicity, surface roughness, pore size and surface charge could be influenced on the membrane reversibility and irreversibility.74 | ||
| Fig. 10 The reversible fouling ratio and irreversible fouling ratio values for the neat PES membrane and HB-PEG grafted PES membrane (M9 sample). | ||
Conclusions
The HB-PEG grafting in combination with the corona air plasma was employed to modify the surface of the PES membrane to intensify the anti-fouling properties. A mechanism for the grafting HB-PEG on the corona treated PES membrane was proposed and all the steps of grafting were described in details. Also, the effects of corona treatment operating conditions like input power and exposure time on the surface properties, morphology, separation performance and anti-fouling property of the modified PES membranes were investigated and the following results were concluded:✓ The PES membranes exposed to the corona air plasma at different operating conditions demonstrated different behaviors including etching effect, formation of hydrophilic bonds and re-deposition of the etched fragments which results in physical and chemical changes on the surface of the PES membrane. The etching effect led to the surface roughening, while the formation of hydrophilic bonds onto the PES membrane surface and re-deposition of etched fragments both led to PES surface smoothening.
✓ During the corona treatment of the PES membranes, there would be a competition between decomposition and etching effect which the operating conditions can determine which effect can overcome the other effect and identify the PES membrane surface morphology.
✓ The corona air plasma at operating condition of 360 W and exposure time of 6 min and subsequent HB-PEG grafting on the surface of the corona treated membrane showed the best separation performance. At these conditions, the anti-fouling properties of the PES membrane including surface hydrophilicity, oil–water permeation flux and flux recover ratio markedly enhanced.
Generally, the hydrophilicity and anti-fouling properties of the HB-PEG grafted PES membranes were remarkably improved, resulting in the stable permeation flux. Finally, it can be concluded that the grafting HB-PEG with multifunctional end groups and lower packing density is a suitable technique for the surface modification of the PES membrane to improve its separation performance.
Conflicts of interest
There are no conflicts to declare.References
- S. Afkham, A. R. Raisi and A. Aroujalian, Desalin. Water Treat., 2016, 57, 1–17 CrossRef.
- K. Roy, A. Mukherejee, N. R. Maddela, S. Chakrabotry, B. Shen, M. Li, D. Du, Y. Peng, F. Lu and L. C. G. Cruzatty, Chem. Eng. J., 2020, 8, 103572 CAS.
- K. Masoudnia, A. R. Raisi, A. Aroujalian and M. Fathizadeh, Desalin. Water Treat., 2014, 4, 1–12 Search PubMed.
- R. C. Munoz and V. Fila, Trends Food Sci. Technol., 2018, 82, 8–20 CrossRef.
- Q. Wu, W. Xie, H. Wu, L. Wang, S. Liang and H. Chang, RSC Adv., 2019, 9, 34486–34495 RSC.
- C. H. Yu, C. H. Wu, C. H. Lin, C. H. Hsiao and C. F. Lin, Sep. Purif. Technol., 2008, 64, 206–212 CrossRef CAS.
- K. O. Agenson and T. Urase, Sep. Purif. Technol., 2007, 55, 147–156 CrossRef CAS.
- M. Koh, M. M. Clark and K. J. Howe, J. Membr. Sci., 2005, 256, 169–175 CAS.
- X. J. Lee, P. L. Show, T. Katsuda, W. H. Chen and J. S. Chang, Bioresour. Technol., 2018, 269, 489–502 CrossRef CAS PubMed.
- Y. Liao, A. Bokhary, E. Maleki and B. Liao, Bioresour. Technol., 2018, 264, 343–358 CrossRef CAS PubMed.
- S. Remanan and N. Chandra Das, Polym. Test., 2019, 79, 183–191 CrossRef.
- H. Tanudjaja, C. Hejase, V. V. Tarabara, A. G. Fane and J. W. Chew, Water Res., 2019, 156, 347–365 CrossRef CAS PubMed.
- V. B. Bruggen, J. Appl. Polym. Sci., 2009, 42, 630–642 CrossRef.
- K. C. Khulbe, C. Feng and T. Matsuura, J. Appl. Polym. Sci., 2010, 115, 855–895 CrossRef CAS.
- N. A. M. Nazri, W. J. Lau, M. Padaki and A. F. Ismail, J. Polym. Res., 2014, 21, 1–11 CAS.
- L. D. Shen, X. F. Yu, C. Cheng, C. L. Song, X. F. Wang, M. F. Zhu and B. S. Hsiao, J. Membr. Sci., 2016, 499, 470–479 CrossRef CAS.
- W. T. Yang, Z. Wang, Y. N. Zhou, X. Ye, L. Y. Shi, L. N. Cheng, N. Chen, W. Y. Dong, Q. Zhang and X. M. Zhang, Desalination, 2013, 324, 57–64 CrossRef CAS.
- T. Iwa, H. Kumazawa and S. Y. Bae, J. Appl. Polym. Sci., 2004, 94, 758–762 CrossRef CAS.
- K. R. Kull, M. L. Steen and E. R. Fisher, J. Membr. Sci., 2005, 246, 203–215 CrossRef CAS.
- I. Sadeghi, A. Aroujalian, A. Raisi, B. Dabir and M. Fathizadeh, J. Membr. Sci., 2013, 430, 24–36 CrossRef CAS.
- D. S. Wavhal and E. R. Fisher, J. Polym. Sci., Part B: Polym. Phys., 2002, 40, 2473–2488 CrossRef CAS.
- J. Dejeu, B. Lakard, P. Fievet and S. Lakard, J. Colloid Interface Sci., 2009, 333, 335–340 CrossRef CAS PubMed.
- N. Hilal, L. Al-Khatib, H. Al-Zoubi and R. Nigmatullin, Desalination, 2005, 184, 45–55 CrossRef CAS.
- M. Taniguchi and G. Belfort, J. Membr. Sci., 2004, 231, 147–157 CrossRef CAS.
- W. Zhao, Y. L. Su, C. Li, Q. Shi, X. Ning and Z. Y. Jiang, J. Membr. Sci., 2008, 318, 405–412 CrossRef CAS.
- L. P. Zhu, Z. Yi, F. Liu, X. Z. Wei, B. K. Zhu and Y. Y. Xu, Eur. Polym. J., 2008, 44, 1907–1914 CrossRef CAS.
- C. Zhao, J. Xue, F. Ran and S. Sun, Prog. Mater. Sci., 2013, 58, 76–150 CrossRef CAS.
- Y. Liu, Y. Su, Y. Li, X. Zhao and Z. Jiang, RSC Adv., 2015, 5, 21349–21359 RSC.
- T. Arumugham, N. J. Kaleekkal and D. Rana, Polym. Test., 2018, 72, 1–10 CrossRef CAS.
- R. Jayasekara, I. Harding, I. Bowater, G. B. Y. Christie and G. T. Lonergan, Polym. Test., 2004, 23, 17–27 CrossRef CAS.
- W. Xiuzhen, F. Yaowei, S. Yingying, C. Jinyuan, L. Bosheng, C. Yongsheng and H. Xiang, Polym. Adv. Technol., 2016, 27, 1569–1576 CrossRef.
- B. Chen, Y. Zhang, J. Zhang, L. Zhu and H. Zhao, RSC Adv., 2019, 9, 18688–18696 RSC.
- L. J. Mu and W. Z. Zhao, Appl. Surf. Sci., 2009, 225, 7273–7278 CrossRef.
- Z. L. Xu and F. A. Qusay, J. Appl. Polym. Sci., 2004, 91, 3398–3407 CrossRef CAS.
- V. R. Pereira, A. M. Isloor, U. K. Bhat and A. F. Ismail, Desalination, 2014, 351, 220–227 CrossRef CAS.
- C. Qiu, F. Xu, Q. T. Nguyen and Z. Ping, J. Membr. Sci., 2005, 255, 107–115 CrossRef CAS.
- Y. Wang, J. H. Kim, K. H. Choo, Y. S. Lee and C. H. Lee, J. Membr. Sci., 2000, 169, 269–276 CrossRef CAS.
- D. S. Wavhal and E. R. Fisher, Desalination, 2005, 172, 189–205 CrossRef CAS.
- N. Saxena, C. Prabhavathy and D. S. DasGupta, Sep. Purif. Technol., 2009, 70, 160–165 CrossRef CAS.
- M. L. Steen, L. Hymas, E. D. Havey, N. E. Capps, D. G. Castner and E. R. Fisher, J. Membr. Sci., 2001, 188, 97–114 CrossRef CAS.
- M. L. Steen, A. C. Jordan and E. R. Fisher, J. Membr. Sci., 2002, 204, 341–357 CrossRef CAS.
- D. Tyszler, R. G. Zytner, A. Batsch, A. Brugger, S. Geissler, H. Zhou, D. Klee and T. Melin, Desalination, 2006, 189, 119–129 CrossRef CAS.
- H. Guo, C. Geng, Z. Qin and C. Chen, Desalin. Water Treat., 2013, 51, 3810–3813 CrossRef CAS.
- L. Q. Zhu, B. K. Zhu, L. Xu, Y. Z. Feng, F. Liu and Y. Y. Xu, Appl. Surf. Sci., 2007, 253, 6052–6059 CrossRef CAS.
- L. Gelde, M. I. Vazquez and J. Benavente, Polym. Test., 2011, 30, 457–462 CrossRef CAS.
- X. Z. Wei, X. F. Liu, B. K. Zhu and Y. Y. Xu, Desalination, 2009, 247, 647–656 CrossRef CAS.
- L. B. Zhao, M. Liu, Z. L. Xu, Y. M. Wei and M. X. Xu, Chem. Eng. Sci., 2015, 137, 131–139 CrossRef CAS.
- M. Moradi and G. Moussavi, Chem. Eng. J., 2019, 358, 1038–1046 CrossRef CAS.
- M. Vatani, A. R. Raisi and G. R. Pazuki, Microporous Mesoporous Mater., 2017, 263, 257–267 CrossRef.
- A. D. Eaton, L. S. Clesceri, A. E. Greenberg and M. A. H. Franson, Standard methods for the examination of water and wastewater, American Public Health Association, American Water Works Association and the Water Environment Federation, 1995 Search PubMed.
- V. Vatanpour, S. S. Madaeni, R. Moradian, S. Zinadini and B. Astinchap, J. Membr. Sci., 2011, 375, 284–294 CrossRef CAS.
- A. Rivaton and J. L. Gardette, Polym. Degrad. Stab., 1999, 66, 385–403 CrossRef CAS.
- S. Kuroda, I. Mita, K. Obata and S. Tanaka, Polym. Degrad. Stab., 1990, 27, 257–270 CrossRef CAS.
- S. I. Kuroda, A. Nagendran, K. Horie and I. Mita, Eur. Polym. J., 1989, 25, 621–627 CrossRef CAS.
- N. S. Allen and J. F. Mckellar, J. Appl. Polym. Sci., 1977, 21, 1129–1135 CrossRef CAS.
- J. J. Lowke and R. Morrow, Pure Appl. Chem., 1994, 66, 1287–1294 CAS.
- S. Futamura, IEEE Trans. Ind. Appl., 1997, 33, 447–453 CrossRef CAS.
- Q. Huang, L. Liu, Z. Wu, S. Ji, H. Wu, P. Chen, Z. Ma, Z. Wu, R. K. Y. Fu, H. Lin, X. Tian, F. Pan and p. K. Chu, Surf. Coat., 2020, 384, 125321 CrossRef CAS.
- M. A. Fender, Y. M. Sayed and F. T. Prochaska, J. Phys. Chem., 1992, 95, 2811–2814 CrossRef.
- M. Anbar and H. Taube, J. Am. Chem. Soc., 1954, 76, 6243 CrossRef CAS.
- S. Hashimoto, S. Inoue and H. Akimoto, Chem. Phys. Lett., 1984, 107, 198 CrossRef CAS.
- S. Belfer, R. Fainchtain, Y. Purinson and O. Kedem, J. Membr. Sci., 2000, 172, 113–124 CrossRef CAS.
- V. Moghimifar, A. R. Raisi and A. Aroujalian, J. Membr. Sci., 2014, 461, 69–80 CrossRef CAS.
- K. S. Kim, K. H. Lee, K. Chao and C. E. Park, J. Membr. Sci., 2002, 199, 135–145 CrossRef CAS.
- S. Pal, S. Kumar Ghatak, S. De and S. DasGupta, J. Membr. Sci., 2008, 323, 1–10 CrossRef CAS.
- O. D. Greenwood, R. D. Boyd, J. Hopkins and J. P. S. Badyal, J. Adhes. Sci. Technol., 2012, 9, 311–326 CrossRef.
- S. J. Park and H. Y. Lee, J. Colloid Interface Sci., 2005, 285, 267–272 CrossRef CAS PubMed.
- Y. Zhang, K. L. Tan, B. Y. Liaw, D. J. Liaw, E. T. Kang and K. G. Neoh, Langmuir, 2001, 17, 2265–2274 CrossRef CAS.
- S. Pal, S. K. Ghatak, S. De and S. DasGupta, Appl. Surf. Sci., 2008, 255, 2504–2511 CrossRef CAS.
- M. S. Kang, B. Chun and S. S. Kim, J. Appl. Polym. Sci., 2001, 81, 1555–1566 CrossRef CAS.
- E. M. Liston, L. Martinu and M. R. Werheimer, J. Adhes. Sci. Technol., 2012, 7, 1091–1127 CrossRef.
- O. Ferrer, B. Lefevre, G. Prats, X. Bernat, O. Gibert and M. Paraira, Desalin. Water Treat., 2016, 57, 1–15 CrossRef.
- A. Tikka, W. Gao and B. Liao, Water Res., 2019, 151, 260–270 CrossRef CAS PubMed.
- D. Rana and T. Matsuura, Chem. Rev., 2010, 110, 2448–2471 CrossRef CAS PubMed.
Footnote |
| † Electronic supplementary information (ESI) available. See DOI: 10.1039/d0ra02032j |
| This journal is © The Royal Society of Chemistry 2020 |

