 Open Access Article
Creative Commons Attribution 3.0 Unported Licence
Fluorescent polydopamine nanoparticles as a nanosensor for the sequential detection of mercury ions and L-ascorbic acid based on a coordination effect and redox reaction†
Yi-Xuan Yang‡
,
Yan-Zhao Fang‡,
Jing-Xuan Tian,
Qiang Xiao * and
Xiang-Juan Kong
 *
*
Jiangxi Key Laboratory of Organic Chemistry, Jiangxi Science and Technology Normal University, Nanchang 330013, P. R. China. E-mail: xiaoqiang@tsinghua.org.cn; xiangjuankong@163.com; Fax: +86-791-86422903; Tel: +86-791-86422903
First published on 27th July 2020
Abstract
Herein, a novel fluorescence nanosensor using intrinsic fluorescent polydopamine nanoparticles (PDA NPs) as an effective signal reporter has been constructed for the simple, rapid and sequential detection of mercury ions (Hg2+) and L-ascorbic acid (AA) based on a coordination effect and redox reaction. The fluorescence of the PDA NPs could be specifically quenched by Hg2+ through intense coordination effects between the Hg2+ and the groups (catechol, amine, ketone and imine) on the surface of the PDA NPs. However, when AA and Hg2+ coexisted in solution, the fluorescence of the PDA NPs pronouncedly recovered via the redox reaction of Hg2+, with it being reduced to Hg0 by AA. The fluorescence quenching mechanism of Hg2+ towards the PDA NPs and the redox reaction between Hg2+ and AA were also fully investigated. The nanosensor exhibited high sensitivity and desirable selectivity for Hg2+ and AA detection. Moreover, the strategy was successfully explored in real samples (tap water, lake water and human serum samples) with satisfactory recoveries. The developed nanosensor provides new sights and good inspiration for Hg2+ and AA detection under real conditions.
Introduction
Mercury ions (Hg2+), as a highly toxic heavy metal pollutant that abound in the environment, may lead to serious side effects once they enter living organisms, because they are not biodegradable and can accumulate in the body, leading to kidney, eye, respiratory and central nervous system damage.1,2 L-Ascorbic acid (AA), an essential micronutrient and water-soluble antioxidant, plays a vital role in numerous physiological and biochemical systems, such as oxidative stress reduction, immune cell function and disease prevention in the human body.3,4 Moreover, abnormal levels of AA in the human body are closely associated with many diseases, such as rheumatoid arthritis, scurvy, kidney stones, and diarrhea.5–9 Therefore, developing simple, rapid, and economical methods for the highly sensitive and selective detection of Hg2+ and AA has attracted considerable interest owing to their significant impact on human health.Up to now, a number of strategies based on electrochemistry,10,11 chemiluminescence,12,13 chromatography,14,15 colorimetry,16,17 fluorescence methods and other techniques have been introduced for Hg2+ and AA detection.18–23 Among them, fluorescence methods have been widely used due to their high sensitivity, rapid response and good reproducibility.24,25 Up to now, nanoparticles, including upconversion nanoparticles,7,26–28 have emerged for Hg2+ and AA detection.29–34 Nevertheless, the preparation procedures and reaction conditions of these nanoparticles might be sophisticated and harsh. Thus, developing simple and rapid fluorescence strategies for Hg2+ and AA detection is still highly desirable.
More recently, intrinsically fluorescent polydopamine nanoparticles (PDA NPs) have emerged as a novel bioinspired polymer nanoprobe owing to their easy synthesis, good water-solubility and biocompatibility.35,36 To the best of our knowledge, intrinsically fluorescent PDA NPs have emerged as a burgeoning field with brilliant prospects in sensing and imaging applications. For instance, Liu et al. developed a fluorescent polydopamine dot-based nanosensing strategy for glutamate and Al3+ detection in human serum and living cells.37 Fu et al. reported a facile one-pot method for the synthesis of blue luminescent PDA NPs and developed a nanosystem for the sensitive detection of Fe3+.38 Chu et al., using MnO2 as an oxidant, synthesized the intrinsically fluorescent PDA NPs and established a nanosensor for glutathione detection.39 Yang et al. extended the application of the intrinsically fluorescent PDA NPs towards the sensitive detection of alkaline phosphatase by employing MnO2 nanosheets as an effective nanoquencher.40 Jiang et al., using dopamine as a precursor, successfully synthesized fluorescent polydopamine organic nanoparticles, which were further used for developing nucleus-targeting imaging platforms.41 The intrinsically fluorescent PDA NPs presented outstanding physicochemical features and displayed promising applications for sensing and imaging. However, the exploitation of intrinsically fluorescent PDA NPs for analytical applications is still at its early stages, and constructing more novel designs and exploring groundbreaking systems for sensing applications is still attractive.
Herein, we, for the first time, propose a novel fluorescence nanosensor for the sequential detection of Hg2+ and AA based on Hg2+-induced quenching of intrinsically fluorescent PDA NPs through an intense coordination effect between Hg2+ and the groups on the surface of the PDA NPs, and AA-triggered pronounced fluorescence recovery of PDA NPs via redox reaction of Hg2+, with them being reduced to Hg0 by AA. As shown in Scheme 1, the fluorescence of the PDA NPs showed a selective quenching response towards Hg2+ via a coordination effect. Interestingly enough, when AA and Hg2+ were added simultaneously into the solution, Hg2+ was quickly reduced to Hg0, meanwhile, AA, acting as a reductant, was oxidized to dehydroascorbic acid (DHAA),42 as shown in the following equation:
| Hg2+ + AA → Hg0 + DHAA + 2H+ |
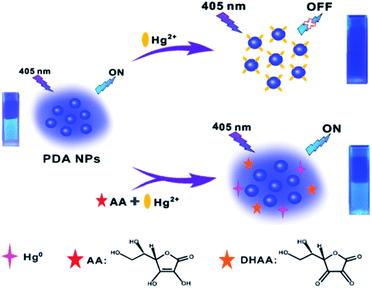 | ||
| Scheme 1 Schematic illustration of the mechanism of the fluorescent PDA NPs-based nanosensor for Hg2+ and AA detection. | ||
Experimental
Reagents and materials
Reduced N-ethylmaleimide (NEM) and dopamine hydrochloride were purchased from Sigma-Aldrich. Glutathione (GSH), leucine (Leu), glycine (Gly), cysteine (Cys), homocysteine (Hcy), and AA were purchased from Sangon Biotechnology Company. All the other chemical reagents were of analytical grade. The water used throughout the experiments was obtained from a water purification system with an electric resistance of >18.2 MΩ (Sartorius, Germany). Tap water was obtained from our lab and lake water was obtained from Jingguan Lake at our school. Human serum samples were provided by The First Hospital of Nanchang, Nanchang University (Nanchang, China). All animal procedures were performed in accordance with the Guidelines for the Care and Use of Laboratory Animals of The First Hospital of Nanchang, Nanchang University and approved by the Animal Ethics Committee of The First Hospital of Nanchang, Nanchang University. Our institutional ethics committee specifically approved the absence of informed consent because the data were analyzed anonymously.Fluorescence measurements were performed in a 96-well black microplate on a Varioskan LUX microplate reader under 405 nm excitation light (Thermo Scientific, USA). The accurate experimental spectroscopic procedure was carried out at a bandwidth of 12 nm. UV-vis absorption measurements were performed in an 8453 UV-vis spectrophotometer (Agilent, USA). Fourier-transform infrared (FT-IR) spectra were measured using a Spectrum Two spectrometer (PerkinElmer, USA). Transmission electron microscopy (TEM) and energy-dispersive X-ray spectroscopy (EDS) images were acquired using a TECNAI G2 20 at an accelerating voltage of 200 kV. X-ray photoelectron spectroscopy (XPS) spectra of the solid samples were measured on an Axis Ultra DLD spectrometer (Shimadzu, Japan).
Synthesis of fluorescent PDA NPs
The synthesis of fluorescent PDA NPs was carried out according to the reported methods with slight modification.31,43 Firstly, the fluorescent PDA NPs were formed by oxidative polymerization via the addition of an aqueous solution of dopamine hydrochloride (40 mM, 200 μL) and sodium hydroxide solution (100 mM, 320 μL) into phosphate buffer (PB) (2 mM, pH 7.4, 7.08 mL) under magnetic stirring for 1 h at room temperature. Thereafter, hydrochloric acid (0.2 M, 400 μL) was introduced with stirring for an additional 30 min to sharply reduce the polymerization speed. For purification, the prepared PDA NPs solution was centrifuged for 30 minutes at 12![[thin space (1/6-em)]](https://www.rsc.org/images/entities/char_2009.gif) 000 rpm to remove large nonfluorescent PDA NPs. The obtained supernatant was stored at 4 °C for future use.
000 rpm to remove large nonfluorescent PDA NPs. The obtained supernatant was stored at 4 °C for future use.
Hg2+ and AA detection in aqueous solution and real samples
For Hg2+ detection, varying concentrations of Hg2+ were added into the solution containing 50 μL of PB (pH 7.0, 2 mM) solution and 10 μL as-prepared fluorescent PDA NPs, and enough sterilized water was added into the mixture to adjust the final volume to 100 μL. After mixing, the reaction proceeded at room temperature for 30 min. And then, the solution was subjected to fluorescence measurements.For AA detection, varying concentrations of AA and 20 μM Hg2+ were added into the solution containing 50 μL of PB (pH 7.0, 2 mM) solution and 10 μL of the as-prepared fluorescent PDA NPs, and enough sterilized water was added into the mixture to adjust the final volume to 100 μL. After mixing, the reaction was allowed to proceed at room temperature for 15 min, and was then subjected to fluorescence measurements.
The practicality of the sensor for Hg2+ detection was demonstrated in tap water, lake water and diluted human serum samples, and for AA detection was demonstrated in diluted human serum samples. A standard addition recovery method was used for evaluating the feasibility of the fluorescent PDA NPs for Hg2+ and AA detection in real samples. In particular, a 20-fold diluted human serum sample was firstly treated with NEM (1.0 mM) and incubated for 30 min to eliminate any interference from sulfhydryl compounds including Cys, Hcy, GSH and Na2S (using as H2S donor) before testing.
Results and discussion
Synthesis and characterization of the fluorescent PDA NPs
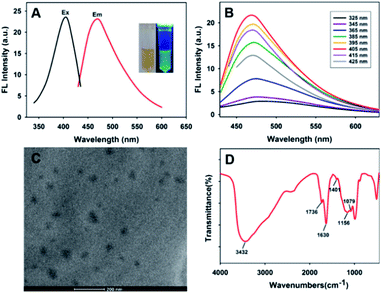
The fluorescent PDA NPs were easily synthesized by oxidation and polymerization of dopamine molecules under basic conditions with stirring. The solution was acidified by adding hydrochloric acid to lower the polymerization speed and then fluorescent PDA NPs formed.43 Fig. 1A showed that the excitation wavelength of the fluorescent PDA NPs was at around 405 nm and the emission intensity reached a maximum at around 468 nm. Apparently, Fig. 1B showed that the emission peak of PDA NPs was excitation-independent, and the excitation wavelength at 405 nm gave the maximum fluorescence output. Fig. S1† shows that the fluorescence signal of the PDA NPs has no obvious decrease within seven days and under continuous irradiation with 405 nm light, revealing the outstanding photostability of the formed PDA NPs and the potential for analysis application.The size and shape of the formed PDA NPs were characterized by TEM. Fig. 1C shows that the PDA NPs were monodispersed and irregular shaped with diameters in the range of 20–60 nm. Compositional analysis of the formed PDA NPs by EDS exhibited the signals of the C, N and O elements (Fig. S2†). Finally, FT-IR spectroscopy was used to determine the surface chemical groups of the PDA NPs. As shown in Fig. 1D, the strong and broad band located at 3432 cm−1 was attributable to the presence of N–H bond and phenolic O–H bond stretching vibrations, the peak appeared at 1401 cm−1 corresponded to the bending vibrations of O–H bonds, and the peak located at 1630 cm−1 was assigned to the presence of N–H bond bending vibrations and C![[double bond, length as m-dash]](https://www.rsc.org/images/entities/char_e001.gif) C bond stretching vibrations. The peak at 1736 cm−1 was ascribed to C
C bond stretching vibrations. The peak at 1736 cm−1 was ascribed to C![[double bond, length as m-dash]](https://www.rsc.org/images/entities/char_e001.gif) O bonds, the peak at around 1156 cm−1 corresponded to the stretching vibration of C–N bonds, and the peak located at around 1079 cm−1 was attributable to the stretching vibrations of C–O bonds. The results proved the existence of a number of ketone and hydrophilic groups (catechol, amine, imine) on the surface of the formed PDA NPs, which not only resulted in their excellent water solubility but also provided a platform for metal ion coordination. The water solubility of PDA NPs in water was calculated to be 18.312 mg mL−1, which was determined by dissolving excess lyophilized PDA NPs in deionized water. The exhibited water solubility makes it an attractive candidate for sensing applications in solution.
O bonds, the peak at around 1156 cm−1 corresponded to the stretching vibration of C–N bonds, and the peak located at around 1079 cm−1 was attributable to the stretching vibrations of C–O bonds. The results proved the existence of a number of ketone and hydrophilic groups (catechol, amine, imine) on the surface of the formed PDA NPs, which not only resulted in their excellent water solubility but also provided a platform for metal ion coordination. The water solubility of PDA NPs in water was calculated to be 18.312 mg mL−1, which was determined by dissolving excess lyophilized PDA NPs in deionized water. The exhibited water solubility makes it an attractive candidate for sensing applications in solution.
Feasibility analysis of the sensing system for Hg2+ and AA detection
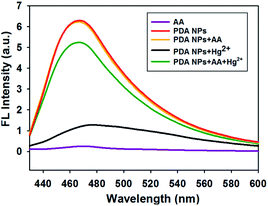
The feasibility of the proposed strategy was verified using fluorescence and UV-vis absorption spectroscopic measurements. Fig. 2 shows that the fluorescence signal of the PDA NPs decreased dramatically in the presence of Hg2+ (black line). However, the fluorescence signal of the PDA NPs greatly increased upon the addition of AA (green line), which was comparable to the fluorescence intensity of the PDA NPs (red line) or PDA NPs with AA (orange line), suggesting that Hg2+ effectively quenched the fluorescence of the PDA NPs and AA successfully recovered the fluorescence signal of the system via a redox reaction between the AA and Hg2+. UV-vis absorption spectra of the system were also measured, where Fig. S3† shows that the absorption peak shifted remarkably to 286 nm in the presence of Hg2+ (blue line). In contrast, when AA and Hg2+ coexisted in the solution, the absorption peak was observed at 280 nm (green line), which was the same as the absorption peak of the system without Hg2+ (red line). Furthermore, zeta potential measurements revealed the changes in the surface charge of the PDA NPs. Fig. S4† shows that the coordination of Hg2+ significantly shifted the zeta potential from −46.17 to −33.63 mV, and after AA was added to the system, the zeta potential shifted to −41.23 mV again. The above results gave clear evidence for the feasibility of the system.Mechanism of Hg2+-induced fluorescence quenching toward the PDA NPs
The fluorescence quenching process occurs primarily via static and dynamic modes. The static mode involves the formation of a nonfluorescent complex via a reaction between a fluorescence molecule in the ground state and a quencher, accompanied by fluorescence intensity decreases but the excited-state fluorescence lifetime of the fluorophore does not change. On the contrary, the dynamic mode involves a collision between the excited fluorescence molecule and the quencher, which leads to an excited-state fluorescence lifetime change of the fluorophore.44–47 The Hg2+-induced fluorescence quenching mechanism toward the PDA NPs was further investigated via fluorescence decay curves. Fig. 3 shows that the fluorescence lifetime of PDA NPs in the absence of Hg2+ fitted well with a monoexponential function, and the fluorescence life time of the PDA NPs was calculated to be 4.36 ns. Interestingly, in the presence of Hg2+, the fluorescence lifetime of the PDA NPs was well fitted with a biexponential function, consisting of a short lifetime component of τ1 = 0.75 ns (49.17%) and a long lifetime component of τ2 = 4.49 ns (50.83%). The significantly decreased fluorescence lifetime of τ1 might result from the occurrence of charge transfer from the PDA NPs to Hg2+, which led to the quenching of the fluorescence and proved the existence of dynamic quenching. The unaffected fluorescence life time of τ2 might be due to the formation of a non-fluorescent complex between Hg2+ and the PDA NPs, which confirmed the mode of static quenching. The results validated the fluorescence quenching of the PDA NPs by Hg2+ was a combination of static and dynamic quenching processes.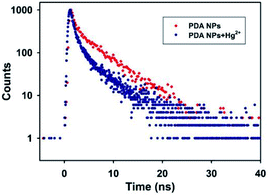 | ||
| Fig. 3 Fluorescence decay curves of the PDA NPs in the absence and presence of Hg2+ with the emission monitored at 468 nm and excitation at 375 nm. | ||
Demonstration of the redox reaction between AA and Hg2+
With regard to the demonstration of the redox reaction between the AA and Hg2+, XPS spectral analysis was carried out on the surfaces of the PDA NP samples. Fig. 4A shows the survey spectrum that contains C 1s, N 1s, O 1s, and Hg 4f peaks. The high-resolution Hg 4f spectrum (Fig. 4B) shows two peaks located at 101.2 eV for Hg 4f7/2 and 105.2 eV for Hg 4f5/2. The location of the peaks is characteristic of Hg2+.48 In contrast, the presence of the AA in the system resulted in Hg2+ reduction to Hg0, which was not coordinated by the PDA NPs. When analyzing PDA NPs treated with Hg2+ in the presence of AA, the peaks for Hg 4f disappeared in both the survey (Fig. 4C) and high-resolution (Fig. 4D) Hg 4f spectra. The results indicated the occurrence of the redox reaction of Hg2+ being reduced to Hg0 by AA, as was previously reported.49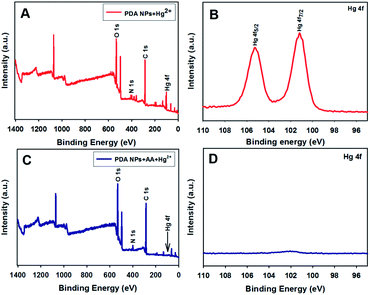 | ||
| Fig. 4 XPS analysis and high-resolution XPS spectra of Hg2+ on the surface of the PDA NPs in the absence (A and B) and presence of AA (C and D). | ||
Optimization of the experimental conditions
Before investigating the detection behavior of the sensing system, several experimental parameters, including the acidity (pH) of the solution and reaction time for Hg2+ detection, and the adding order of the chemicals and reaction time for AA detection were investigated to systematically optimize the experimental conditions of the detection method.To realize the fast and highly sensitive detection of Hg2+, the reaction time of the system for Hg2+ detection was investigated. Fig. S5C† shows that the fluorescence intensity of the PDA NPs decreased sharply when the reaction time was varied from 0 to 30 min, and then remained unchanged after 30 min. Thus, 30 min was used for the subsequent experiments.
To realize the rapid detection of AA, the reaction time of the system for AA detection was also investigated. Fig. S6B† shows that the fluorescence intensity of the PDA NPs increased rapidly when the reaction time varied from 0 to 15 min, and then leveled off at 15 min. Thus, 15 min was used for subsequent experiments.
Detection procedure
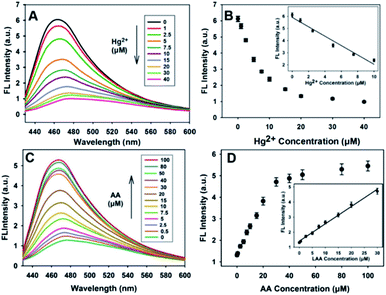
The fluorescence responses of the nanosensor to Hg2+ and AA in buffer solutions were investigated under the optimal experimental conditions. Fig. 5A shows that the fluorescence intensity of the PDA NPs decreased sharply when the concentration of Hg2+ increased from 0 to 10 μM, and then became sluggish even when the concentration of Hg2+ was increased beyond 10 μM. Good linearity between the relative fluorescence intensity and the concentration of Hg2+ (0–10 μM) was obtained (R2 = 0.9801), as shown in Fig. 5B, and the detection limit was found to be 0.19 μM based on the 3σ rule. Fig. 5C shows the fluorescence spectral responses of the sensor with different concentrations of AA. As expected, the fluorescence intensity correlated well upon increasing the concentration of AA (0–100 μM). The fluorescence intensity apparently increased, which was as a result of the redox reaction between the AA and Hg2+. Fig. 5D shows that there is good linearity between the relative fluorescence intensity and the concentration of AA up to a concentration of 30 μM was reached (R2 = 0.9934). The detection limit was found to be 0.4 μM based on the 3σ rule. The detection results for Hg2+ and AA were better than or comparable to the results in previous reports (Table S1†), demonstrating that the developed sensor has many obvious advantages, for instance, simplicity, rapid implementation and high sensitivity for Hg2+ and AA detection.Selectivity of the proposed sensor
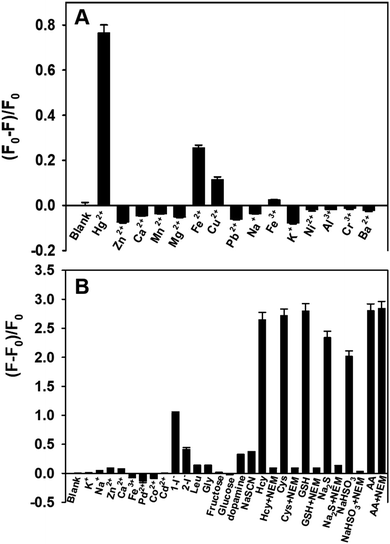
The selectivity of the proposed method for Hg2+ and AA detection was evaluated in the presence of a variety of possible interferences. Fig. 6A shows that when the fluorescent PDA NPs were incubated with Hg2+, Cu2+ and Fe2+, the fluorescence intensity diminished compared with the other metal ions. While Fe2+ and Cu2+ ions influence the mercury detection of the PDA NPs, these inputs can in the future be separated using a logic gate concept.50,51 Also, Fig. 6B shows that significant fluorescence intensity enhancements were conspicuously observed in the presence of Hcy, Cys, GSH, NaHSO3, Na2S and AA, while other interfering species showed slight changes, even at higher concentration. Fortunately, the interferences from Hcy, Cys, GSH, NaHSO3 and Na2S could be effectively eliminated by NEM, a specific scavenger that forms stable thioether bonds with sulfhydryl compounds, whereas the fluorescence intensity of the PDA NPs for AA detection was essentially unchanged after the introduction of NEM. Notably, I− caused a slight fluorescence increase when the concentration was 100 μM, but it could be minimized by changing order in which the chemicals were added. In addition, the fluorescence signals caused by dopamine and NaSCN were nearly negligible when the concentrations of them were the same as AA. The results fully indicated the high selectivity of the nanosensor for Hg2+ and AA detection.Analysis of Hg2+ and AA in real samples
The practical utility of the nanosensor for Hg2+ and AA detection in complex media was demonstrated in real samples (tap water, lake water and diluted human serum samples). With four different concentrations of Hg2+ spiked into tap water, lake water and the diluted human serum samples respectively, recoveries of between 93.4% and 107.5% were obtained with RSDs below 6.8% (Table S2†). Diluted human serum samples were selected as biological media to assess the practicality of the sensor for AA detection. Fig. S7† shows that the fluorescence intensity of the PDA NPs enhanced progressively as the AA concentration increased and a linear response to AA ranging from 0–20 μM was observed. In terms of the calibration curve of the serum, four serum samples with different concentrations of AA were prepared and measured, and satisfactory recoveries of between 95.6% and 102.8% were obtained with RSDs of around 5% (Table S3†). The results demonstrated that the developed strategy has potential practicability for Hg2+ and AA detection in real samples.Conclusions
In summary, the rationale of a simple, rapid and sensitive nanosensor using fluorescent PDA NPs for the sequential detection of Hg2+ and AA has been demonstrated. The sensor was constructed mainly based on a Hg2+-induced fluorescence quenching effect toward PDA NPs through an intense coordination interaction between Hg2+ and the groups on the surface of the PDA NPs, and AA-triggered induced fluorescence recovery of the PDA NPs via a redox reaction between Hg2+ and AA. By employing the fluorescent PDA NPs as signal readout molecules, the nanosensor exhibited high sensitivity and desirable selectivity. Moreover, the method showed potential applications for Hg2+ and AA detection, with satisfactory recoveries in real samples, which may provide new insight for applications in environmental analysis and biological detection diagnosis.Conflicts of interest
There are no conflicts to declare.Acknowledgements
We gratefully acknowledge the support from the NNSF of China (No. 21705068 and 21676131), the Fundamental Research Funds for Promotion Project of Jiangxi Science and Technology Normal University (2018BSQD024), and the Natural Science Foundation of Jiangxi Province (20143ACB20012 and 20192BAB213015).Notes and references
- S. A. El-Safty and M. A. Shenashen, TrAC, Trends Anal. Chem., 2012, 38, 98–115 CrossRef CAS.
- F. Zahir, S. J. Rizwi, S. K. Haq and R. H. Khan, Environ. Toxicol. Pharmacol., 2005, 20, 351–360 CrossRef CAS PubMed.
- K. A. Naidu, Nutr. J., 2003, 2, 7–16 CrossRef PubMed.
- O. Arrigon and M. C. De Tullio, Biochim. Biophys. Acta, 2002, 1569, 1–9 CrossRef.
- B. Halliwell, Annu. Rev. Nutr., 1996, 16, 33–50 CrossRef CAS PubMed.
- O. Blokhina, E. Virolainen and K. Fagerstedt, Ann. Bot., 2003, 91, 179–194 CrossRef CAS PubMed.
- N. Li, Y. Li, Y. Han, W. Pan, T. Zhang and B. Tang, Anal. Chem., 2014, 86, 3924–3930 CrossRef CAS PubMed.
- L. K. Massey, M. Liebman and S. A. Kynast-Gales, J. Nutr., 2005, 135, 1673–1677 CrossRef CAS PubMed.
- S. G. Liu, D. Luo, L. Han, N. B. Li and H. Q. Luo, Microchim. Acta, 2019, 186, 156–163 CrossRef PubMed.
- X. Jiang, H. Wang, H. Wang, R. Yuan and Y. Chai, Anal. Chem., 2016, 88, 9243–9250 CrossRef CAS PubMed.
- M. Zhang, K. Liu, L. Xiang, Y. Lin, L. Su and L. Mao, Anal. Chem., 2007, 79, 6559–6565 CrossRef CAS PubMed.
- Q. Li, J. Wang and Y. He, Sens. Actuators, B, 2016, 231, 64–69 CrossRef CAS.
- S. Zhao, Y. Huang and Y. M. Liu, J. Chromatogr. A, 2009, 1216, 6746–6751 CrossRef CAS PubMed.
- Y. S. Ho and P. C. Uden, J. Chromatogr. A, 1994, 688, 107–116 CrossRef CAS.
- Y. Wei, Z. Zhang, Y. Zhang and Y. Sun, Chromatographia, 2007, 65, 443–446 CrossRef CAS.
- X. Liu, Z. Wu, Q. Zhang, W. Zhao, C. Zong and H. Gai, Anal. Chem., 2016, 88, 2119–2124 CrossRef CAS PubMed.
- T. Wu, W. Hou, Z. Ma, M. Liu, X. Liu, Y. Zhang and S. Yao, Microchim. Acta, 2019, 186, 123–129 CrossRef PubMed.
- W. Gu, X. Pei, Y. Cheng, C. Zhang, J. Zhang, Y. Yan, C. Ding and Y. Xian, ACS Sens., 2017, 2, 576–582 CrossRef CAS PubMed.
- X. Zhang, Z. Dai, S. Si, X. Zhang, W. Wu, H. Deng, F. Wang, X. Xiao and C. Jiang, Small, 2017, 13, 1603347–1603353 CrossRef.
- H. M. Meng, X. B. Zhang, C. Yang, H. Kuai, G. J. Mao, L. Gong, W. Zhang, S. Feng and J. Chang, Anal. Chem., 2016, 88, 6057–6063 CrossRef CAS PubMed.
- H. Chen, Y. Liu, H. Li, Y. Zhang and S. Yao, Sens. Actuators, B, 2019, 281, 983–988 CrossRef CAS.
- W. Xu, J. Chen, S. Sun, Z. Tang, K. Jiang, L. Song, Y. Wang, C. Liu and H. Lin, Nanoscale, 2018, 10, 17834–17841 RSC.
- J. Yu, W. Yang, S. Xing, J. Wang, H. Han and P. Zhang, Microchim. Acta, 2019, 186, 89–97 CrossRef PubMed.
- H. Liu, W. Na, Z. Liu, X. Chen and X. Su, Biosens. Bioelectron., 2017, 92, 229–233 CrossRef CAS PubMed.
- H. B. Wang, Y. Li, H. Y. Bai and Y. M. Liu, Sens. Actuators, B, 2018, 259, 204–210 CrossRef CAS.
- A. N. Vijayan, Z. Liu, H. Zhao and P. Zhang, Anal. Chim. Acta, 2019, 1072, 75–80 CrossRef CAS PubMed.
- Y. Cen, J. Tang, X. J. Kong, S. Wu, J. Yuan, R. Q. Yu and X. Chu, Nanoscale, 2015, 7, 13951–13957 RSC.
- D. Wang, C. Chen, X. Ke, N. Kang, Y. Shen, Y. Liu, X. Zhou, H. Wang, C. Chen and L. Ren, ACS Appl. Mater. Interfaces, 2015, 7, 3030–3040 CrossRef CAS PubMed.
- L. Li, C. Wang, K. Liu, Y. Wang, K. Liu and Y. Lin, Anal. Chem., 2015, 87, 3404–3411 CrossRef CAS PubMed.
- X. Zhu, T. Zhao, Z. Nie, Y. Liu and S. Yao, Anal. Chem., 2015, 87, 8524–8530 CrossRef CAS PubMed.
- L. L. Feng, Y. X. Wu, D. L. Zhang, X. X. Hu, J. Zhang, P. Wang, Z. L. Song, X. B. Zhang and W. Tan, Anal. Chem., 2017, 89, 4077–4084 CrossRef CAS PubMed.
- P. Zhao, K. He, Y. Han, Z. Zhang, M. Yu, H. Wang, Y. Huang, Z. Nie and S. Yao, Anal. Chem., 2015, 87, 9998–10005 CrossRef CAS PubMed.
- D. Yue, D. Zhao, J. Zhang, L. Zhang, K. Jiang, X. Zhang, Y. Cui, Y. Yang, B. Chen and G. Qian, Chem. Commun., 2017, 53, 11221–11224 RSC.
- B. Chen, J. Ma, T. Yang, L. Chen, P. F. Gao and C. Z. Huang, Biosens. Bioelectron., 2017, 98, 36–40 CrossRef CAS PubMed.
- Y. Liu, K. Ai and L. Lu, Chem. Rev., 2014, 114, 5057–5115 CrossRef CAS PubMed.
- B. Xiong, Y. Chen, Y. Shu, B. Shen, H. N. Chan, Y. Chen, J. Zhou and H. Wu, Chem. Commun., 2014, 50, 13578–13580 RSC.
- Q. Ci, J. Liu, X. Qin, L. Han, H. Li, H. Yu, K. L. Lim, C. W. Zhang, L. Li and W. Huang, ACS Appl. Mater. Interfaces, 2018, 10, 35760–35769 CrossRef CAS PubMed.
- H. Yin, K. Zhang, L. Wang, K. Zhou, J. Zeng, D. Gao, Z. Xia and Q. Fu, Nanoscale, 2018, 10, 18064–18073 RSC.
- X. J. Kong, S. Wu, T. T. Chen, R. Q. Yu and X. Chu, Nanoscale, 2016, 8, 15604–15610 RSC.
- T. Xiao, J. Sun, J. Zhao, S. Wang, G. Liu and X. Yang, ACS Appl. Mater. Interfaces, 2018, 10, 6560–6569 CrossRef CAS.
- Y. Liu, M. Yang, J. Li, W. Zhang and X. Jiang, Anal. Chem., 2019, 91, 6754–6760 CAS.
- X. X. Wang, J. M. Liu, S. L. Jiang, L. Jiao, L. P. Lin and M. L. Cui, Sens. Actuators, B, 2013, 182, 205–210 CrossRef CAS.
- T. An, N. Lee, H. J. Cho, S. Kim, D. S. Shin and S. M. Lee, RSC Adv., 2017, 7, 30582–30587 RSC.
- S. Sharma, R. Uttam, A. S. Bharti and K. N. Uttam, Anal. Lett., 2019, 52, 1539–1557 CrossRef CAS.
- A. Sharma, J. Enderlein and M. Kumbhakar, J. Phys. Chem. Lett., 2017, 8, 5821–5826 CrossRef CAS PubMed.
- D. Su, M. Wang, Q. Liu, Z. Qu and X. Su, New J. Chem., 2018, 42, 17083–17090 RSC.
- C. B. Ke, T. L. Lu and J. L. Chen, Microchim. Acta, 2019, 86, 376–383 CrossRef.
- J. G. Egan, A. J. Hynes, H. M. Fruehwald, I. I. Ebralidze, S. D. King, R. A. M. Esfahani, F. Y. Naumkin, E. B. Easton and O. V. Zenkina, J. Mater. Chem. C, 2019, 7, 10187–10195 RSC.
- R. Sanehi, R. M. Mehrotra and S. P. Mushran, J. Inorg. Nucl. Chem., 1975, 37, 1753–1755 CrossRef.
- Q. Zou, X. Li, T. Xue, J. Zheng and Q. Su, Talanta, 2019, 195, 497–505 CrossRef CAS PubMed.
- N. O. Laschuk, I. I. Ebralidze, D. Spasyuk and O. V. Zenkina, Eur. J. Inorg. Chem., 2016, 3530–3535 CrossRef CAS.
Footnotes |
| † Electronic supplementary information (ESI) available: Experimental details and additional information. See DOI: 10.1039/d0ra02031a |
| ‡ These authors contributed equally to this work. |
| This journal is © The Royal Society of Chemistry 2020 |

