
 Open Access Article
 This Open Access Article is licensed under a Creative Commons Attribution-Non Commercial 3.0 Unported Licence
Mechanism analysis of Au, Ru noble metal clusters modified on TiO2 (101) to intensify overall photocatalytic water splitting
Libin Yang *a,
Peng Gaoa,
Jinghao Lua,
Wei Guoa,
Zhuang Zhuangb,
Qingqing Wanga,
Wenjing Lia and
Zhiying Fenga
*a,
Peng Gaoa,
Jinghao Lua,
Wei Guoa,
Zhuang Zhuangb,
Qingqing Wanga,
Wenjing Lia and
Zhiying Fenga
aCollege of Chemical Engineering and Materials Science, Tianjin Key Laboratory of Brine Chemical Engineering and Resource Eco-utilization, Tianjin University of Science and Technology, Tianjin 300457, China. E-mail: yanglibin@tust.edu.cn
bInstitute of Coal Chemical Industry Technology, CHN Energy Ningxia Coal Industry Group Co. Ltd., Yinchuan, Ningxia 750411, China
First published on 1st June 2020
Abstract
Accelerating the separation and migration of photo-carriers (electron–hole pairs) to improve the photo-quantum utilization efficiency in photocatalytic overall water splitting is highly desirable. Herein, the photo-deposition of Ru or Au noble metal clusters with superior electronic properties as a co-catalyst on the (101) facet of anatase TiO2 and the mechanism of intensifying the photocatalysis have been investigated by calculation based density functional theory (DFT). As a result, the as-synthesized Ru/TiO2 and Au/TiO2 exhibit high hydrogen evolution reaction (HER) activity. Such a greatly enhanced HER is attributed to the interfacial interactivity of the catalysts due to the existence of robust chemical bonds (Ru–O–Ti, Au–O–Ti) as electron-traps that provide the photogenerated electrons. In addition, the formation of new degenerate energy levels due to the existence of Ru-4d and Au-5d electronic impurity states leads to the narrowing of the band gap of the catalysts. In addition, the as-synthesized Au/TiO2 exhibits more faster HER rate than Ru/TiO2, which is attributed to the effects of surface plasmon resonance (SPR) as a synergistic effect of plasmon-induced ‘hot’ electrons that enhance the harvesting of the final built-in electric field and promote the migration and separation of the photo-carriers, which efficiently facilitates hydrogen evolution from the photocatalytic overall water splitting reaction.
1. Introduction
As both global energy consumption and concerns over environmental contamination continue to increase, it is imperative to develop renewable energy resources that neither rely on fossil fuels nor emit carbon dioxide. Solar energy has attracted much interest as one such sustainable and clean energy. Further, it is very promising to use particulate semiconductors in photocatalytic overall water splitting (OWS) to convert solar energy into clean and efficient hydrogen energy.1–4 However, it should be noted that the absorption of sunlight by particulate semiconductors is low and only 5% of the ultraviolet region of sunlight can be absorbed.5 Furthermore, it is supposed that the future photocatalytic systems will have a solar-to-hydrogen (STH) conversion efficiency of 10%, which is far higher than the values currently obtained in small-scale trials that are typically about 1%.6 To improve the utilization of solar energy, various particulate photocatalysts in overall water splitting and modified semiconductor materials have been investigated.7–11 The main approach is to design the band structure, to control the migration of photo-carriers, and to intensify the surface reaction on the photocatalysts with suitable optical absorption, fast mobility of the photo-carriers, and efficient surface reaction, by compositional tuning and modified semiconductors, such as semiconductor coupling, ion doping or metal adsorption, and dye sensitization.12–15 For example, Can Li et al. modified Pt/PdS co-catalysts on the surface of CdS and achieved a high apparent quantum yield (AQY) of 93% for the hydrogen evolution reaction.16 Ag-based nanocomposites have been applied as photocatalysts with high activity, such as prepared Ag/g-C3N4 nanofibers that enhanced the separation capability of photoinduced electron–hole pairs.17 Besides, iridium complexes have been explored as active photosensitizers (PSs) that increase the AQY due to the absorption of visible light, leading to charge-separation and long-lived excitation for hydrogen evolution reaction.18–20 Despite this high AQY, the STH is only ∼1%, which is still far from reaching the minimum demand for industrialization. It is necessary to search for effective strategies to improve the STH efficiency of semiconductor-based catalysts.In the photocatalytic OWS to produce hydrogen, the band structure of the semiconductor as the photocatalyst for sunlight absorption is critical. Titanium dioxide (TiO2) is one kind of an important oxide that finds extensive application in the field of photocatalysis,21,22 photovoltaics,23,24 pigments,25 and hydrogen production,26–29 due to its favourable properties including non-toxicity, chemical stability, and low cost.30–32 As mentioned before, the performance in the hydrogen evolution reaction depends on the band structure of TiO2, which is a wide band-gap of 3.2 eV and 3.0 eV for anatase and rutile, respectively.33 For hydrogen evolution, a wide band-gap semiconductor can only absorb ultraviolet (UV) radiation. In addition, the photo-carriers obtained from light radiation, i.e., electrons (e−) and holes (h+) cannot rapidly migrate to the surface of TiO2 for photocatalytic reaction and some electrons (e−) and holes (h+) recombine in the bulk. Furthermore, hydrogen evolution reaction (HER) on the surface of the semiconductor has been accompanied by oxygen reduction reaction (ORR), which is the reverse of the overall water splitting reaction. These are the three main reasons for the low efficiency of STH and AQY based on the TiO2 photocatalysts. In order to overcome these shortcomings, numerous attempts have been made with respect to change in the band structure of TiO2, such as metal adsorption34–36 and modification of the surface.37
The co-catalyst is important in integrated OWS systems as it provides active sites on the surface of the photocatalysts and protects the photocatalyst surface from being oxidized by the holes.12 Co-catalyst components typically tend to overlap with the components of the electrocatalysts38,39 and metal or metal oxide nanoparticles dispersed on the surface of the semiconductor particles are frequently used as co-catalysts.34,40,41 In addition, composite material based co-catalyst are of great interest in many fields, such as HER, CO, and NOx oxidation.42 A typical example is the combination of Pt43 and TiO2, which is catalytically active and promotes H2 evolution. The bi-functional effect on the alloyed interface sites of Cu-based bimetallic supported CeO2 showed excellent activity including the Cu–Pt44,45 and Cu–Rh44 catalysts for CO oxidation. Graphene nanoplatelets were found to have eminent optical and electrical properties as co-catalysts,46 such as graphene/g-C3N4 composites as photocatalyst that achieved AQY for HER.47 The conversion efficiency of bimetallic Pt–Rh supported ceria–zirconia–alumina (CZA) reached near 100% for NOx and CO oxidation.48 The FeMnTiOx-based co-catalyst with deposited tourmaline by the sol–gel method was highly efficient in NO oxidation.49 The enhancement in the mechanical property of the cis-polybutadiene nanocomposite was achieved by the addition of palygorskite nanofibers modified with the mercaptosilane coupling agent and HTPB.50 However, this mechanism has not been deduced and these electro-catalysts are not directly applicable as OWS photocatalysts. It may be because the catalysts are usable in an irreversible electrolysis system but are not effective in the form of a particulate photocatalyst based on a reversible process.
In 2008, nano-silver was adsorbed on the surface of TiO2 and significantly improved the photocatalytic degradation activity of TiO2 under UV illumination.51 Noble metals with surface plasmon resonance (SPR) effect (such as Au,52 Ag53) were applied to photocatalysis. It was found that the introduced nano-gold could improve the hydrogen evolution under visible light irradiation when nano-gold and platinum were loaded on the surface of WO3.54 These works suggest that the enhanced mechanism of photocatalysis due to SPR effect is electromagnetic near field enhanced by metals that promote the migration of photo-carriers so as to benefit the photocatalytic reaction. Except for the SPR effect, the induced metals onto the semiconductor photocatalysts as the co-catalyst could aggregate the photogenerated electrons to inhibit the recombination of photogenerated carriers. The synergistic effect of the co-catalyst has not been indentified. Remarkably, it is noteworthy that the interaction of the metal–semiconductor not only helps to stabilize the fine adsorption of the nanometals on the semiconductor but also dramatically affects the electronic structures and optical properties of the semiconductor.55
In the present work, we prepared Au, Ru nano-clusters on the (101) facet of anatase TiO2 as the co-catalyst and investigated the photocatalytic activity of overall water splitting. The enhancement mechanism of photocatalytic activity was analysed from the molecular scale by experiments and density functional theory (DFT) calculations.
2. Experimental section
2.1. Experimental details
![[thin space (1/6-em)]](https://www.rsc.org/images/entities/char_2009.gif) 000 rpm for 10 min and washing several times with a mixture of ethanol and deionized water. After that, the product was dried in air at 120 °C for 3 h.
000 rpm for 10 min and washing several times with a mixture of ethanol and deionized water. After that, the product was dried in air at 120 °C for 3 h.2.2. Computational methods and models
All the calculations of the molecular and electronic structures for the photocatalysts were based on density functional theory (DFT) with the exchange–correlation functional at the generalized gradient approximation (GGA) level parameterized by Perdew–Burke–Ernzerhof (PBE),57 as implemented in the Cambridge Serial Total Energy Package (CASTEP) codes,58 combined with ultrasoft pseudopotentials (USPP).59 The calculations were converged at a cut-off energy of 400 eV for the plane wave basis set while the Brillouin zone (BZ) integrals were approximated using the special k-point girds with a mesh of 3 × 3 × 2 for geometry optimization and calculations of electronic properties, and the minimization algorithm was the Broyden–Fletcher–Goldfarb–Shanno (BFGS) scheme.60 With a view to avoid the error of underestimating the band gap of the GGA method, the electronic structure calculations were conducted using the GGA + U method46 in conjunction with GGA, which could produce a good band gap for TiO2 in comparison with the experimental results.61 In this research, the effective on-site coulombic interaction U for Ti-3d was set to 2.5 eV; it was verified that the calculated band gap of primitive TiO2 is 3.2 eV, which is the same as the experimental value of 3.2 eV.62 The convergence criteria for structure optimization and electronic properties were set as follows: (1) the maximal force on the atoms was 0.01 eV Å−1; (2) the maximal atomic displacement was 2 × 10⁻³ Å; (3) the maximal energy change per atom was 2 × 10⁻⁵ eV.The primitive structure of anatase TiO2 was built according to a previous experimental work.63 The facet (101) of anatase TiO2 was simulated as a periodic (3 × 4) slab with a thickness of four O–Ti–O layers and with a 10 Å vacuum layer (Fig. 1). It has been proved that the periodic (3 × 4) slab is large enough to reduce the interactions between the neighbouring adsorbed metal clusters and to fully release the interfacial strain energy.62 For geometry optimization of the A facet (101), the bottom two layers of the O–Ti–O atomic layers in the slab were constrained to their crystal lattice position but the upper two atomic layers were relaxed.
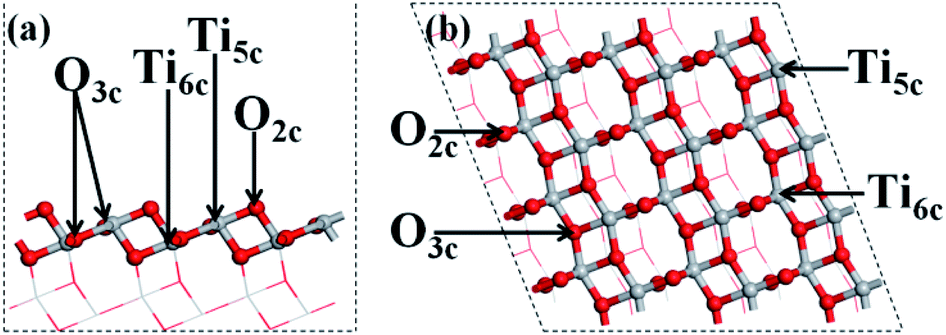 | ||
| Fig. 1 Model of the structure. (a) Side and (b) top view of the (101) facet of anatase TiO2. | ||
The structures of the adsorbed Ru or Au clusters on the anatase TiO2 (101) facet were modelled and the optimized adsorption configurations are given in Fig. 2. In the adsorption configuration, ten of the Ru or Au atoms were adsorbed on the anatase TiO2 (101) facet. Specifically, the configurations consist of three layers of adsorbed atoms. Seven atoms were adsorbed between four O2c and three O3c, Ti5c on the interface of M (Ru or Au noble metal)/TiO2 (101) facet and formed M-O, M-Ti bonds, which were attached to the bottom and sublayers of the interface. For the surface layer, the metal atoms were adsorbed on the metal atoms of the sublayers (shown in Fig. 2).
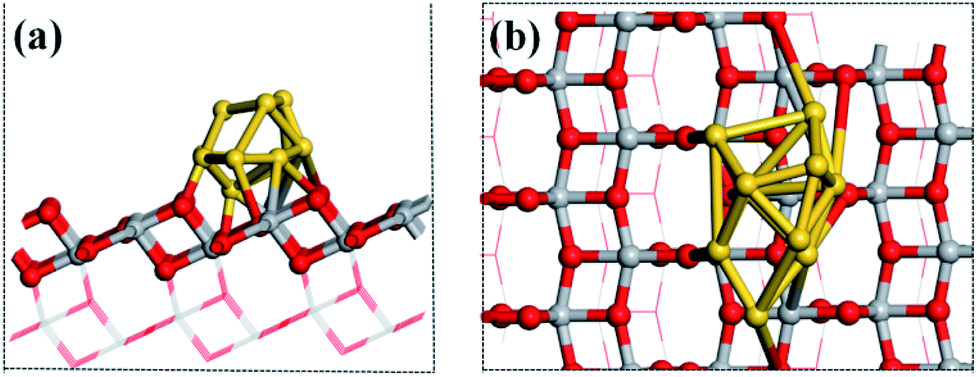 | ||
| Fig. 2 (a) Side and (b) top view of the structural model of the metal atoms adsorbed on TiO2 (101). Gray, red, and gold spheres represent the Ti, O, and metal atoms, respectively. | ||
3. Results and discussion
3.1. Microstructure characterization
The X-ray diffraction (XRD) patterns were recorded to ascertain the crystalline structure of all the samples. As is shown in Fig. 3a, the XRD patterns of the samples present the anatase phase, which has the cell parameters a = b = 3.7852 Å and c = 9.5139 Å corresponding to the space group D194h-I41/amd (JCPDS No. 21-1272). Furthermore, it must be mentioned that the diffraction of the strongest peak for the (101) facet indicates that the as-synthesized samples are present in pure anatase phase and predominantly the (101) facet. The crystallinity can be calculated from the integrated areas of the main peaks of the anatase facet (101); the average crystallite size, referred to as the crystal size, was calculated by the Scherrer equation.64 The crystallite size and contribution of anatase was calculated to be about 8.3 nm and 84.18%, respectively (Table 1), based on the full width at half maximum and integrated areas of the (101) facet peaks. However, no clear peaks of Ru nanoparticles can be observed upon the adsorption of Ru nanoparticles on the (101) facet of anatase TiO2. The absence of characteristic peaks for Ru may be attributed to the low content (0.71 wt%) (Table 1) and high-dispersion of the Ru flakes in the bulk of anatase TiO2. A similar phenomenon was also observed for the Au/TiO2 samples. Fig. 3b shows the energy dispersive X-ray spectroscopic (EDS) information for the Ru, Au energy peaks of the Ru, Au/TiO2 samples, which further confirmed that the Ru, Au nanoparticles clusters were successfully synthesized by the photoreduction method.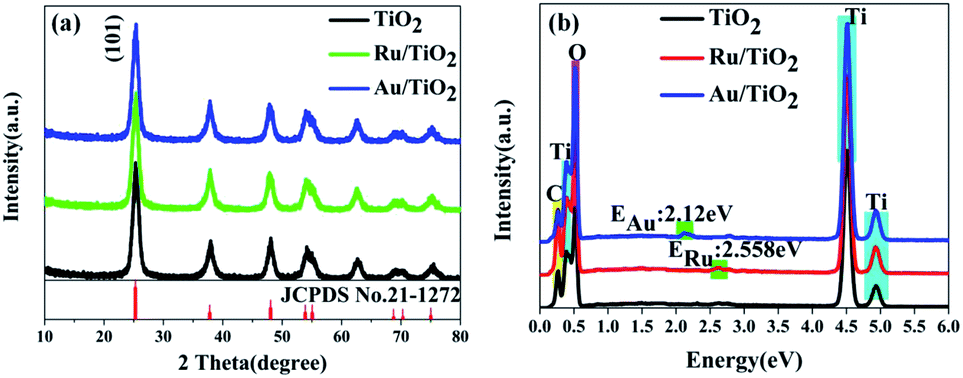 | ||
| Fig. 3 (a and b) XRD patterns and energy dispersive X-ray spectra (EDS). | ||
| Samples | Crystalline contribution (wt%) | Amorphous contribution (wt%) | Average crystallite size (nm) | Relative atomic ratio (wt%) |
|---|---|---|---|---|
| Anatase | ||||
| TiO2 | 84.18 | 15.82 | 7.9 | 0 |
| Ru/TiO2 | 83.93 | 16.07 | 8.3 | 0.707 |
| Au/TiO2 | 84.07 | 15.93 | 8.1 | 0.71 |
The general morphology of Ru, Au/TiO2 was also investigated by TEM measurements. As is shown in Fig. 4a–c, the as-synthesised Ru, Au/TiO2 were globular catalysts with dark spots of Ru, Au nanoparticles. It was obvious that Ru or Au nanoparticles were dispersed on the (101) facet of TiO2 (Fig. 4b and c) with a small size (10 nm), corresponding to the average crystallite size determined from the half peak width of the XRD patterns. HRTEM presented more details on the lattice fringes (0.35 nm), which match well with the XRD results of (101) facet of anatase TiO2 (Fig. 4d). Ru, Au nanoparticles with 2 nm size can be found and their lattice fringes (0.21 nm and 0.24 nm, respectively, Fig. 4e and f) indicate that noble metal clusters were successfully adsorbed into the (101) facet from the HRTEM results, which are consistent with the EDS results (Fig. 4d).
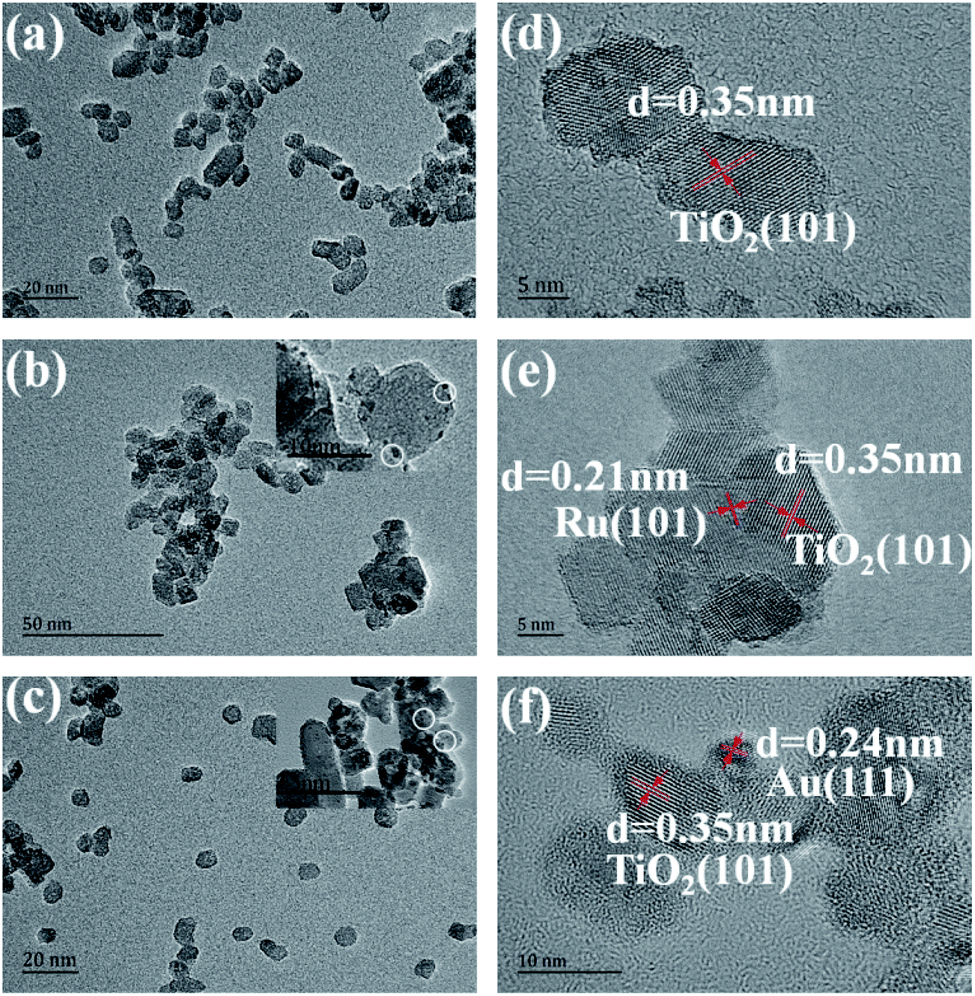 | ||
| Fig. 4 (a, b, and c) TEM images of the TiO2, Ru/TiO2, and Au/TiO2 photocatalysts, respectively; (d, e, and f) HRTEM images of the TiO2, Ru/TiO2, and Au/TiO2 photocatalysts, respectively. | ||
3.2. Surface chemical structures
To detect the surface state of the as-synthesised photocatalysts, all the samples were analysed by FT-IR, XPS, and Raman spectroscopy. The strong absorption observed below 400–1003 cm−1 is attributed to the lattice vibrations of anatase TiO2 and the bands at about 1600 cm−1 and 3340 cm−1 correspond to the O–H bending modes and stretching of water absorbed on the (101) facet of TiO2, respectively (Fig. 5a). O–H absorbed on the (101) facet of TiO2, which was favourable for absorbing the reduced noble metal particles, was partly preserved after heat treatment. As is shown in Fig. 5b, five phonon vibrations observed at 147.8, 200.02, 398.8, 518.75, and 643.56 cm−1 can be assigned to the E1g, E22g, B11g, A1g + B21g, and E33g stretching modes, respectively. Moreover, two slight shifts in the E1g mode for higher wave-number (147.8 to 150.46, 151.9 cm−1) were found for the Ru/TiO2 and Au/TiO2 samples, respectively (Fig. 5c), which illustrated that the adsorption of Ru or Au clusters forms a robust interaction between Ru or Au and anatase TiO2. The existence of the robust interaction could be confirmed by the band at about 1404 and 1409 cm−1 observed for the Ru, Au/TiO2 samples (Fig. 5a). Similar results were proved with the HRTEM results (Fig. 4e and f), indicating the formation of Ru–O–Ti or Au–O–Ti chemical bonds for the interaction between the Ru, Au samples and the (101) facet of anatase TiO2.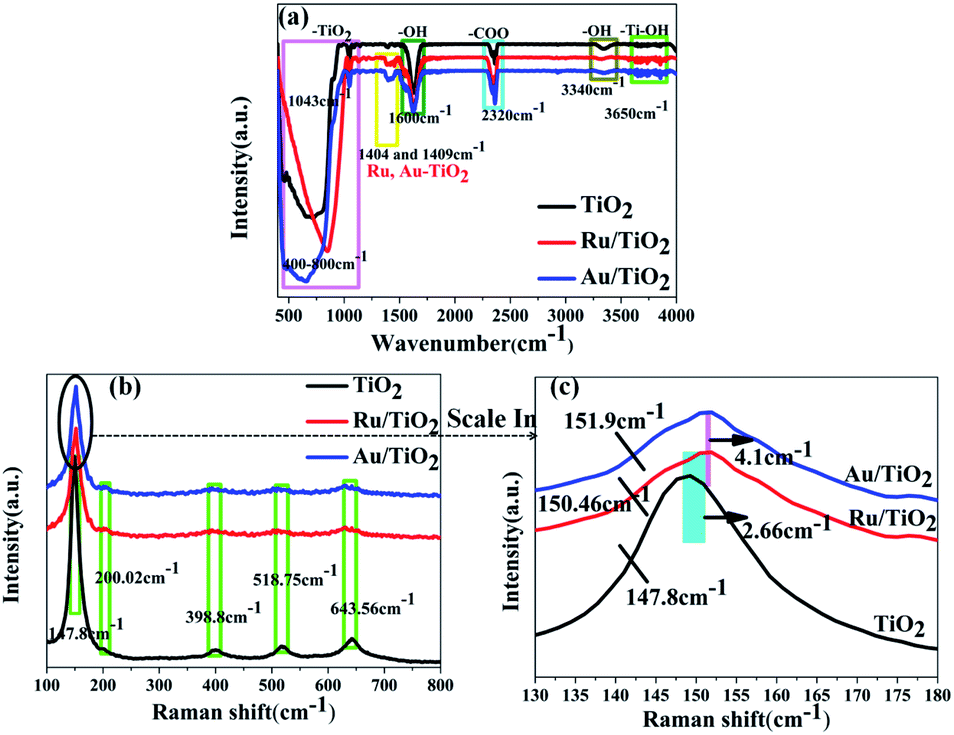 | ||
| Fig. 5 FTIR (a) and Raman (b and c) spectra of anatase TiO2, Ru/TiO2, and Au/TiO2 photocatalysts, respectively. | ||
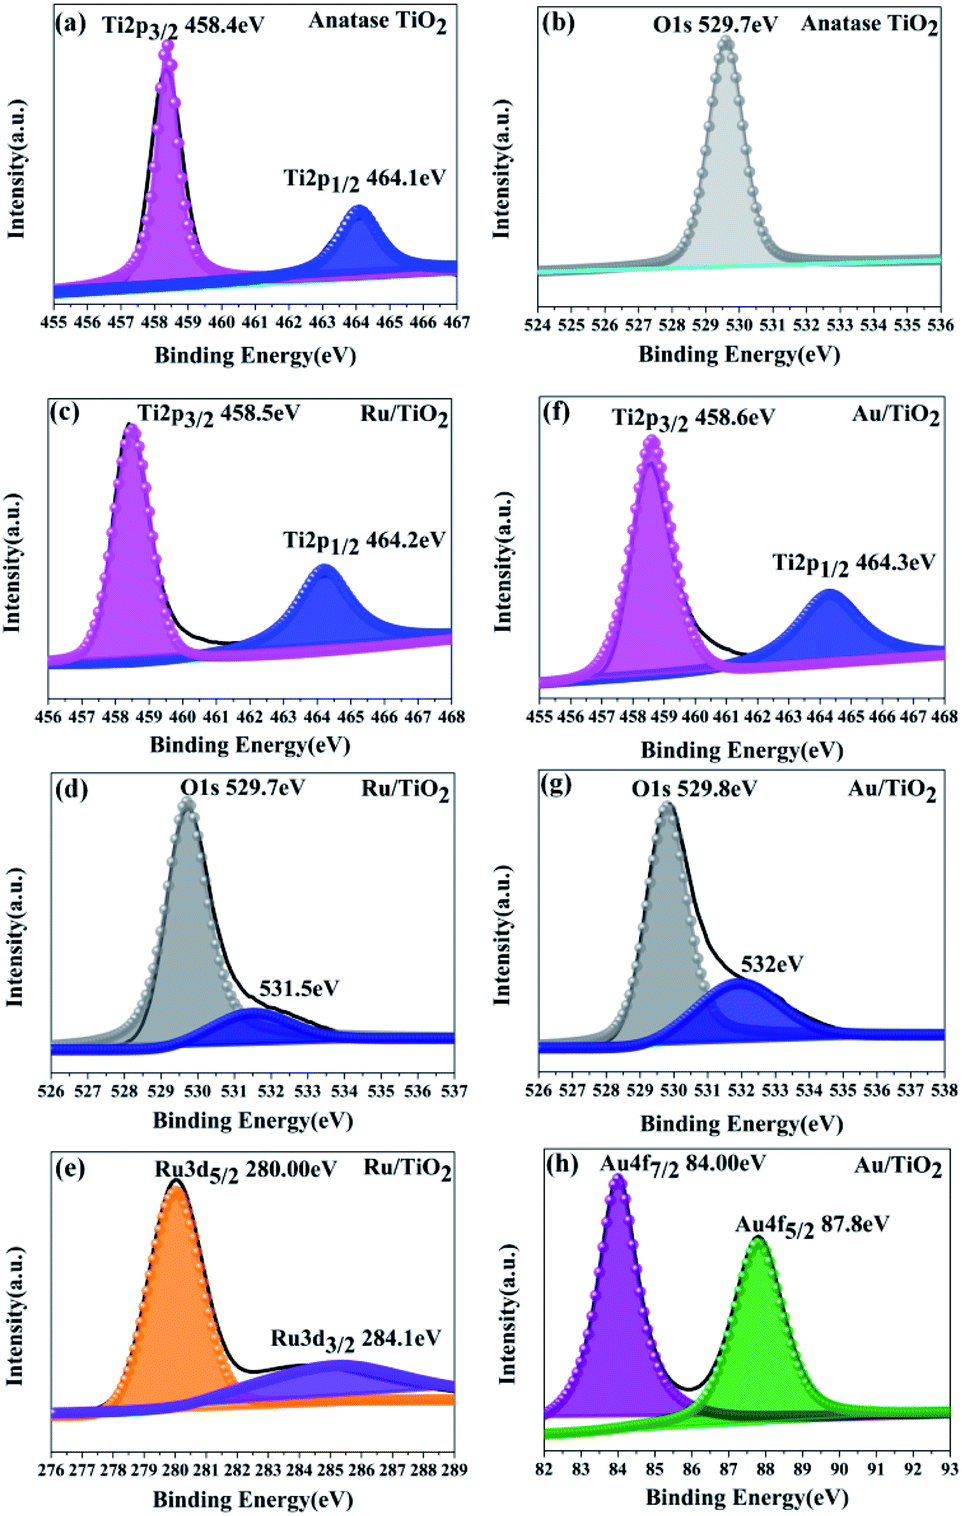
As is shown in Fig. 6a, two main peaks were observed at the binding energies of 458.4 and 464.1 eV, corresponding to the Ti 2p3/2 and Ti 2p1/2 of the Ti4+ species, respectively. The energy separation between the Ti 2p3/2 and Ti 2p1/2 states is 5.7 eV, indicating the formation of the TiO2 lattice. Besides, the oxygen species were also analysed from the O XPS spectra (Fig. 6b); the signal peak at the binding energy of 529.7 eV was assigned to the O 1s state of O2− anion in the TiO2 lattice.
 | ||
| Fig. 6 XPS spectra for the Ti 2p, O 1s, Ru 3d, and Au 4f states of the anatase TiO2 (a and b), Ru/TiO2 (c–e), and Au/TiO2 (f–h) photocatalysts, respectively. | ||
Two main peaks for Ru/TiO2 were observed, corresponding to the Ti 2p3/2 and Ti 2p1/2 core levels of the Ti4+ species, respectively, same as that in TiO2. However, the binding energies of the Ti4+ species in the composite obviously shifted towards the higher end by about 0.1 eV (Ti 2p3/2 and Ti 2p1/2, respectively) as shown in Fig. 6c. Moreover, the binding energies of Ru 3d5/2 and Ru 3d3/2 were 280.1 and 284.2 eV, which are attributed to the Ru0 and Ru3+ species, respectively. Comparing the Ru 3d5/2 (280.00 eV) peak with the Ru 3d3/2 (284.10 eV) peak in the samples, the binding energy shifted to the lower end by 0.10 eV (Fig. 6e) due to the electrons transferred to the centre of the d orbital of Ru from the Ti 2p orbital. The same result is also seen in Fig. 6d by the O 1s peak at the binding energy of 529.7 eV. However, a conspicuous peak was observed at the binding energy of 531.5 eV, which is assigned to the Ru–O bond (in Fig. 6d). As for the Au/TiO2 photocatalyst, the O 1s peak at the binding energy of 529.8 eV shifted and increase by 0.1 eV. Importantly, the peak at 532 eV can be attributed to the Au–O bond (Fig. 6g). These bonding structures were observed in the Raman and FT-IR spectra (Fig. 5). Being similar to Ru/TiO2, the binding energies of the Au 4f7/2 and Au 4f5/2 states were shifted towards the lower values (Fig. 6h) due to the strong metal-carrier interaction aroused by the electron from the Ti 2p orbital to the Au orbital. Remarkably, a similar shift was also seen for Ti 2p (Fig. 6f). The enhancement in the blue-shift (lower direction) can be attributed to the electron transferred from the Ti 2p orbital to the Au orbital, which is due to surface plasmon resonance (SPR) of Au.
3.3. The interaction with electron-traps and local electric field
For semiconductors used in photocatalytic OWS, there are three mains steps as shown in Fig. 7. A semiconductor absorbs the photons with energies greater than its band gap, upon which the electrons in the semiconductor are excited from the valence band (VB) to the conduction band (CB). This generates electron–hole pairs as the initial step of the photocatalytic process (step 1). The electron–holes pairs are independently transferred to the surface of the semiconductor; meanwhile, the recombination of electron–hole pairs takes place in the bulk and on the surface of the semiconductors (step 2). Subsequently, they participate in the HER and OER on the surface of the photocatalysts (step 3). Thus, the improvement in the photo-quantum absorption efficiency and migration of the photo-induced electron–hole pairs in the photocatalytic hydrogen evolution from water splitting are highly desirable. Some active sites of the electron-traps were constructed on the surface of the specific (101) facet of TiO2 to control the migration of photo-induced electron–hole pairs for inhibiting the recombination of the carriers. | ||
| Fig. 7 Schematic illustration of the main processes within the photocatalytic overall water splitting reaction of semiconductors. | ||
As mentioned in the above results, the interfaces of Ru, Au/TiO2 were observed in the HRTEM surface (Fig. 4e and f), which indicated the formed chemical bond as the strong interaction between the Ru, Au and the (101) facet of anatase TiO2. In particular, the robust interaction of Ru–O–Ti or Au–O–Ti chemical bonds was formed after the Ru or Au cluster was adsorbed on the TiO2 (101) facets, as proved by FT-IR, Raman spectroscopy, and XPS (Fig. 5 and 6).
To further investigate the interaction of Ru–O–Ti and the interface stability of Ru/TiO2, the DFT method was adopted for simulation and analysis. The stability of the electronic structures of M/TiO2 (101) were estimated by the adsorption energy Eads = Eatom/surface − (Eatom + Esurface). Here, Eatom is the energy of an isolated metal atom, Esurface is the energy of the clean (101) surface slab, and Eatom/surface is the total energy of the surface with metal atom (M) adsorption.65 Table 2 reports the calculated adsorption energies for the Ru cluster-adsorbed facet (101) of anatase TiO2. It was noted that the Eads (Ru/TiO2) was negative (−0.79 eV), indicating a favourable process and the steady adsorption of the Ru clusters onto the anatase TiO2 (101) facets with chemical bonds. Thus, Ru cluster as the electron-trap was successfully constructed on the anatase TiO2 (101) facets.
| Configuration | Eads (eV) | Electrostatic potential (eV) | Mulliken charge (e) |
|---|---|---|---|
| Free (101) facet | — | 7.033 | 2.48 |
| Ru/TiO2 (101) | −0.79 | 2.96 | 2.72 |
| Au/TiO2 (101) | −0.85 | 2.23 | 2.87 |
The effect of the electron-traps on activity enhancement of photocatalytic H2 evolution in OWS, the interface electronic structure of electrostatic potential, and Mulliken charge were calculated based on DFT. The potential distribution can provide information about the electric field and transfer of the photogenerated charges in the photocatalytic systems. As reported in Table 2, the electrostatic potential of Ru/TiO2 (101) (2.96 eV) was lower than that of the (101) facet of original TiO2 (7.033 eV). The local final built-in electric field of the interface of the Ru/TiO2 (101) structure pointed from the noble metal Ru layer of the TiO2 (101) surface layer. In addition, the distribution of Mulliken charges can reveal the separated mechanism of carriers, as is shown in Table 2. The amount of electron transfer from the TiO2 (101) layers to the Ru atoms layers is coincident with the XPS results (Fig. 6e). The differences in the electrostatic potential between the (101) facet of the original TiO2 and Ru/TiO2 may be due to the photogenerated electrons that tend to localize close to the adsorbed Ru clusters atoms, thus benefitting the separation of the photogenerated carriers. As is shown in Fig. 8a, the valence band (VB) and conduction band (CB) of TiO2 were predominantly composed of O 2p states and Ti 3d states, respectively. As for the image showing the difference charge density (Fig. 8b), O atoms provide an electron rich region while Ti atoms provide a vacant orbital in the TiO2 lattice. The DOS of Ru/TiO2, as shown in Fig. 8c, illuminates the adsorbed Ru clusters that change the electronic properties of the original TiO2. The electronic states of the Ru 4d impurity appeared at the top of the VB and the bottom of the CB, and exhibited some energy dispersion. Not surprisingly, the existence of the deletion region around the Ru clusters and its connection with the electron enrichment region of O atoms indicated the formation of the Ru–O chemical bond. The existence of electron enrichment region around the Ru clusters indicates that the transfer of the photoelectrons can be trapped to enrich the electrons (Fig. 8d).
 | ||
| Fig. 8 Density of states (a, c and e) and difference charge density (b, d and f) of the configuration model of anatase TiO2, Ru/TiO2, and Au/TiO2, respectively. Red and blue represent electron enrichments and loss, respectively, and the brighter the colour, the more electrons are enriched or absent. | ||
The enhancement mechanism of the electron-traps for the photocatalytic overall water splitting is shown in Fig. 9. The generated electron would overcome the Schottky barrier and can be directly transfer to the surface of the electron-traps in the Ru clusters atoms owing to the existence of the local final built-in electric field of the interface of the Ru/TiO2 (101) structure pointed from the noble metal Ru layer to the TiO2 (101) surface layer. Further, the electron-traps formed on the surface of the (101) facet of TiO2 by the introduction of noble metal Ru cluster collect the photogenerated electrons as the active sites for hydrogen evolution due to the existence of an electron enrichment region around the Ru clusters. Besides, due to the appearance of the Ru 4d electronic impurity states, a set of new degenerate energy levels are formed, thus narrowing the band gap and the promotion of electron migrated from the top of the Ru 4d electronic impurity state to the CB. Therefore, the electron-traps efficiently promoted the separation of the electron–hole pairs and provided active sites of the reduction reaction of photocatalytic splitting water upon the deposition of Ru nanoparticles on the (101) facet of TiO2.
 | ||
| Fig. 9 Schematic illustration of the mechanism of electron-traps for the photocatalytic overall water splitting. | ||
To investigate the effects of electron-traps on photocatalytic H2 evolution, the optical responsiveness and degree of recombination of the photoelectron–hole pairs of the photocatalysts by diffuse reflectance UV-Vis (DRS), the Kubelka–Munk plots and steady-state fluorescence analysis were carried out. The diffuse reflectance UV-Vis spectra and Kubelka–Munk plots are presented in Fig. 10. The anatase TiO2 nanoparticles exhibit an absorption edge at 387 nm and correspond to the band gap of 3.2 eV (Fig. 10b). Compared with the original TiO2, the absorbance intensity of Ru/TiO2 (101) in the visible region is significantly enhanced and corresponds to the band gap reduction of 2.98 eV. It is also proved that Ru/TiO2 has a strong light response ability in the visible region. The steady-state fluorescence of TiO2 shows an intense emission peak centred at about 443 nm under 380 nm excitation, which is attributed to the robust recombination of photo-carriers occupying the surface of TiO2 (Fig. 11). The lower PL intensity for Ru/TiO2 indicates that the visible light responses of Ru/TiO2 can be enhanced by the absorbed Ru clusters. The quenching of the PL intensity of Ru/TiO2 demonstrates that the Ru–O–Ti chemical bond can efficiently suppress the recombination of photogenerated carriers and promote the separation of the electron–hole pairs.
 | ||
| Fig. 10 UV-Vis absorbance spectra (a) and Kubelka–Munk plots of anatase TiO2, Ru/TiO2, and Au/TiO2 photocatalysts (b), respectively. | ||
 | ||
| Fig. 11 The steady-state fluorescence spectra of anatase TiO2, Ru/TiO2, and Au/TiO2 photocatalysts excited by 380 nm light, respectively. | ||
The photocatalytic hydrogen evolution performance of the as-prepared photocatalysts was measured. As is shown in Fig. 12a and b, compared with a negligible photocatalytic activity for H2 evolution on the original TiO2 particles, Ru/TiO2 showed a powerful photocatalytic activity of about 40.78 μmol g−1 h−1, which is greater by about two orders of magnitude. Except for Ru induced as the co-catalyst that increases the absorption of light, the exposed active sites as the traps on the surface of basic TiO2 effectively aggregate the photogenerated electrons for reduction reactions and efficiently suppress the recombination of electron–hole pairs upon deposition of Ru nanoparticles on the (101) facet of TiO2. In addition, the stability of the Ru/TiO2 photocatalysts were also cycle-tested (Fig. 12c). The amount and rate of H2 evolution were constant after the third cycle, indicating that the photocatalysts are physically and chemically stable in the photocatalytic hydrogen evolution reaction.
 | ||
| Fig. 12 (a and b) Photocatalytic H2 evolution reactions by various photocatalysts (anatase TiO2, Ru/TiO2, Au/TiO2); (c and d) cycling test of photocatalytic H2 evolution reactions for Ru/TiO2 and Au/TiO2, respectively. Reaction conditions: 100 mL pure water; catalyst amount, 100 mg; light source, xenon lamp (300 W); temperature, 25 °C. | ||
Photoelectrochemical measurements were conducted to evaluate the separation of the photo-generated electrons of the photocatalysts. Aimed at demonstrating the role of the Ru clusters in altering the separation of the electrons in Ru/TiO2, the LSV scans and transient photocurrent responses were measured. Fig. 13a shows the LSV of TiO2, Ru/TiO2, and Au/TiO2 electrodes in 0.2 M Na2SO4 solution under light irradiation. TiO2 exhibited a negligible current, which is attributed to the robust recombination of photo-carriers that occupy the bulk and surface of TiO2. Moreover, the photocurrent of Ru/TiO2 is much higher than that of TiO2, indicating that more electron carriers were produced from TiO2 by assembling the surface of the Ru clusters. As shown in Fig. 13b, compared with TiO2, significant photocurrent was observed for Ru/TiO2 and Au/TiO2 under dark conditions; the dark current could be attributed to the different carrier concentrations above the barrier level. Different from the low dark currents of the photocatalysts, as theirs are photosensitive, the photocurrents under the light were all higher than the dark currents. TiO2 showed a weak photocurrent response, further confirming the existence of strong recombination of the photo-carriers. A significant photocurrent was observed for Ru/TiO2, indicating low recombination of the photo-generated charge carriers. This could be attributed to the strong interaction and act as electron-traps due to the deposited Ru clusters, which can efficiently promote the rapid migration and separation of the photo-generated electron–hole pairs.
 | ||
| Fig. 13 (a) LSV scans in Na2SO4 solution; (b) transient photocurrents responses of anatase TiO2, Ru/TiO2, and Au/TiO2. | ||
To demonstrate the enhancement activity of TiO2 modified by noble metal clusters for photocatalytic hydrogen evolution except for the effect of electron-traps, the Au nanoclusters as the active sites with surface plasmon resonance (SPR) effect were simulated by DFT and proved by catalytic response results. Herein, SPR is a phenomenon of resonant oscillation of the free electron density on the surface of the metal, when the metal nanocomposite is irradiated by a specific wavelength of incident light smaller than or comparable to the size of the metal.66 The calculated adsorption energies of the Au clusters adsorbed on the (101) facet of anatase TiO2 are given in Table 2. Compared with Ru/TiO2, the Eads of Au/TiO2 was also negative (−0.85 eV), which indicated that the Au nanoclusters were steadily adsorbed onto the anatase TiO2 (101) facets through chemical bonds. The interface electronic structure of the electrostatic potential and Mulliken charge were researched to investigate the effect of SPR on the intensification of the photocatalytic activity. In Table 2, the electrostatic potential of the Au/TiO2 (101) structure (2.23 eV) was also lower than that of the (101) facet of original TiO2 (7.033 eV). Under the formation of the Au–O–Ti chemical bond under the loaded Au clusters on the (101) facet, the final built-in electric field of the Au/TiO2(101) structure pointed from the Au cluster to the TiO2 (101) surface layer. Also, the differences in the amount of the electron transfer from the TiO2 (101) surface to the Au atoms layers indicated that the photogenerated electrons tend to localize close to the adsorbed Au clusters atoms, thus leading to the separation of the photogenerated carriers. Compared with the configuration of Ru/TiO2 (101), the configuration of the Au clusters adsorbed on the (101) facet has a lower value of electrostatic potential (2.23 eV) and larger amount of transfer of Mulliken charge (2.87e), which is attributed to the effect of SPR. The final built-in electric field on the interface of Au/TiO2 was enhanced due to the stronger formation of Au–O–Ti bond, exciting increase of the number of electrons on the active site of Au clusters. The formation of the local internal electric field on the interface between the Au clusters and the (101) facet of TiO2 and the generation of the ‘hot’ electron on the surface of the Au cluster atoms when Au/TiO2 was irradiated by the incident light were the effects of SPR in the application of photocatalysis.
The DOS and difference charge density of Au/TiO2 are also seen in Fig. 8e and f. The electronic states of the Au 5d impurity level appeared at the top of the VB and the bottom of the CB, revealing a degree of energy dispersion. The Au clusters, their connection with the electron enrichment region of the O atoms, and the existence of an electron enrichment region around the Au clusters prove that electrons can be trapped to enrich them. However, compared with the configuration of Ru/TiO2 (101), a stronger intensity of the electronic states of the Au 5d impurity level was observed (Fig. 8e) and the area of the electron enrichment region around the Au clusters increased in Au/TiO2 (101) (Fig. 8f). It is indicated that the SPR effect of Au can increase the generation of electrons and intensify the final built-in electric field of the interface. The appearance of the Au 5d electronic impurity states and the formation of a new degenerate energy level synergistically narrow the band gap to increase the absorption of light.
The mechanism of the synergistic effect of electron-traps and SPR to intensify the photocatalytic overall water splitting is shown in Fig. 14. Above all, the generated electron would overcome the Schottky barrier and can be directly transfer to the surface of the electron-traps in the Au clusters as the active sites for the hydrogen evolution owing to the existence of the local final built-in electric field of the interface of the Au/TiO2(101) structure that points from the Au layer to the TiO2(101) surface layer and the electron enrichment region. In addition, due to the appearance of the Au 5d electronic impurity states, a set of new degenerate energy levels are formed, which narrow the band gap to increase the absorption of light. Moreover, the photo-generated ‘hot’ electron can be collected at the surface of the electron-traps in the Au clusters owing to the excitation of SPR on the surface of the Au cluster, leading to the enhancement in the local final built-in electric field because of the effect of SPR, when irradiated by light. Therefore, the improved utilization of the photogenerated electrons was attributed to the SPR effect that increased the number of surface electron and accelerated the migration of electrons upon deposition of Au nanoparticles on the (101) facet of anatase TiO2.
 | ||
| Fig. 14 Schematic illustration of mechanism of intensification of SPR. | ||
The optical absorption of Au clusters adsorbed on TiO2 displays an obvious enhancement in the visible region and obtains a smaller band gap of about 2.79 eV (Fig. 10a and b). A strong absorption at about 550 nm that emerges in the UV-Vis spectrum of Au/TiO2 is attributed to the effect of SPR. Besides, the weak intensity of steady-state fluorescence was observed for Au/TiO2 in the PL spectrum (Fig. 11), indicating that Au can efficiently suppress the recombination of the electron–hole pair, thus accelerating the electron transfer in the presence of the Au–O–Ti chemical bond.
Compared with the photocatalytic performance of Ru/TiO2, Au/TiO2 exhibits a greatly boosted evolution rate of H2 (114.67 μmol g−1 h−1), which was 2.8-fold higher than that of the Ru/TiO2 photocatalyst (Fig. 12a and b). Furthermore, the stability of the Au/TiO2 photocatalyst was also cycle-tested (Fig. 12d), and the amount of the H2 evolution was maintained after the third cycle. Specifically, Au/TiO2 showed a greatly enhanced photocurrent compared to Ru/TiO2, further improving the transfer and separation of the photogenerated electron–hole pairs, which can be attributed to the effect of SPR due to the deposited Au nanoparticles (Fig. 13b).
4. Conclusions
In summary, the Ru, Au clusters deposited on the exposed (101) facet of anatase TiO2 through photo-reduction route has been employed as electron-traps and active sites for HER. The greatly enhanced catalytically exposed active sites, as the electron-traps with an abundance of active sites, could efficiently promote the separation of the electron–hole pairs, assemble the photogenerated electrons, and provide active sites for the reduction reaction in photocatalytic water splitting. Compared with the electronic structure of Ru/TiO2, Au/TiO2 provided the plasmon-induced ‘hot’ electrons that can increase the generation of electrons near the surface of the Au clusters; the photogenerated electron can easily overcome the Schottky barrier and is rapidly transferred to the surface of the Au clusters under the harvesting final built-in electric field at the interface between the Au and (101) facet of TiO2 owing to the SPR effect, when irradiated by light. The combined interface electronic structure and the formation of the final built-in electric field promote the separation of the photogenerated carriers (electron–hole pairs). Besides, the appearance of the Ru 4d and Au 5d electronic impurity states, the formation of a new set of degenerate energy levels was observed, which narrows the band gap, and enhances the response and the absorption ability. In addition, Au/TiO2 exhibits enhanced photocatalytic activity for H2 evolution, which is attributed to the existence of synergistic effect of the electron-traps and SPR.Conflicts of interest
The authors declare no conflict of interest.Acknowledgements
The authors greatly acknowledge Dr Song Yuexiao, Dr Wang Hong, and Li Gang at Tianjin University, Tianjin University of Technology and Research Centre for Eco-Environmental Sciences, Chinese Academy of Sciences for the contribution of diffuse reflectance UV-Vis analysis, PL, and TEM, respectively. This work is financially supported by the Innovative Research Team of the Chinese University (IRT-17R81) and the Innovative Research Team of Tianjin Municipal Education Commission (TD-5004).References
- A. Kudo and Y. Miseki, Chem. Soc. Rev., 2009, 38, 253–278 RSC
.
- B. A. Pinaud, J. D. Benck, L. C. Seitz, A. J. Forman, Z. Chen, T. G. Deutsch, B. D. James, K. N. Baum, G. N. Baum and S. Ardo, Energy Environ. Sci., 2013, 6, 1983–2002 RSC
- T. Takata, C. Pan and K. Domen, Sci. Technol. Adv. Mater., 2015, 16, 033506 CrossRef PubMed
- T. Hisatomi and K. Domen, Faraday Discuss., 2016, 198, 11–35 RSC
- Q. Wang, T. Hisatomi, Q. Jia, H. Tokudome, M. Zhong, C. Wang, Z. Pan, T. Takata, M. Nakabayashi and N. Shibata, Nat. Mater., 2017, 15, 611 CrossRef PubMed
- M. G. Kibria, F. A. Chowdhury, S. Zhao, B. Alotaibi, M. L. Trudeau, H. Guo and Z. Mi, Nat. Commun., 2014, 6, 6797 CrossRef PubMed
- R. Konta, T. Ishii, H. Kato and A. Kudo, ChemInform, 2004, 35, 8992–8995 CrossRef
- T.-D. Nguyen Phan, H.-D. Pham, T. Viet Cuong, E. Jung Kim, S. Kim and E. Woo Shin, J. Cryst. Growth, 2009, 312, 79–85 CrossRef
- Q. Sun and Y. Xu, J. Phys. Chem. C, 2010, 114, 18911–18918 CrossRef CAS
- C. Pan, T. Takata and K. Domen, Chemistry, 2016, 22, 1854–1862 CrossRef CAS PubMed
- W. Zhong, S. Shen, S. Feng, Z. Lin, Z. Wang and B. Fang, CrystEngComm, 2018, 20, 7851–7856 RSC
- J. Yang, D. Wang, H. Han and C. Li, Acc. Chem. Res., 2013, 46, 1900–1909 CrossRef CAS PubMed
- Y. W. Justin, L. Seung-Hyun Anna, M. Kazuhiko and T. E. Mallouk, ChemInform, 2010, 41, 1966–1973 Search PubMed
- J. Osorio-Guillén, S. Lany and A. Zunger, Phys. Rev. Lett., 2008, 100, 036601 CrossRef PubMed
- W. Zhong, S. Shen, M. He, D. Wang, Z. Wang, Z. Lin, W. Tu and J. Yu, Appl. Catal., B, 2019, 258, 117967 CrossRef CAS
- H. J. Yan, J. H. Yang, G. J. Ma, G. P. Wu, X. Zong, Z. B. Lei, J. Y. Shi and C. Li, J. Catal., 2009, 266, 165–168 CrossRef CAS
- G. Liao, J. Fang, Q. Li, S. Li, Z. Xu and B. Fang, Nanoscale, 2019, 11, 7062–7096 RSC
- S.-C. Yang, G. Chang, G.-J. Yang, Y.-J. Wang and B. Fang, Catal. Sci. Technol., 2015, 5, 228–233 RSC
- D. Xu, Q. Chu, Z. Wu, Q. Chen, S.-Q. Fan, G.-J. Yang and B. Fang, J. Catal., 2015, 325, 118–127 CrossRef CAS
- Y.-J. Wang, G. Chang, Q. Chen, G.-J. Yang, S.-Q. Fan and B. Fang, Chem. Commun., 2015, 51, 685–688 RSC
- X. H. Wang, J.-G. Li, H. Kamiyama, Y. Moriyoshi and T. Ishigaki, J. Phys. Chem. B, 2006, 110, 6804–6809 CrossRef CAS PubMed
- L. Hui, C. Jian-Wen, S. Shiwei, Z. Jie, Z. Lingxia, T. Chun Kwan, C. Hua, L. Fengxia, L. Shuit-Tong and L. Yang Yang, Small, 2013, 9, 37–44 CrossRef PubMed
- Y. G. Kim, J. Walker, L. A. Samuelson and J. Kumar, Nano Lett., 2003, 3, 523–525 CrossRef CAS
- Y. Duan, N. Fu, Q. Liu, Y. Fang, X. Zhou, J. Zhang and L. Yuan, J. Phys. Chem. C, 2012, 116, 8888–8893 CrossRef CAS
- B. Grzmil, M. Glen, B. Kic and K. Lubkowski, Ind. Eng. Chem. Res., 2011, 50, 6335–6342 CrossRef
- J. Hensel, G. Wang, Y. Li and J. Z. Zhang, Nano Lett., 2010, 10, 478 CrossRef CAS PubMed
- R. Li, Y. Weng, X. Zhou, X. Wang, Y. Mi, R. Chong, H. Han and C. Li, Energy Environ. Sci., 2015, 8, 2377–2382 RSC
- M. Kazuhiko, Chem. Commun., 2013, 49, 8404–8406 RSC
- L. K. Preethi, T. Mathews, M. Nand, S. N. Jha, C. S. Gopinath and S. Dash, Appl. Catal., B, 2017, 218, 9–19 CrossRef CAS
- H. Tada, T. Kiyonaga and S. Naya, ChemInform, 2009, 38, 1849–1858 CAS
- H. Li, D. Wang, H. Fan, W. Ping, T. Jiang and T. Xie, J. Colloid Interface Sci., 2011, 354, 175–180 CrossRef CAS PubMed
- H. Zhang, G. Du, W. Lu, L. Cheng, X. Zhu and J. Zheng, CrystEngComm, 2012, 14, 3793–3801 RSC
- S. Chen, T. Takata and K. Domen, Nat. Rev. Mater., 2017, 2, 17050 CrossRef CAS
- S. Bai, W. Yin, L. Wang, Z. Li and Y. Xiong, RSC Adv., 2016, 6, 57446–57463 RSC
- Z. Qiao, R. Li, L. Zheng, A. Li, S. Wang, Z. Liang, S. Liao and C. Li, J. Catal., 2016, 337, 36–44 CrossRef
- B. Ohtani, Chem. Lett., 2008, 37, 217–229 CrossRef CAS
- P. Lei, H. Hui, C. K. Lim, Q. Y. Hong, S. T. Man and O. K. Tan, RSC Adv., 2013, 3, 3566–3571 RSC
- Z. Xu, Y. Hongjian, W. Guopeng, M. Guijun, W. Fuyu, W. Lu and L. Can, J. Am. Chem. Soc., 2008, 130, 7176–7177 CrossRef PubMed
- M. A. Lukowski, A. S. Daniel, C. R. English, M. Fei, A. Forticaux, R. J. Hamers and J. Song, Energy Environ. Sci., 2014, 7, 2608–2613 RSC
- D. Wang, R. Li, J. Zhu, J. Shi, J. Han, Z. Xu and C. Li, J. Phys. Chem. C, 2012, 116, 5082–5089 CrossRef CAS
- W. Zhong, J. Huang, S. Liang, J. Liu, Y. Li, G. Cai, Y. Jiang and J. Liu, ACS Energy Lett., 2020, 5, 31–38 CrossRef CAS
- A. Corrado and W. Polini, J. Manuf. Process., 2019, 45, 520–531 CrossRef
- S. Sato and J. M. White, Chem. Phys. Lett., 1980, 70, 131–134 CrossRef CAS
- Y. Liu, H. Li, W. Cen, J. Li, Z. Wang and G. Henkelman, Phys. Chem. Chem. Phys., 2018, 20, 7508–7513 RSC
- L. O. Paz-Borbón, F. Buendía, I. L. Garzón, A. Posada-Amarillas, F. Illas and J. Li, Phys. Chem. Chem. Phys., 2019, 21, 15286–15296 RSC
- J. Chen and X. Gao, Results Phys., 2019, 15, 102608 CrossRef
- G. Liao, Y. Gong, L. Zhang, H. Gao, G.-J. Yang and B. Fang, Energy Environ. Sci., 2019, 12, 2080–2147 RSC
- J. Ouyang, Z. Zhao, H. Yang, Y. Zhang and A. Tang, Appl. Clay Sci., 2018, 152, 221–229 CrossRef CAS
- F. Wang, Z. Xie, J. Liang, B. Fang, Y. a. Piao, M. Hao and Z. Wang, Environ. Sci. Technol., 2019, 53, 6989–6996 CrossRef CAS PubMed
- Q. Tang, F. Wang, X. Liu, M. Tang, Z. Zeng, J. Liang, X. Guan, J. Wang and X. Mu, Appl. Clay Sci., 2016, 132–133, 175–181 CrossRef CAS
- A. Koichi, F. Makoto, R. Carsten, T. Junji, M. Hirotaka, O. Yoshimichi, Y. Naoya and W. Toshiya, J. Am. Chem. Soc., 2008, 130, 1676–1680 CrossRef PubMed
- M.-C. Daniel and D. Astruc, Chem. Rev., 2004, 104, 293–346 CrossRef CAS PubMed
- B. Q. Li and L. Changhong, Opt. Lett., 2011, 36, 247 CrossRef PubMed
- H. Gao, Z. Peng, J. Zhao, J. Pan, J. Hu and G. Shao, Appl. Catal., B, 2017, 210, 297–305 CrossRef CAS
- P. Christopher, D. B. Ingram and S. Linic, J. Phys. Chem. C, 2010, 114, 9173–9177 CrossRef CAS
- L. Cano-Casanova, A. Amorós-Pérez, M. Ouzzine, M. A. Lillo-Ródenas and M. C. Román-Martínez, Appl. Catal., B, 2018, 220, 645–653 CrossRef CAS
- J. P. Perdew, Phys. Rev. Lett., 1997, 78, 3865 CrossRef
- M. D. Segall, P. J. D. Lindan, M. J. Probert, C. J. Pickard, P. J. Hasnip, S. J. Clark and M. C. Payne, J. Phys.: Condens. Matter, 2002, 14, 2717–2744 CrossRef CAS
- D. Vanderbilt, Phys. Rev. B: Condens. Matter Mater. Phys., 1990, 41, 7892 CrossRef PubMed
- B. G. Pfrommer, M. Côté, S. G. Louie and M. L. Cohen, J. Comput. Phys., 1997, 131, 233–240 CrossRef CAS
- S. L. Dudarev, G. A. Botton, S. Y. Savrasov, C. J. Humphreys and A. P. Sutton, Phys. Rev. B: Condens. Matter Mater. Phys., 1998, 57, 1505–1509 CrossRef CAS
- R. C. Buchanan and T. Park, Materials crystal chemistry, Marcel Dekker, 1997 Search PubMed
- S. Mayank, W. Jun, L. Wen-Sheng, W. W. Damion, K. Seung Min, E. A. Stach, J. T. Miller, D. W. Nicholas and F. H. Ribeiro, J. Am. Chem. Soc., 2012, 134, 4700–4708 CrossRef PubMed
- H. Zhang and J. Banfield, J. Phys. Chem. B, 2000, 104, 3481–3487 CrossRef CAS
- W. Yun and G. S. Hwang, J. Chem. Phys., 2005, 122, 164706 CrossRef PubMed
- W. A. Murray and W. L. Barnes, Adv. Mater., 2007, 19, 3771–3782 CrossRef CAS
| This journal is © The Royal Society of Chemistry 2020 |