 Open Access Article
Nickel–cobalt hydroxide: a positive electrode for supercapacitor applications
M. Sangeetha Vidhyaa,
G. Ravia,
R. Yuvakkumar *a,
Dhayalan Velauthapillai*b,
M. Thambidurai
 c,
Cuong Dangc and
B. Saravanakumard
aNanomaterials Laboratory, Department of Physics, Alagappa University, Karaikudi, 630 003, Tamil Nadu, India. E-mail: yuvakkumarr@alagappauniversity.ac.in
bFaculty of Engineering and Science, Western Norway University of Applied Sciences, Bergen – 5063, Norway
cCentre for OptoElectronics and Biophotonics (COEB), School of Electrical and Electronic Engineering, The Photonics Institute (TPI), Nanyang Technological University, 50 Nanyang Avenue, 639798, Singapore
dSchool for Advanced Research in Polymers (SARP), Laboratory for Advanced Research in Polymeric Materials (LARPM), Central Institute of Plastics Engineering & Technology (CIPET), Bhubaneswar – 751024, India
First published on 21st May 2020
Abstract
So far, numerous metal oxides and metal hydroxides have been reported as an electrode material, a critical component in supercapacitors that determines the operation window of the capacitor. Among them, nickel and cobalt-based materials are studied extensively due to their high capacitance nature. However, the pure phase of hydroxides does not show a significant effect on cycle life. The observed XRD results revealed the phase structures of the obtained Ni(OH)2 and Co–Ni(OH)2 hydroxides. The congruency of the peak positions of Ni(OH)2 and Co–Ni(OH)2 is attributed to the homogeneity of the physical and chemical properties of the as-prepared products. The obtained results from XPS analysis indicated the presence of Co and the chemical states of the as-prepared composite active electrode materials. The SEM analysis revealed that the sample had the configuration of agglomerated particle nature. Moreover, the morphology and structure of the hydroxide materials impacted their charge storage properties. Thus, in this study, Ni(OH)2 and Co–Ni(OH)2 composite materials were produced via a hydrothermal method to obtain controllable morphology. The electrochemical properties were studied. It was observed that both the samples experienced a pseudocapacitive behavior, which was confirmed from the CV curves. For the electrode materials Ni(OH)2 and Co–Ni(OH)2, the specific capacitance (Cs) of about 1038 F g−1 and 1366 F g−1, respectively, were observed at the current density of 1.5 A g−1. The Ni–Co(OH)2 composite showed high capacitance when compared with Ni(OH)2. The cycle index was determined for the electrode materials and it indicated excellent stability. The stability of the cell was investigated up to 2000 cycles, and the cell showed excellent retention of 96.26%.
1. Introduction
In recent years, energy demands are rapidly increasing due to the depletion of fossil fuel resources and carbon emissions from vehicles, affecting global environmental conditions.1 To avoid such issues and continue fulfilling electrical energy demand, renewable resources such as wind, solar, and hydroelectricity are highly encouraged.2–4 Owing to the intermittent nature of renewable resources, it is important to find suitable storage technologies. Among them, there are plenty of energy storage systems available; the electrochemical energy storage systems offer attractive features such as high energy and power and a large number of complete charge/discharge cycles.5–8 In particular, electrochemical capacitors (ECCs) show peculiar characteristics such as high power density, a high number of complete charge/discharge cycles, quick charge and discharge capacity, operating temperature, wide-range capability, and use of low-cost materials.9–11 The energy storage mechanism of ECCs has a charge separation associated between the electrode and electrolyte. It can exhibit two major mechanisms, such as non-faradaic reactions, occurring in electric double-layer capacitors (EDLCs) and the faradaic reaction observed in pseudocapacitors. The EDLC type of capacitors only involves the physical adsorption/desorption of the charged particles from the surface of the electrodes. Most of them are carbon-based EDLC electrode materials. High surface area (highly porous nature) has an important role in EDLCs because the ions get accumulated in the pores at the electrode/electrolyte interface when the reactions are involved in the charge–discharge process. Due to non-faradaic reactions, there will be low specific capacitance. Nevertheless, the pseudocapacitor principle differs from the EDLC principle. It exhibits surface reduction and oxidation processes such as battery electrode behavior. Pseudocapacitor electrode materials are developed from transition metal oxides and conducting polymers. Transition metal oxides with different oxidation states are considered as promising materials for supercapacitors. Typical transition metal oxides such as RuO2, NiO, CoO and MnO2 are all examined as superior supercapacitor electrode materials. The bandgap of transition metal oxides is found to be narrow, which results in poor electrical conductivity and hence leads to lowering the capacitance range. To overcome the discrepancy, the first strategy is conducting reinforcement via carbon-based EDLC electrode materials, conducting polymers, nanoporous, metals, and metal oxides. The next one is metal doping in oxides, which are considered to enhance the electrical conductivity of oxides.12,13 The electrochemical performance of supercapacitors is related to the preparation of electrodes such as carbon, transition metal oxides and conducting polymers. In general, steps are taken to prevent the agglomeration and to increase the conductivity of pseudocapacitors combined with strongly conducting support materials.14–16 For example, graphene has been regarded as an attractive substrate for pseudocapacitive materials due to its large surface area, high conductivity and good mechanical property. Graphene can be regarded as a building block of the other graphitic allotropes because of its electrical conductivity and to improve the properties of the composite material. In that view, graphene composites are widely used in outstanding energy storage applications. The excellent energy storage application is defined by the rate performance and power density.17–19 In the case of a pseudocapacitor, the rate of reaction is slower than the ionic adsorption and desorption when compared to the charge–discharge process of EDLCs. A faster faradaic reaction occurrs in the battery electrode because of the bulk redox process. As in the case of pseudocapacitors, only the surface redox process occurs. In general, metal hydroxides are actively involved in electrochemical redox reactions. In this present study, Co and Ni-based hydroxides have been chosen as active electrode materials for the supercapacitor applications due to their excellent electrochemical properties, which are closer to that of standard RuO2. Hence, in the present study, mixed-metal hydroxide composites such as nickel and cobalt hydroxides have been synthesized and characterized. Physical and chemical characterization studies were performed on the as-prepared double hydroxide materials.2. Experimental section
Nickel–cobalt hydroxide composites were obtained via a hydrothermal method. High-grade precursor materials such as nickel acetate, cobalt acetate, and potassium hydroxide were used as-received. Nickel acetate and cobalt acetate were taken in corresponding molar concentration ratio of 0.094 M and 0.06 M, respectively, and were completely dissolved in deionized water with the help of a magnetic stirrer. Moreover, a precipitating agent 1 M potassium hydroxide was prepared and added slowly dropwise into the nickel–cobalt acetate solution. When the precipitate was formed, cobalt and nickel acetate compounds were converted into cobalt and nickel hydroxides, indicated by a greenish precipitate, which was continuously stirred using a magnetic stirrer. The precipitate was washed repeatedly with distilled water, filtered, and dried overnight at 60 °C in a hot air oven. Standard characterization techniques were employed to study the composite material structure, morphology, and purity. The electrochemical measurements were carried out by employing a biologic SP 150 instrument. The electrode material consisted of 80 wt% active material Co–Ni(OH)2, 15 wt% conducting carbon, and 5 wt% PVDF-polyvinylidene hexafluoride as a binder. All the materials were mixed to make a uniform slurry using an N-methyl 2 pyrrolidine solvent. The slurry was coated on a nickel foam (active area 1 cm2) that acted as the current collector. Then, the electrode was dried overnight at 60 °C to evaporate the NMP solvent completely from the electrode. The same procedure was followed for the preparation of nickel hydroxide electrode. The as-prepared electrode was analyzed via electrochemical characterizations, such as cyclic voltammetry (CV), electrochemical impedance spectroscopy (EIS), and galvanic charge–discharge (GCD) studies.3. Results and discussion
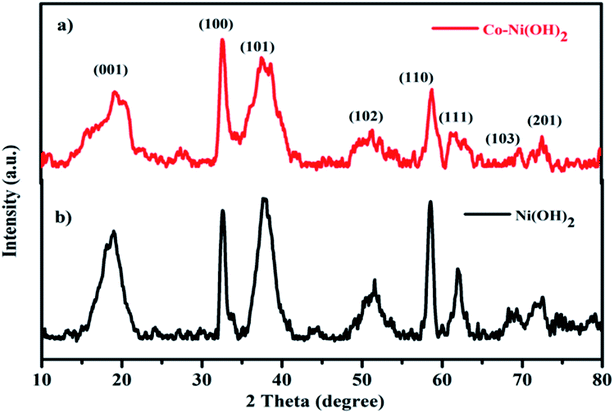
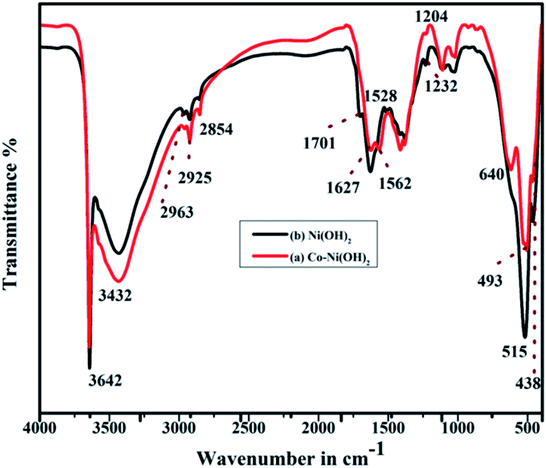
The obtained XRD patterns of bare Ni(OH)2 and mixed Co–Ni(OH)2 hydroxides are shown in Fig. 1(a and b). The observed results revealed that the obtained Ni(OH)2 and Co–Ni(OH)2 hydroxide phase structures well-matched with the data from standard JCPDS cards no-14-0117 and no-30-0443, respectively. The congruency of the peak positions of Ni(OH)2 and Co–Ni(OH)2 is attributed to the homogeneity of the physical and chemical properties of the as-prepared products. The pure hexagonal beta phase Ni(OH)2 showed characteristic peaks at 2 theta angles of 19, 32.60, 37.8, 51.45, 58.41, 61.96, 69.18 and 72.58°, corresponding to the of the (001), (100), (101), (102), (110), (111), (103) and (201) characteristic lattice planes, respectively. The composite Co–Ni(OH)2 also showed a similar phase structure and confirmed the structural purity of the composites.12 This may be due to the very low content of Co in Ni(OH)2, which meant that the Ni(OH)2 phase dominated the mixed hydroxide phase. The double peaks of the (101) plane may be due to the formation of the beta phase of Co(OH)2 in the composite. As in the case of Ni(OH)2, the plane only showed a single peak.Further, the bond formation is confirmed from the FTIR spectral analysis (Fig. 2a and b). The absorption spectra were recorded between 4000 and 500 cm−1 and revealed the chemical bonds present in the composite materials. The sharp peak at 3642 cm−1 refers to the hydroxyl groups (–OH) stretching vibration mode of the non-hydrogen bond. The peak observed at 3432 cm−1 indicates the hydrogen-bonded O–H group stretching vibration of hydroxide. The peaks at 2925 and 2854 cm−1 revealed the C–H vibration modes of CH2. The band observed at 1627 cm−1 revealed the bending vibrations of adsorbed water molecules, i.e., δO–H hydroxyl groups.13 The bands at 462 and 438 cm−1 are assigned to the Ni/Co–O vibrations attributed to Ni and Co–OH, respectively. The main signal observed at 515 cm−1 is attributed to the Ni–O–H bending vibrations.14
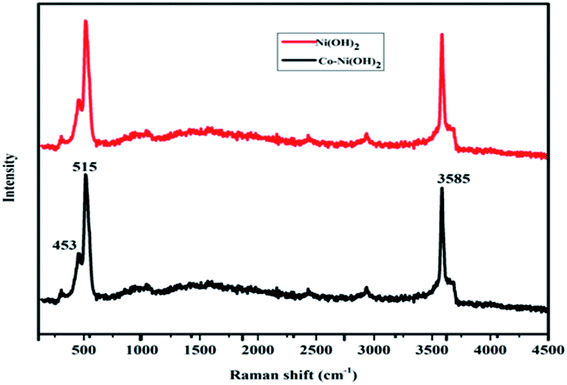
Furthermore, the structural properties of the as-prepared products were also studied by Raman spectroscopy. The obtained Raman spectra for nickel–cobalt hydroxide and nickel hydroxide are shown in Fig. 3. Three different modes of vibration are found at 453, 515, 3585 cm−1. The Raman mode observed in the region of 453 cm−1 is assigned to the A1g (T) mode of the Ni–OH stretching vibration. The high-intensity peak at 515 cm−1 (F2g) exhibited the CoO stretching mode. The sharp feature of the peak at 3585 cm−1 corresponds to the symmetric stretching of (O–H) groups. The obtained results indicated the presence of Co and the chemical state of the as-prepared composite active electrode materials. Moreover, Ni(OH)2 shows a peak at 453 cm−1, which indicates Ni(OH)2 formation.
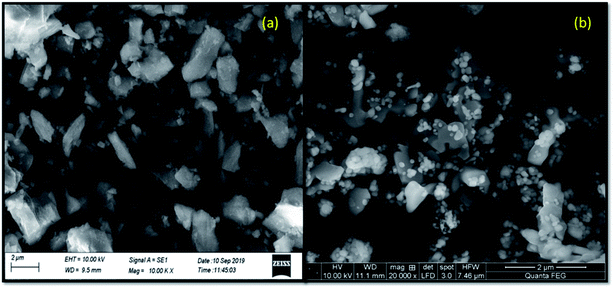
Further, the surface morphology of the obtained products was studied via SEM. It is observed that the sample showed the configuration of agglomerated particle nature (Fig. 4a and b) with distorted particle morphology and an approximate particle size between 1–2 μm.
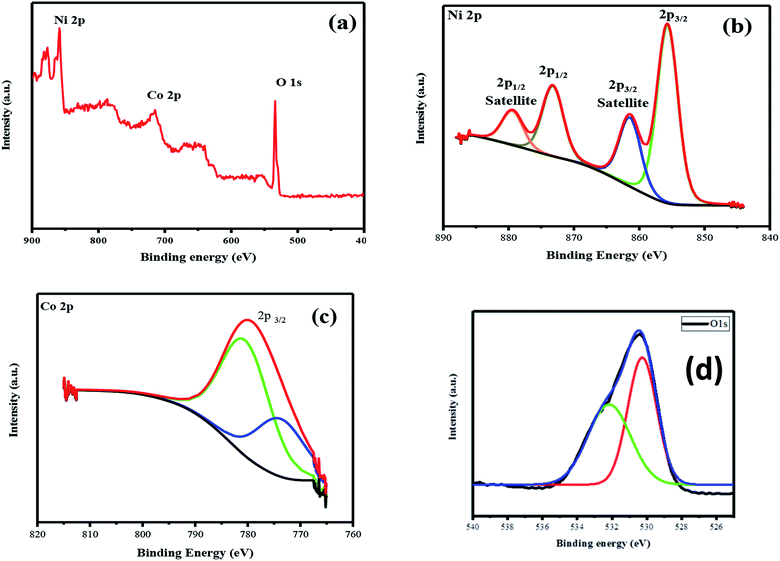
The XPS survey spectrum of the as-prepared product is shown in Fig. 5a–d. The survey spectrum showed peaks corresponding to the Ni, Co, and O elements in the samples (Fig. 5a). Ni 2p XPS spectrum showed peaks at 854.69 and 872.32 eV, which are ascribed to the presence of Ni 2p3/2 (Fig. 5b). Further, two satellite peaks were also observed at 861.54 and 879.89 eV, corresponding to Ni 2p1/2 (Fig. 5b). The magnitude of spin–orbit splitting is 17.56 eV and it denotes Ni(OH)2 phase evolution.20 Furthermore, the occupancy of Co in the nickel lattice is confirmed from the characteristic peak obtained at 780.21 eV, which is related to the Co 2p region (Fig. 5c).21 The presence of the Ni/Co–O and Ni/Co–OH groups was also determined from the binding energy peak obtained at 528.25 eV; besides, the peak obtained at 531.5 eV is recognized as low-coordinated oxygen defects (Fig. 5d).22 Thus, the obtained results indicate the presence of Co and the chemical state of the as-prepared composite active electrode materials. The obtained results also matched with those obtained via XRD- and Raman-based structural studies.
In general, CV is used to identify faradaic and non-faradaic reactions. A typical three-electrode cell configuration was used to investigate the as-prepared samples along with Ag/AgCl and Pt wire as the reference and counter electrodes, respectively. The as-prepared samples coated on nickel foam were used as the working electrode, and the loading of the active material was about 2 mg. A sufficient volume of a 6 M KOH aqueous solution was employed as an electrolyte. A set of strong redox peaks can be detected for the three-electrode cell configuration, which corresponded to the reversible reaction of Ni2+ ↔ Ni3+. The redox peak highlights the pseudo-capacitive behavior that occurred at the electrode/electrolyte interface. The corresponding kinematically reversible faradaic redox reactions involved in the electrochemical process are Ni(OH)2 + OH− ↔ NiOOH + H2O + e−; Co(OH)2 + OH− ↔ CoOOH + H2O + e−; CoOOH + OH− ↔ CoO2 + H2O + e−. In addition, the CV curves within the potential window of 0–0.6 V (vs. Ag/AgCl) were also evaluated. During the increase in the scan rate, the current increases and potential shifting of redox peaks may occur in the positive or negative region, this may be due to the increase in the scan rate that would cause a rise in the internal diffusion resistance within the pseudocapacitive material. The well-defined charge/discharge behavior in all curves demonstrates the existence of the redox reaction, thus confirming the results of CV. Fig. 6 shows a comparison of the normalized CV curve recorded at 10 mV s−1 scan rate for Ni(OH)2 and Co–Ni(OH)2. It was noted that the Co–Ni(OH)2 electrode showed a high current density than the bare Ni(OH)2 electrode. The peak potential was also shifted, and the peak separation potential was highly reduced, which indicates the enhanced behavior of Co–Ni(OH)2. This enhanced performance may be associated with conductivity related properties as revealed from the high current density of the CV curve. The oxidation peak confirmed the conversion of Ni(OH)2 to hydroxyl, which is a one-electron transfer reaction.22–28 However, the broader peak observed in the oxidation and reduction cycle confirms that the redox reaction is partially associated and occurs only at the surfaces. Thus, the reaction mechanism associated with the hydride materials was a pseudo-process, and hence the rate of reaction was also faster. Finally, the Co–Ni(OH)2 electrode performs at enormous functionality with distinctive properties when compared with the bare Ni(OH)2 electrode.
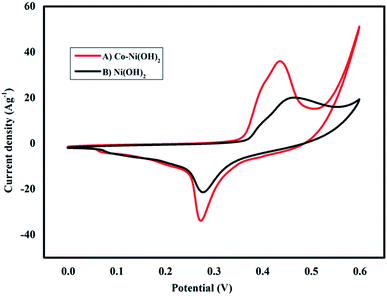 | ||
| Fig. 6 Cyclic voltammetry behaviors of (A) Co–Ni(OH)2 (B) Ni(OH)2 electrodes at the same scan rate of 10 mV s−1. | ||
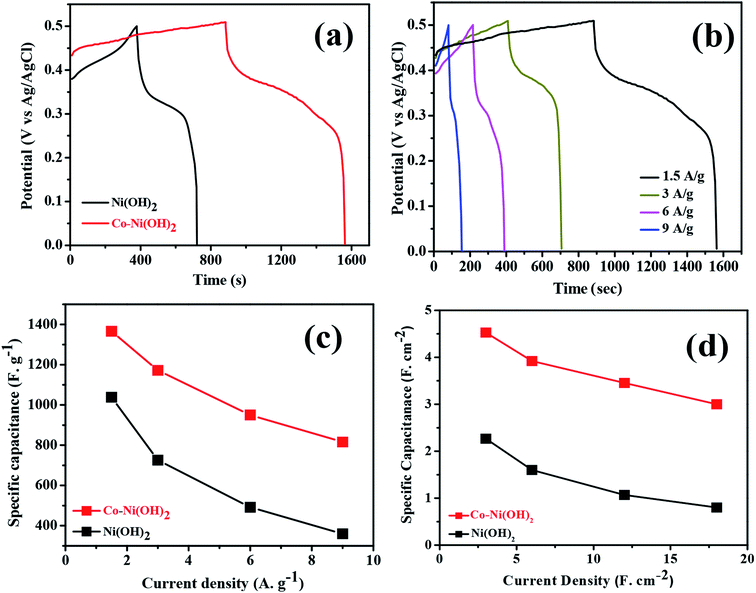
The galvanic charge–discharge process was conducted at room temperature for both Ni(OH)2 and Co–Ni(OH)2 materials. The operating voltage window range was fixed between 0 to 0.5 V to avoid over potential drop/higher polarization. The obtained GCD profile showed a non-linear shape for both Ni(OH)2 and Co–Ni(OH)2 as well correlated with the CV curve, and the recorded GCD profile is shown in Fig. 7. Fig. 7a shows a comparison of the GCD plot recorded at 1.5 A g−1. It was noted that Co–Ni(OH)2 showed a highly enhanced performance than Ni(OH)2. The observed results indicated the enhanced charge storage behavior of the mixed metal hydroxides. Fig. 7b shows the GCD profile of the sample Co–Ni(OH)2 tested at different current density ranges from 1.5, 3, 6, and 9 A g−1 and indicates the moderate rate capability of the sample when compared with the reported values.29–39 The specific capacitance is calculated at different current densities from GCD curves. Fig. 7c shows the comparison of Cs of both the electrode materials. The composite material showed high specific capacitance at all current densities than bare Ni(OH)2. The specific capacitance is calculated using the given formula: Cs = I × Δt/m × ΔV, where Cs is the specific capacitance, I is the applied current, Δt is the discharge time from GCD graph, m is the active material mass and ΔV is the potential. It was noted that the maximum specific capacitance is attained for the Co–Ni(OH)2 composite electrode. The composite Co–Ni(OH)2 electrode illustrated a maximum specific capacitance value of 1366 F g−1 at 1.5 A g−1, and the electrode retained almost 75% capacitance (907 F g−1) at a high current density of 9 A g−1. In addition, the calculated areal specific capacitance of the half cell is also plotted and is shown in Fig. 7d. To elucidate the electrode performance in terms of cycle life, the Co–Ni(OH)2 electrode was tested by a continuous GCD curve at a current density of 5 A g−1 (Fig. 8c). The determined cycle index for the electrode materials indicated excellent stability. The cell was investigated up to 2000 cycles, and the cell showed an excellent retention of 96.26%, as shown in Fig. 8b and hence, the metal hydroxide performance is profoundly revealed (Table 1).
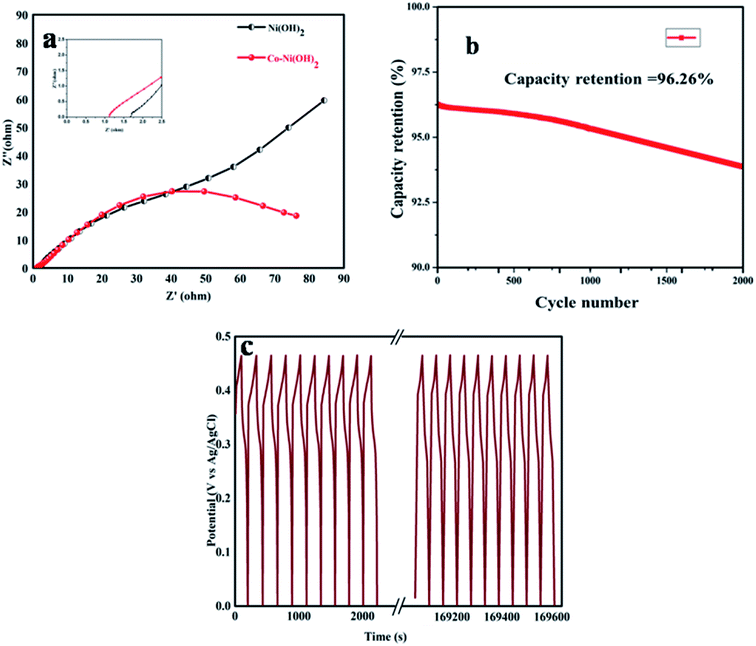 | ||
| Fig. 8 (a) EIS spectra of Ni(OH)2 and Co–Ni(OH)2, (b) cycle number vs. capacity retention% of Co–Ni(OH)2 (c) GCD cycling stability of Co–Ni(OH)2. | ||
| Method/process | Electrode material | Specific capacitance | Cycle number | Capacity retention | Reference |
|---|---|---|---|---|---|
| Microwave irradiation | NiO–MnO2@rGO ternary hybrids | 596 F g−1 at scan rate 20 mV s−1 | 2000 | 83.2% | 40 |
| Electrochemical deposition | Pd-E-ErGO hybrids | 1524.7 F g−1 at scan rate 20 mV s−1 | 2000 | 92.1% | 40 |
| Microwave irradiation | Co3O4 intercalated hybrid | — | 10![[thin space (1/6-em)]](https://www.rsc.org/images/entities/char_2009.gif) 000 000 |
55% | 38 |
| Microwave | Fe3O4–ONCs@rGO | — | 120 | 540 | 42 |
| Temperature reduction and covalent crafting of rGO | PTh-g-rGO | 230 F g−1 at scan rate of 1 mV s−1 | 5000 | 100% | 43 |
| Microwave assisted synthesis | Pd-rGO, Pd-NrGO | — | — | — | 44 |
| One pot microwave approach | Fe3O4/rGO hybrids | 455 F g−1 at scan rate 8 mV s−1 | 9500 | 91.4% | 45 |
| Microwave | GW-MCO ternary hybrids | 5627 F g−1 at scan rate 20 mV s−1 | 2000 | 92.3% | 41 |
To facilitate and estimate the resistive nature electrode materials, the electrodes were subjected to the EIS analysis. The EIS analysis of Ni(OH)2 and Co–Ni(OH)2 composite materials were performed at the 100 Hz to 100 kHz frequency range at 10 mV applied amplitude. The Nyquist plot was used to explore the behavior of solution resistance (Rs), faradaic charge transfer resistance (Rct), and the reaction mechanism associated with the electrode materials. It was noted that there was a small change in the Rs value of the electrodes. It may be due to the conductivity of the electrode materials (Fig. 8a: inset). One can expect a semi-circular region, but the obtained semicircle is incomplete; however, a linear spike was clearly observed at the low-frequency region for Ni(OH)2, whereas for Co–Ni(OH)2, a linear spike was not observed, which indicates a high diffusion rate of the Co–Ni(OH)2 sample and is well correlated with GCD results. The vertical line slope becomes abrupt due to the presence of cobalt. The Co–Ni(OH)2 electrode revealed the properties of small ohmic resistance and charge transfer resistance when compared to other electrodes. The observed result is due to electrolyte ionic diffusion rise and electrode material ionic conductivity based on Ni/Co ratios. Hence, the pseudo-capacity of Ni(Co)(OH)2 composites that were fabricated using the hydrothermal method was explored. The Co–Ni(OH)2 hybrid electrode exhibits about 30% higher specific capacitance compared to the Ni(OH)2 electrode. The charge–discharge performance at different current densities and for a long-time cycling test has been studied. Overall, the hybrid material exhibits advanced performance with application potentials.
4. Conclusions
A Ni-based mixed metal hydroxide composite was prepared, and the as-prepared materials were subjected to various structural studies such as XRD, Raman, FTIR, SEM, and XPS analysis. The electrochemical charge storage properties were investigated. Further, the obtained results were compared with those obtained for bare Ni(OH)2. Co–Ni(OH)2 samples showed high specific capacitance (1366 F g−1) than the bare Ni(OH)2 (1038 F g−1). It was observed that the sample having Co in the structure showed an excellent retention of 96.26% and excellent Rs and Rct values when compared with the bare Ni(OH)2. Thus, the as-prepared Ni-based mixed-metal hydroxide composite electrode has potential as a positive electrode in high energy aqueous supercapacitor applications.Conflicts of interest
There are no conflicts to declare.Acknowledgements
This article was supported by DST-FIST, UGC-SAP, PURSE and RUSA – Phase 2 grants vide Letter No. 24-51/2014-U, Policy (TNMulti-Gen), Dept. of Edn. Govt. of India, Dt.09.10.2018.References
- D. G. Nocera, Chem. Soc. Rev., 2009, 38, 13–15 RSC.
- S. Shafiee and E. Topal, Energy Policy, 2009, 37, 181–189 CrossRef.
- A. Burke, J. Power Sources, 2000, 91, 37–50 CrossRef CAS.
- J. R. Miller and A. F. Burke, Electrochem. Soc. Interface, 2008, 1, 53 Search PubMed.
- P. Simon and Y. Gogotsi, Nat. Mater., 2008, 7, 845–854 CrossRef CAS PubMed.
- C. C. Hu, W. C. Chen and K. H. Chang, J. Electrochem. Soc., 2004, 151, A281–A290 CrossRef CAS.
- P. Oliva, J. Leonardi, J. F. Laurent, C. Delmas, J. J. Braconnier, M. Figlarz and F. Fievet, J. Power Sources, 1982, 8, 229 CrossRef CAS.
- M. C. Bernard, P. Bernard, M. Keddam, S. Senyarich and H. Takenouti, Electrochim. Acta, 1996, 41, 91 CrossRef CAS.
- M. Rajamathi, G. N. Subbanna and P. V. Kamath, J. Mater. Chem., 1997, 7, 2293 RSC.
- S. Deabate and F. Henn, Electrochim. Acta, 2005, 50, 2823 CrossRef CAS.
- M. Fetcenko and D. Linden, in Handbook of Batteries, ed. T. B. Reddy, McGraw-Hill, 3rd edn, 2001, p. 3011 Search PubMed.
- H. Yang, et al., J. Alloys Compd., 2017, 703, 461–465 CrossRef CAS.
- A. Yao, et al., J. Alloys Compd., 2019, 772, 164–172 CrossRef CAS.
- R. Kumar, S. Saho, E. Joanni, R. K. Singh, W. K. Tan, K. K. Kar and A. Matsuda, Prog. Energy Combust. Sci., 2019, 75, 100786 CrossRef.
- R. Kumar, S. Sahoo, E. Joanni, R. K. Singh, R. M. Yadav, R. K. Verma, D. P. Singh, W. K. Tan, A. Pérez del Pino, S. A. Moshkalev and A. Matsuda, Nano Res., 2019, 12(11), 2655–2694 CrossRef CAS.
- R. Kumar, E. Joanni, R. K. Singh, D. P. Singh and S. A. Moshkalev, Prog. Energy Combust. Sci., 2018, 67, 115–157 CrossRef.
- R. Kumar, R. K. Singh, D. P. Singh, E. Joanni, R. M. Yadav and S. A. Moshkalev, Coord. Chem. Rev., 2017, 342, 34–79 CrossRef CAS.
- R. Kumar, R. K. Singh and D. P. Singh, Renew. Sustain. Energy Rev., 2016, 58, 976–1006 CrossRef CAS.
- R. Kumar, R. K. Singh and D. P. Singh, RSC Adv., 2016, 6(68), 64993–65011 RSC.
- X. P. Shen, J. Q. Sun, G. X. Wang, J. Park and K. M. Chen, Mater. Res. Bull., 2010, 45, 766–771 CrossRef CAS.
- A. L. Lorenzen, T. S. Rossi and M. Vidotti, J. Solid State Electrochem., 2016, 20, 2525–2531 CrossRef CAS.
- H. Ma, J. He, D.-B. Xiong, J. Wu, Q. Li, V. Dravid and Y. Zhao, ACS Appl. Mater. Interfaces, 2016, 3, 1992–2000 CrossRef PubMed.
- D. N. Futaba, et al., Nat. Mater., 2006, 5, 987–994 CrossRef CAS PubMed.
- Z. Q. Liu, et al., RSC Adv., 2003, 3, 4372–4380 RSC.
- P. Hermet, et al., Phys. Rev. B: Condens. Matter Mater. Phys., 2011, 84, 235211 CrossRef.
- J. L. Bantignies, et al., J. Phys. Chem. C, 2008, 112, 2193–2201 CrossRef CAS.
- X. Du, J. Fu and X. Zhang, Chem.–Asian J., 2019, 14, 3386–3396 CrossRef CAS PubMed.
- P. T. Babar, A. C. Lokhande, B. S. Pawar, M. G. Gang, E. Jo, C. Go, M. P. Suryawanshi, S. M. Pawar and J. H. Kim, Appl. Surf. Sci., 2018, 427, 253 CrossRef CAS.
- A. Roy, H. S. Jadhav, G. M. Thorat and J. G. Seo, New J. Chem., 2017, 4, 9546 RSC.
- X. Li, et al., J. Mater. Chem., 2012, 22, 14276–14283 RSC.
- J. Tiz fahma, et al., Colloids Surf., A, 2014, 443, 544–551 CrossRef.
- Y. Ren, et al., Int. J. Electrochem. Sci., 2012, 7, 12236–12243 CAS.
- S. Vijayakumar and G. J. Muralidharan, Electroanal. Chem., 2014, 727, 53–58 CrossRef CAS.
- D. D. Zhao, S. J. Bao, W. J. Zhou and H. L. Li, Electrochem. Commun., 2007, 9, 869–874 CrossRef CAS.
- M. Aghazadeh, A. N. Golikan and M. Ghaemi, Int. J. Hydrogen Energy, 2011, 36, 8674–8679 CrossRef CAS.
- Y. X. Wang, Z. Hub and H. Y. Wu, Mater. Chem. Phys., 2011, 126, 580–583 CrossRef CAS.
- D. Liang, S. Wu, J. Liu, Z. Tian and C. Liang, J. Mater. Chem. A, 2016, 4, 10609–10617 RSC.
- R. Kumar, H.-J. Kim, S. Park, A. Srivastava and Il-K. Oh, Carbon, 2014, 79, 192–202 CrossRef CAS.
- R. Kumar, R. Matsuo, K. Kishida, M. M. Abdel-Galeil, Y. Suda and A. Matsuda, Electrochim. Acta, 2019, 303, 246–256 CrossRef CAS.
- I. S. El-Hallag, M. N. El-Nahass, S. M. Youssry, R. Kumar, M. M. Abdel-Galeil and A. Matsuda, Electrochim. Acta, 2019, 314, 124–134 CrossRef CAS.
- R. Kumar, M. M. Abdel-Galeil, K. Z. Ya, K. Fujita, W. K. Tan and A. Matsuda, Appl. Surf. Sci., 2019, 481, 296–306 CrossRef CAS.
- R. Kumar, R. K. Singh, A. V. Alaferdov and S. A. Moshkalev, Electrochim. Acta, 2018, 281, 78–87 CrossRef CAS.
- S. K. Yadav, R. Kumar, A. K. Sundramoorthy, R. K. Singh and C. M. Koo, RSC Adv., 2016, 6, 52945–52949 RSC.
- R. Kumar, E. T. S. G. da Silva, R. K. Singh, R. Savu, A. V. Alaferdov, L. C. Fonseca, L. C. Carossi, A. Singh, S. Khandka, K. K. Kar, O. L. Alves, L. T. Kubota and S. A. Moshkalev, J. Colloid Interface Sci., 2018, 515, 160–171 CrossRef CAS PubMed.
- R. Kumar, R. K. Singh, A. R. Vaz, R. Savu and S. A. Moshkalev, ACS Appl. Mater. Interfaces, 2017, 9(10), 8880–8890 CrossRef CAS PubMed.
| This journal is © The Royal Society of Chemistry 2020 |

