 Open Access Article
Deformation mechanism in Al0.1CoCrFeNi Σ3(111)[1![[1 with combining macron]](https://www.rsc.org/images/entities/h2_char_0031_0304.gif) 0] high entropy alloys – molecular dynamics simulations
0] high entropy alloys – molecular dynamics simulations
Cuixia Liu *a,
Yuchia Yangb and
Zhenhai Xiab
aSchool of Materials Science and Chemical Engineering, Xi'an Technological University, Xi'an, Shaanxi 710021, China. E-mail: cuixialiu2016@sina.com
bDepartment of Materials Science and Engineering, Department of Chemistry, University of North Texas, Denton, TX 76203, USA
First published on 24th July 2020
Abstract
High entropy alloys (HEAs), composed of multiple components with equal or near atomic proportions, have extraordinary mechanical properties and are expected to bear the impact of high-speed forces in armor protection structure materials. In order to understand the deformation behaviour of HEAs under tensile and compressive loading, molecular dynamics simulations were performed to reveal the deformation mechanism and mechanical properties of three crystal structures: Al0.1CoCrFeNi HEAs without grain boundaries (perfect HEAs), Al0.1CoCrFeNi HEAs with grain boundaries of Σ3(111)[1![[1 with combining macron]](https://www.rsc.org/images/entities/char_0031_0304.gif) 0] (GBs HEAs) and grain boundaries of Σ3(111)[1
0] (GBs HEAs) and grain boundaries of Σ3(111)[1![[1 with combining macron]](https://www.rsc.org/images/entities/char_0031_0304.gif) 0] with chemical cluster HEAs (cluster-GBs HEAs). The mechanical properties of the three models at the same strain rate were discussed. Then, the mechanical properties at different strain rates were analyzed. The movement and direction of internal dislocations during the deformation process were investigated. The simulation results show that the GBs HEAs and the cluster-GBs both play an important role in the deformation and failure of the HEAs. Under tensile loading, three behaviour stages of deformation were observed. Cluster-GBs HEAs have a larger yield strength and Young's modulus than that of GBs and perfect HEAs. The higher the strain rate is, the greater the stress reduction rate. Under compressive loading, there are only two behaviour stages of deformation. Cluster-GBs HEAs also have the largest yield strength. Under tensile and compressive deformation, Shockley partial dislocations of 1/6 <112> are dominant and their moving direction and effect on mechanical properties are discussed.
0] with chemical cluster HEAs (cluster-GBs HEAs). The mechanical properties of the three models at the same strain rate were discussed. Then, the mechanical properties at different strain rates were analyzed. The movement and direction of internal dislocations during the deformation process were investigated. The simulation results show that the GBs HEAs and the cluster-GBs both play an important role in the deformation and failure of the HEAs. Under tensile loading, three behaviour stages of deformation were observed. Cluster-GBs HEAs have a larger yield strength and Young's modulus than that of GBs and perfect HEAs. The higher the strain rate is, the greater the stress reduction rate. Under compressive loading, there are only two behaviour stages of deformation. Cluster-GBs HEAs also have the largest yield strength. Under tensile and compressive deformation, Shockley partial dislocations of 1/6 <112> are dominant and their moving direction and effect on mechanical properties are discussed.
Introduction
High entropy alloys (HEAs) have attracted much attention owing to their extraordinary engineering properties, such as high strength at elevated temperatures, high hardness, superior ductility, excellent corrosion resistance, good wear resistance and high fatigue resistance.1–5 High entropy alloys with such excellent performance are expected to replace high-strength armor steel, which can bear the impact of high-speed forces in the armor protection structure of ships.6 These properties were achieved through multi-component design with equal or nearly atomic proportions to form simple solid-solution microstructures, such as face-centered cubic (FCC), body-centered cubic (BCC) or hexagonal closed-packed (HCP) microstructures. Compared with traditional alloys based on one or two key elements, HEAs contain five or more composition elements, which tend to form larger mixing entropies and become very stable.7–9 Among all the strengthening mechanisms, grain boundaries as a fundamental surface defect type have significant effects on the mechanical properties of HEAs.10 The grain size and strain rate of CoCrFeMnNi alloys are the main two factors affecting tensile properties.11 Sangid et al. calculated the energy barriers between slip–GB interactions with a new methodology and drew the stacking fault energy curve for slip in a perfect FCC material.12 In spite of these explorations of related theories, it is necessary to understand the different roles played by grain boundary in strengthening HEAs compared with traditional alloys.How the grain boundary affects the deformation behaviour and thus improves the mechanical properties of HEAs becomes a primary question for researchers. In previous work, Yu et al. observed that a CrFeCoNiPd alloy had higher continuous steady strain hardening than that in other single-phase HEAs with similar grain sizes at ambient temperature.13 They also hypothesized that plastic deformation at room temperature was primarily involved in the 1/2 <110> {111} full dislocation. Lu et al. simulated the deposition and annealing process of AlCoCrCuFeNi HEAs and observed that a phase of the cluster structure was transformed from BCC to FCC.14 The clustering in HEAs has a significant effect on the phase transition. Huang et al. simulated the glass transition temperature of Al–Cu–Cr–Fe–Ni HEAs using molecular dynamics (MD).15 Li et al. simulated the structural transformation process of a AlCrCoCuFeNi HEA at different cooling rates by molecular dynamics.16
Few studies have focused on the influence of the grain boundary on the strength of high entropy alloys. In order to elucidate the strengthening and toughening mechanisms in HEAs at the micro scale and enhance the mechanical properties for HEAs, the stacking fault for different local atomic configurations in a AlxCoCrFeNi HEA was calculated.17 It was interesting that not only negative stacking fault energy (SFE) and negative twin formation energy (TFE), but also notable fluctuations in the SFE and TFE in local regions were found. Dislocation also played an important role in the strengthening of HEAs. Based on this work, classical MD methods were employed to explore the deformation strengthening mechanism of AlxCoCrFeNi HEAs and the role of grain boundaries (GBs) in the HEAs. The GBs were determined by the coincident site lattice (CSL) method. The CSL of Σ3(111)[1![[1 with combining macron]](https://www.rsc.org/images/entities/char_0031_0304.gif) 0] was observed in HEAs within some experimental research works.18 The chemical clustering in HEAs has a significant effect on the GB energy and mechanical properties of the HEAs. In order to study the effects of different GBs on the mechanical properties of Al0.1CoCrFeNi HEAs, three models of Al0.1CoCrFeNi HEAs were established and MD simulations were carried out. The first one was the perfect crystal structure of Al0.1CoCrFeNi HEAs, which does not include any GBs (Abbrev. perfect HEAs). The second one was Al0.1CoCrFeNi HEAs with GBs of Σ3(111)[1
0] was observed in HEAs within some experimental research works.18 The chemical clustering in HEAs has a significant effect on the GB energy and mechanical properties of the HEAs. In order to study the effects of different GBs on the mechanical properties of Al0.1CoCrFeNi HEAs, three models of Al0.1CoCrFeNi HEAs were established and MD simulations were carried out. The first one was the perfect crystal structure of Al0.1CoCrFeNi HEAs, which does not include any GBs (Abbrev. perfect HEAs). The second one was Al0.1CoCrFeNi HEAs with GBs of Σ3(111)[1![[1 with combining macron]](https://www.rsc.org/images/entities/char_0031_0304.gif) 0] (Abbrev. GBs HEAs). The third one has GBs with chemical clusters, which were obtained through performing a simulated annealing MD simulation on Al0.1CoCrFeNi HEAs with GBs of Σ3(111)[1
0] (Abbrev. GBs HEAs). The third one has GBs with chemical clusters, which were obtained through performing a simulated annealing MD simulation on Al0.1CoCrFeNi HEAs with GBs of Σ3(111)[1![[1 with combining macron]](https://www.rsc.org/images/entities/char_0031_0304.gif) 0] (Abbrev. cluster-GBs HEAs). The quasi-static stretch of tensile and compressive loading was forced on the above three models to investigate deformation behavior.
0] (Abbrev. cluster-GBs HEAs). The quasi-static stretch of tensile and compressive loading was forced on the above three models to investigate deformation behavior.
Computational details
The first model, perfect HEAs of Al0.1CoCrFeNi, was built and relaxed at 25 °C, which kept one grain orientation (shown in Fig. 1). The atoms are colored according to the common neighbor analysis (CNA). In the following figures, the meaning of colors is the same as that of Fig. 1.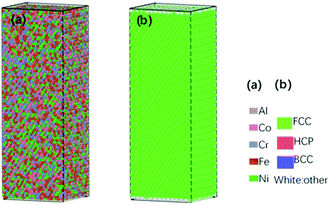 | ||
| Fig. 1 3D structures of perfect HEAs. (a) Different color means different element. (b) Different color means different crystal structure. | ||
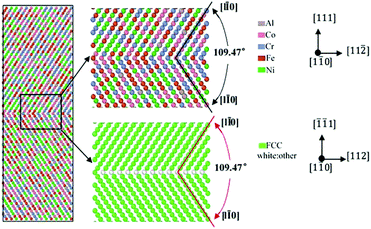
The second model was very significant. The interfacial structures of GBs HEAs were established based on the theory of CSL, in which two lattices are intertwined, translated and rotated with each other.19 When they reach a certain position, such as a special angle, parts of the above two lattices coincide with each other. The coincidence sites form the super lattice of a three-dimensional spatial lattice in space. For example, Σ3(111)[1![[1 with combining macron]](https://www.rsc.org/images/entities/char_0031_0304.gif) 0] indicates that in the mismatch direction in CSL, two grains have 1/3 lattice points coinciding with each other, where (111) is the GB plane and [1
0] indicates that in the mismatch direction in CSL, two grains have 1/3 lattice points coinciding with each other, where (111) is the GB plane and [1![[1 with combining macron]](https://www.rsc.org/images/entities/char_0031_0304.gif) 0] is the rotating axis contained within the GB plane, as shown in Fig. 2.
0] is the rotating axis contained within the GB plane, as shown in Fig. 2.
In Fig. 2, for the upper grain, the X-axis, Z-axis and Y-axis were [11![[2 with combining macron]](https://www.rsc.org/images/entities/char_0032_0304.gif) ], [1
], [1![[1 with combining macron]](https://www.rsc.org/images/entities/char_0031_0304.gif) 0], and [111], respectively, while they are [112], [1
0], and [111], respectively, while they are [112], [1![[1 with combining macron]](https://www.rsc.org/images/entities/char_0031_0304.gif) 0], and [
0], and [![[1 with combining macron]](https://www.rsc.org/images/entities/char_0031_0304.gif)
![[1 with combining macron]](https://www.rsc.org/images/entities/char_0031_0304.gif) 1] for the lower grain. The angle between two grains along the Y-axis was 109.47°. In the three directions, periodic boundary conditions were enforced. Each GB structure included two-twist grains interacting with each other. To avoid the self-interaction, the size of the GB model should be large enough to neglect the interactions of the boundary's strain field. Energy minimization was carried out to obtain the lowest-energy converged structure for determining the distance between the two twist GBs.20–23 The 3D structure of the symmetric twist grain boundary for Al0.1CoCrFeNi Σ3(111)[1
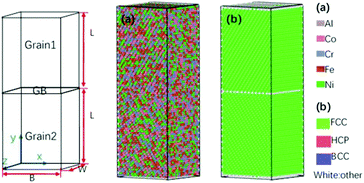
1] for the lower grain. The angle between two grains along the Y-axis was 109.47°. In the three directions, periodic boundary conditions were enforced. Each GB structure included two-twist grains interacting with each other. To avoid the self-interaction, the size of the GB model should be large enough to neglect the interactions of the boundary's strain field. Energy minimization was carried out to obtain the lowest-energy converged structure for determining the distance between the two twist GBs.20–23 The 3D structure of the symmetric twist grain boundary for Al0.1CoCrFeNi Σ3(111)[1![[1 with combining macron]](https://www.rsc.org/images/entities/char_0031_0304.gif) 0] HEAs is shown in Fig. 3.
0] HEAs is shown in Fig. 3.
The size of the GB model was calculated based on the following formulas (1) and (2). L, B and W were along the Y-axis, X-axis and Z-axis, respectively in Fig. 3. The minimum distance in the Y direction was equal or greater than 8 nm, while the X and Z direction for every grain was equal or greater than 5 nm.
 | (1) |
 | (2) |
The generated CSL GBs HEAs, containing about 46![[thin space (1/6-em)]](https://www.rsc.org/images/entities/char_2009.gif) 480 atoms, were subjected to energy minimization to obtain their global energy minimum structure. Afterwards, all atoms are in the most stable state of energy. As a consequence, the total GBs were in the minimum energy condition.
480 atoms, were subjected to energy minimization to obtain their global energy minimum structure. Afterwards, all atoms are in the most stable state of energy. As a consequence, the total GBs were in the minimum energy condition.
The third model was the solid solution including grain boundary under solidification of the second model, the aim of which was to obtain the original GBs of the solid solution with clusters and to study the effect of clustering. During the melting process, the second model was divided into an internal region and an external region (about 10 Å). The external region acted as a seed crystal, causing the internal region to grow into Σ3(111)[1![[1 with combining macron]](https://www.rsc.org/images/entities/char_0031_0304.gif) 0] GBs in the solidification process. Therefore, the internal region should be melted. Since the external region was fixed during melting, the pressure increased, which led to the increase of melting temperature. The melting temperature of this model was 3800 K, which was much higher than the experimental melting point for Al0.1CoCrFeNi HEAs at about 1450 °C.7 After the model was melted at 3800 K, the internal atoms were relaxed for a long enough time until no clusters were present and they became short-range disordered structures. The variation of diffusion coefficient and morphology with temperature are shown in Fig. 4(a). During the relaxation process, the relationship between the diffusion coefficient and relaxation time is shown in Fig. 4(b).
0] GBs in the solidification process. Therefore, the internal region should be melted. Since the external region was fixed during melting, the pressure increased, which led to the increase of melting temperature. The melting temperature of this model was 3800 K, which was much higher than the experimental melting point for Al0.1CoCrFeNi HEAs at about 1450 °C.7 After the model was melted at 3800 K, the internal atoms were relaxed for a long enough time until no clusters were present and they became short-range disordered structures. The variation of diffusion coefficient and morphology with temperature are shown in Fig. 4(a). During the relaxation process, the relationship between the diffusion coefficient and relaxation time is shown in Fig. 4(b).
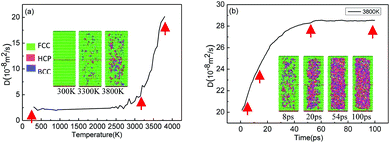 | ||
| Fig. 4 The variation of diffusion coefficient and morphology with temperature and time for cluster-GBs HEAs. (a) Different temperature. (b) Different time. | ||
It can be seen in Fig. 4(a), between 300 K and 3300 K, that the model transforms from the FCC structure to a mixture of BCC and HCP structures. The diffusion coefficient of the model is small (D = 2.65 × 10⁻⁸ m2 s−1) and nearly unchanged. After 3300 K, BCC and HCP structures become more dominant and the diffusion coefficient begins to increase sharply up to 20.8 × 10⁻⁸ m2 s−1 at 3800 K. This indicates that the model begins to melt at 3300 K and the atoms change from a long-range ordered structure to short-range disordered structure. In order to save calculation time, the model continues to heat up to 3800 K.
In Fig. 4(b), the diffusion coefficient continues to increase as the relaxing time increases until 54 ps where it tends to stabilize to 28.448 × 10⁻⁸ m2 s−1. The morphology also shows that the whole structure is mixed evenly between FCC, BCC and HCP, which indicates that the system is completely melted into a short-range disordered state at this time. With the increase of the relaxation time, the diffusion coefficient maintains a constant value, which indicates that the system is completely melted, and the third model is obtained by cooling the system.
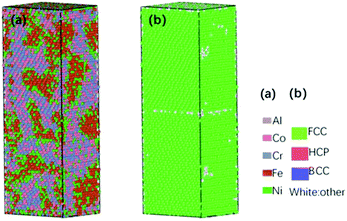
After sufficient quenching time, the model was cooled to room temperature, and then the quenching of atoms formed a crystal structure with GBs, as shown in Fig. 5.
During the process of MD simulations, periodic boundary conditions were applied in the three directions for the above three models. The interatomic interactions were described by an embedded atom method (EAM) proposed by Daw and Baskes.24,25 Ensemble is another critical factor in the simulation of HEA systems. In the tensile strength process, an isothermal-isobaric ensemble (NPT) was applied at 300 K, while a canonical ensemble (NVT) was enforced in the annealing process to obtain GBs. In a certain temperature range, the equations of motion were integrated with a time step of 0.01 fs using a Large-scale Atomic/Molecular Massively Parallel Simulator (LAMMPS).26 The visualization software for atomic structure was employed using an Open Visualization Tool (OVITO). The Burgers vector for dislocations in the processing of deformation was determined with the dislocation extraction algorithm (DXA) developed by Stukowski in OVITO.27
Results and discussions
The plastic properties are discussed in depth in this section. Based on the above three models, the quasi-static stretch including tensile loading and compressive loading was applied perpendicular to the GB direction with different strain rates including 6.2 × 10¹⁰ s−1, 1.2 × 10¹⁰ s−1, 6.2 × 10⁹ s−1, 1.2 × 10⁹ s−1 and 6.2 × 10⁸ s−1. The mechanical properties of three models at the same strain rate are discussed. Then, the mechanical properties at different strain rates were analyzed. The movement and direction of internal dislocations during the deformation process were investigated.Deformation behaviour analysis for tensile loading
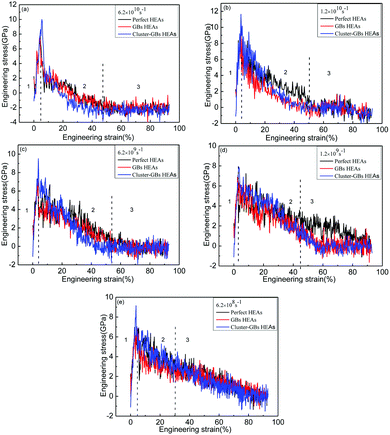
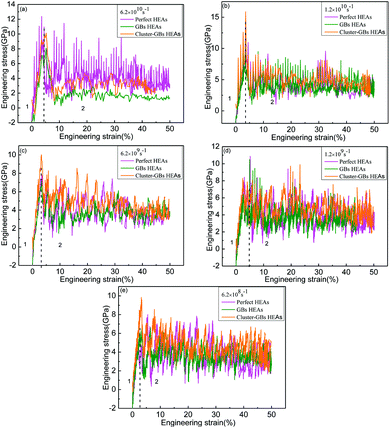
Fig. 6 presents the tensile engineering stress–strain curves of the atomic structure at different strain rates of the deformation process of perfect HEAs, GBs HEAs and cluster-GBs HEAs oriented in the <111> axis under tensile loading. Perfect HEAs, GBs HEAs and cluster-GBs Al0.1CoCrFeNi HEAs, under the tensile loading perpendicular to the GBs, all displayed linear elastic deformation at low strains, and non-linear elastic deformation at high strains (ε > 5%). Five curves of stress–strain (Fig. 6(a–e)) show similar stress–strain behaviour, which can be separated into three stages. The first stage is a linear elastic process. As the deformation continues, the stress rises to the peak and then drops down sharply. The third stage is progressive plastic deformation at low stress until the final structure breaks. The stress of cluster-GBs HEAs decreases more than that of other two models in the plastic deformation, that is to say, the decreased magnitude of the stress is the largest. The yield strength and Young's modulus of perfect HEAs, GBs HEAs and cluster-GBs are compared in Table 1. At the same strain rate, cluster-GBs HEAs have a larger yield strength and Young's modulus than that of GBs and perfect HEAs. For perfect HEAs, the dislocations may move quickly without any interference, which cause lower strength in perfect HEAs. For GBs HEAs, GBs may impede dislocation movement, so that the strength is higher than that of perfect HEAs. In cluster-GBs HEAs, high cluster density and GBs impede the dislocation motion, which greatly increases the strength and Young's modulus of cluster-GBs. With increasing strain rate, the yield strength of the three models increases, which also indicates that high strain results in high yield strength.28–30| 6.2 × 10¹⁰ s−1 | 1.2 × 10¹⁰ s−1 | 6.2 × 10⁹ s−1 | 1.2 × 10⁹ s−1 | 6.2 × 10⁸ s−1 | ||
| Young's modulus (GPa) | Perfect | 180 | 208 | 171 | 199 | 213 |
| GBs | 165 | 233 | 161 | 221 | 198 | |
| Cluster-GBs | 212 | 256 | 231 | 266 | 253 | |
| Yield strength (GPa) | Perfect | 7.77 | 7.37 | 7.0 | 6.48 | 6.67 |
| GBs | 7.43 | 8.56 | 7.28 | 6.85 | 6.88 | |
| Cluster-GBs | 10 | 11 | 9.49 | 7.94 | 9.1 | |
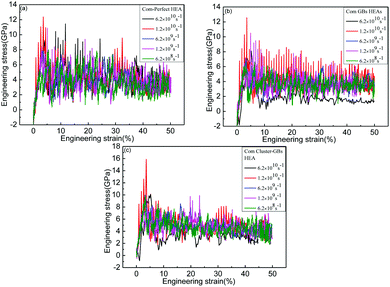
Fig. 7 shows the tensile engineering stress–strain curves at different strain rates for the three models. The higher the strain rate is, the greater the stress reduction rate after yield strength. For the strain rate of 6.2 × 10¹⁰ s−1, the decreased magnitude of stress is the largest.
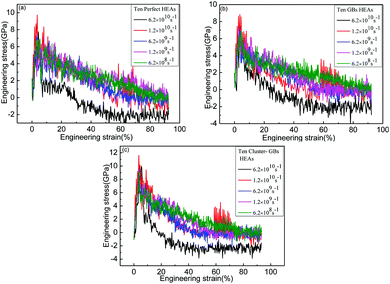 | ||
| Fig. 7 Tensile engineering stress–strain curves of deformation process oriented in <111> axis under tensile loading at different strain rate. (a) Perfect HEAs. (b) GBs HEAs. (c) Cluster-GBs HEAs. | ||
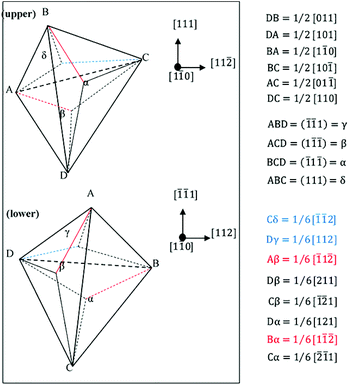
In the FCC crystal structure, there are only four types of dislocation that can occur at GBs according to the Thompson tetrahedron.31,32 In Al0.1CrCoFeNi Σ3(111)[1![[1 with combining macron]](https://www.rsc.org/images/entities/char_0031_0304.gif) 0] HEAs, the slip plane is also the {111} plane and two different grains are separated by the GBs, which is shown in Fig. 8. For the upper grain, the slip plane is (111), i.e., the ABC plane in the Thompson tetrahedron. ACD, BCD and ABD planes are the other three slip planes. When there is a dislocation at the GBs, it is quite possible that the dislocation may slip on one of these three planes. When the dislocation moves to the GBs, the dislocation line would be parallel to the three sides of the ABC slip plane, which is shown as AB, BC or AC. After that, the dislocation can become one of following four types: (1) a 60° perfect dislocation, (2) a 30° Shockley partial dislocation, (3) a 90° Shockley partial dislocation, and (4) a screw perfect dislocation. For the lower grain, the slip plane is ABD and the three slip planes are similar to that of the upper grain, which has been labelled clearly in the lower grain in Fig. 8.
0] HEAs, the slip plane is also the {111} plane and two different grains are separated by the GBs, which is shown in Fig. 8. For the upper grain, the slip plane is (111), i.e., the ABC plane in the Thompson tetrahedron. ACD, BCD and ABD planes are the other three slip planes. When there is a dislocation at the GBs, it is quite possible that the dislocation may slip on one of these three planes. When the dislocation moves to the GBs, the dislocation line would be parallel to the three sides of the ABC slip plane, which is shown as AB, BC or AC. After that, the dislocation can become one of following four types: (1) a 60° perfect dislocation, (2) a 30° Shockley partial dislocation, (3) a 90° Shockley partial dislocation, and (4) a screw perfect dislocation. For the lower grain, the slip plane is ABD and the three slip planes are similar to that of the upper grain, which has been labelled clearly in the lower grain in Fig. 8.
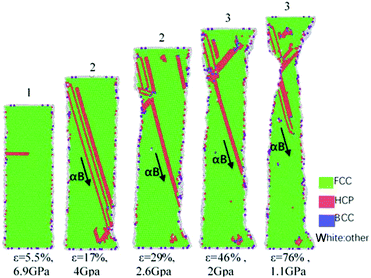
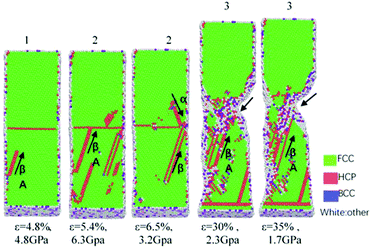
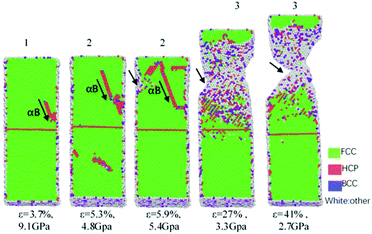
The Thompson tetrahedrons of tensile behaviour for perfect HEAs, GBs HEAs and cluster-GBs oriented in the <111> axis under tensile loading at a strain rate of 6.2 × 10⁸ s−1 (Fig. 6(e)) are shown in Fig. 9–11, respectively. The black arrow indicates the direction of dislocation motion at that moment and the specific direction is calibrated on one side. 1, 2 and 3 represent the three stages.
When a tensile loading of perfect HEAs is applied in Fig. 6(e), Fig. 9 indicates that a burgers vector αB, as the leading Shockley partial dislocations, appears in the grain and leads to fracture.
As shown in Fig. 10, there is a leading Shockley partial dislocation with Burgers vector βA appearing in the lower grain at the strain of 4.8%. With increasing strain, the Shockley partial dislocations begin to grow and propagate toward the GBs. When they meet the GBs, some of them disappear (ε = 5.4% in Fig. 10) and some of them merge or meet another Shockley partial dislocation (Burgers vector is αB) coming from the upper grain (ε = 6.5% in Fig. 10). The cross connection for the two Shockley partial dislocations coming from the two opposite grains forms an obvious defect area, which leads to the formation of critical crack sources (ε = 30% and 35% in Fig. 10), destroying the structural integrity of the GBs. The crack further grows and migrates until HEAs are fractured.
In comparison, the HEAs with GBs were quenched in order to form a lot of clusters. For the cluster-GBs HEAs, the deformation behaviour is shown in Fig. 11. It is notable that at this time, the burgers vector αB, as the leading Shockley partial dislocation, appears in the upper grain and moves toward the GBs. For the cluster-GB HEAs, several leading Shockley partial dislocations, which also have different orientations, join together at the intersection point on the left-upper angle (ε = 5.9% in Fig. 11). The intersection point becomes a crack source soon (ε = 27% in Fig. 11). The deformation mechanism is similar to that of the above GB HEAs.
During the deformation process, the detailed mechanism for the deformation and migration of the leading partial dislocations is shown in Fig. 12. It can be seen from Fig. 12 that initially the Shockley partial dislocations of 1/6 <112> nucleate on the {112} plane and then move forward to the GBs with increasing deformation. When these partial dislocations slip and are trapped by the GBs, they try to move along their orientation under tensile loading. However, the atoms on the GBs attempt to block the partial dislocation movement because they have different orientations. Following this, the GB surface begins to deform and form a jog. Finally, the GB surface moves and changes as deformation increases. It also shows that the nucleation and typical slip of the leading Shockley partial dislocations move along the GB surface. It migrates along 1/6 <112> on the {111} plane, which leads to the space variation of partial dislocations. Each nucleation, slip and migration of 1/6 <112> may change one layer for partial dislocation. Therefore, GBs may migrate along the deforming axis.
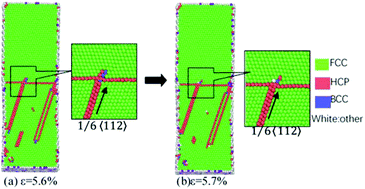 | ||
| Fig. 12 Nucleation and typical slip of the leading 1/6 <112> Shockley partial dislocations along GB surfaces. | ||
Deformation behaviour analysis for compressive loading
Fig. 13 presents the compressive engineering stress–strain curves at different strain rates of the deformation process of perfect HEAs, GBs HEAs and cluster-GBs HEAs in the <111> axis. From the curves of Fig. 13(a–e), it can be seen that under the compressive loading, the deformation process of the HEAs is roughly divided into two stages: elastic deformation and uneven plastic deformation (1 and 2 represent two stages). It can be clearly observed that the three structures all show a typical linear elastic mechanism in the process from compressive loading to peak stress. After this stage, the stress–strain curve shows a sudden downward trend and progressive plastic deformation under low stress with continuous loading. At this time, the stress value fluctuates up and down, which belongs to the stage of uneven plastic deformation. Comparison among the three compressive engineering stress–strain curves shown in Fig. 13(a) reveals that the perfect HEAs exhibit a larger fluctuation amplitude than the GBs and cluster-GBs HEAs at a strain rate of 6.2 × 10¹⁰ s−1. The reason may be that there is no defect in perfect HEAs and the critical stress is higher. It is difficult to start a slip system. Once the first slip system starts, the slip speed is fast. When this slip speed slows down, it is possible that twins appear and other slip systems start to slip, and the whole system continues to slip substantially. It is shown in Fig. 13 that the yield strength and Young's modulus of perfect HEAs are higher than that of GBs HEAs. The yield strength and Young's modulus of cluster-GBs HEAs are both still the largest, which also proves that cluster and GBs would increase the yield strength of HEAs.33–35The compressive engineering stress–strain curves at different strain rates for three structures are presented in Fig. 14. The variation trend is very similar to that of tensile strength. The higher the strain rate is, the greater the stress reduction rate. No matter which model, the decreased magnitude of the stress is the largest when the strain rate is 6.2 × 10¹⁰ s−1. The yield strength and Young's modulus of perfect HEAs, GBs HEAs and cluster-GBs are listed in Table 2.
| 6.2 × 10¹⁰ s−1 | 1.2 × 10¹⁰ s−1 | 6.2 × 10⁹ s−1 | 1.2 × 10⁹ s−1 | 6.2 × 10⁸ s−1 | ||
| Young's modulus (GPa) | Perfect | 248 | 252 | 250 | 260 | 266 |
| GBs | 251 | 249 | 246 | 244 | 253 | |
| Cluster-GBs | 229 | 285 | 299 | 292 | 276 | |
| Yield strength (GPa) | Perfect | 8.67 | 8.12 | 7.79 | 7.86 | 5.36 |
| GBs | 8.1 | 6.99 | 7.11 | 6.16 | 6.18 | |
| Cluster-GBs | 10.13 | 11.86 | 10.01 | 8.28 | 9.59 | |
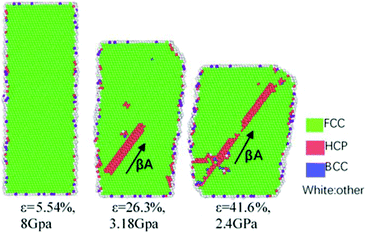
Under compressive loading, the Thompson tetrahedrons of tensile behaviour for perfect HEAs, GBs HEAs and cluster-GBs oriented in <111> axis at a strain rate of 6.2 × 10⁸ s−1 (Fig. 13(e)) are also dominated by Shockley partial dislocation, which is shown in Fig. 15–17, respectively. In Fig. 15, βA Shockley partial dislocations of 1/6 <112> nucleate and control the deformation of HEAs. In Fig. 16, in the initial stage, βA Shockley partial dislocations nucleate first in the lower grain and grow upward to GBs at the strain of 3.3%. βA Shockley partial dislocations continue to growth and want to reach GBs at the strain of 31.3%. After that, αB Shockley partial dislocations occur to slip in the upper grain (ε = 44.4% in Fig. 16). With increasing compressive loading, the Shockley partial dislocations merge with each other near the GBs and cause it to distort. At the same time, point defects, such as vacancies or interstitials, are observed in the compressive deformation, which is shown in Fig. 16 (where the arrow points when ε is 31.3%).
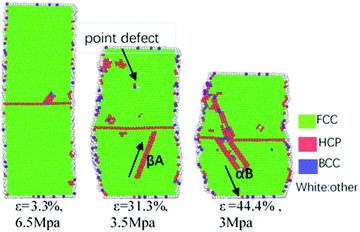 | ||
| Fig. 16 Compressive behaviour for GBs HEAs with Thompson tetrahedron. Different color means different crystal structure. | ||
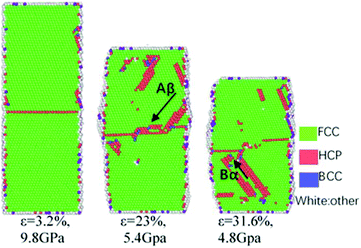
The main dislocations are βA and αB Shockley partial dislocations in the deformation of perfect HEAs and GBs HEAs. However, in the compressive behaviour of cluster-GBs HEAs in Fig. 17, it is clearly observed that Aβ and αB Shockley partial dislocations move downward to the cluster-GBs and are blocked by cluster-GBs (ε = 23% in Fig. 17). Aβ and αB Shockley partial dislocations form 60°, which could arrest crack propagation. Furthermore, due to the distortion of cluster-GBs HEAs, deformation for HEAs becomes difficult. This is the reason why cluster-GBs HEAs have the largest yield strength and Young's modulus.
Conclusions
In the present study, the deformation processes of the three forms of Al0.1CoCrFeNi Σ3(111)[1![[1 with combining macron]](https://www.rsc.org/images/entities/char_0031_0304.gif) 0] HEAs under tensile and compressive loading conditions were discussed. The quasi-static stretch, as an applied tensile and compressive loading, was imposed in the three models including perfect HEAs, GBs HEAs and cluster-GBs HEAs, which were oriented in the <111> axis with different strain rates, including 6.2 × 10¹⁰ s−1, 1.2 × 10¹⁰ s−1, 6.2 × 10⁹ s−1, 1.2 × 10⁹ s−1 and 6.2 × 10⁸ s−1, using MD simulations methods. The deformation mechanism for the HEAs under the tensile and compressive loading was studied. The main results show that under tensile loading, the three models all display three stages. The first stage is a linear elastic process. As the deformation continues, the stress rises to the peak and then drops down sharply. The third stage is progressive plastic deformation at low stress until the final structure breaks. The cluster-GBs HEAs display the largest decreased magnitude in the plastic deformation. At the same strain rate, cluster-GBs HEAs have the largest yield strength and Young's modulus. The higher the strain rate is, the greater the stress reduction rate. Under compressive loading, two behaviour stages of deformation are analyzed. Cluster-GBs HEAs also have the largest yield strength.
0] HEAs under tensile and compressive loading conditions were discussed. The quasi-static stretch, as an applied tensile and compressive loading, was imposed in the three models including perfect HEAs, GBs HEAs and cluster-GBs HEAs, which were oriented in the <111> axis with different strain rates, including 6.2 × 10¹⁰ s−1, 1.2 × 10¹⁰ s−1, 6.2 × 10⁹ s−1, 1.2 × 10⁹ s−1 and 6.2 × 10⁸ s−1, using MD simulations methods. The deformation mechanism for the HEAs under the tensile and compressive loading was studied. The main results show that under tensile loading, the three models all display three stages. The first stage is a linear elastic process. As the deformation continues, the stress rises to the peak and then drops down sharply. The third stage is progressive plastic deformation at low stress until the final structure breaks. The cluster-GBs HEAs display the largest decreased magnitude in the plastic deformation. At the same strain rate, cluster-GBs HEAs have the largest yield strength and Young's modulus. The higher the strain rate is, the greater the stress reduction rate. Under compressive loading, two behaviour stages of deformation are analyzed. Cluster-GBs HEAs also have the largest yield strength.
Under tensile or compressive loadings, the Shockley partial dislocations of 1/6 <112> were observed as the leading dislocation to slip during the deformation. However, there are different partial dislocations on the upper and lower grains. Their cross connections always become a crack source. The GBs always block the movement of those partial dislocations, while the partial dislocations distort the GBs. This deformation mechanism may be the main reason to lead to the extreme strength of HEAs.
Conflicts of interest
There are no conflicts to declare.Acknowledgements
This work was financially supported by the Natural Science Foundation of China (No. 51971166) and Key Laboratory of Shaanxi Provincial Education Department (No. 20JS055).References
- M. H. Tsai and J. W. Yeh, Mater. Res. Lett., 2014, 2(3), 107–123 CrossRef.
- J. W. Yeh, S. K. Chen, S. J. Lin, J. Y. Gan, T. S. Chin, T. T. Shun, C. H. Tsau and S. Y. Chang, Adv. Eng. Mater., 2004, 6, 299–303 CrossRef CAS.
- Y. Zhang, T. Zuo, Y. Cheng and P. K. Liaw, Sci. Rep., 2013, 3, 1455 CrossRef PubMed.
- B. Gludovatz, A. Hohenwarter, D. Catoor, E. H. Chang, E. P. George and R. O. Ritchie, Science, 2014, 345, 1153–1158 CrossRef CAS PubMed.
- M. A. Hemphill, T. Yuan, G. Y. Wang, J. W. Yeh, C. W. Tsai, A. Chuang and P. K. Liaw, Acta Mater., 2012, 60, 5723–5734 CrossRef CAS.
- D. Li, H. L. Hou, Z. Xi, C. H. Chen and M. Li, Review on Ballistic Impact Resistance of Ship Armor Protection Structure, Shipbuilding of China, 2018, 59, PP. 237–248 Search PubMed.
- C. Zhang, F. Zhang, H. Y. Diao, M. C. Gao, Z. Tang, J. D. Poplawsky and P. K. Liaw, Mater. Des., 2016, 109, 425–433 CrossRef CAS.
- L. J. Santodonato, Y. Zhang, M. Feygenson, C. M. Parish, M. C. Gao, R. J. K. Weber, J. C. Neuefeind, Z. Tang and P. K. Liaw, Nat. Commun., 2015, 6, 5964 CrossRef PubMed.
- Y. Zhang, T. T. Zuo, Z. Tang, M. C. Gao, K. A. Dahmen, P. K. Liaw and Z. P. Lu, Prog. Mater. Sci., 2014, 61, 1–93 CrossRef CAS.
- A. Sharma, P. Singh, D. D. Johnson, P. K. Liaw and G. Balasubramanian, Sci. Rep., 2016, 6, 31028 CrossRef CAS PubMed.
- F. Otto, A. Dlouhy, C. Somsen, H. Bei, G. Eggler and E. P. George, Acta Mater., 2013, 61, 5743–5755 CrossRef CAS.
- M. D. Sangid, T. Ezaz, H. Sehitoglu and I. M. Robertson, Acta Mater., 2011, 59(1), 283–296 CrossRef CAS.
- Q. Q. Ding, Y. Zhang, X. Chen, X. Q. Fu and Q. Yu, et al., Nature, 2019, 574, 223 CrossRef CAS PubMed.
- X. Lu, P. Brault, A. L. Thomann and J. M. Bauchire, Appl. Surf. Sci., 2013, 26276 Search PubMed.
- J. C. Huang, S. H. Chang and H. P. Chen, Adv. Mater. Res., 2012, 579, 398–406 CAS.
- Y. Li, M. Lv and H. Y. Liang, J. Comput. Theor. Nanosci., 2015, 12, 4649–4653 CrossRef CAS.
- Y. C. Yang, C. X. Liu, C. Y. Lin and Z. H. Xia, Scr. Mater., 2020, 178, 181–186 CrossRef CAS.
- H. Y. Yasuda, H. Miyamoto, K. Cho and T. Nagase, Mater. Lett., 2017, 199, 120–123 CrossRef CAS.
- D. G. Brandon, Acta Metall., 1966, 14, 1479–1484 CrossRef CAS.
- Q. Yin, Z. Q. Wang, R. Mishra and Z. H. Xia, AIP Adv., 2017, 7(1), 015040 CrossRef.
- P. R. M. van Beers, V. G. Kouznetsova, M. G. D. Geers, M. A. Tschopp and D. L. McDowell, Acta Mater., 2015, 82, 513–529 CrossRef CAS.
- B. Schönfelder, D. Wolf, S. R. Phillpot and M. Furtkamp, Interface Sci., 1997, 5, 245–262 CrossRef.
- J. Wang, N. Li and A. Misra, Magazine, 2013, 93, 315–327 CAS.
- M. S. Daw and M. I. Baskes, Phys. Rev. Lett., 1983, 50(17), 1285–1288 CrossRef CAS.
- M. S. Daw and M. I. Baskes, Phys. Rev. B: Condens. Matter Mater. Phys., 1984, 29(12), 6443–6453 CrossRef CAS.
- S. Plimpton, J. Comput. Phys., 1995, 117, 1–19 CrossRef CAS.
- A. Stukowski, Modell. Simul. Mater. Sci. Eng., 2010, 18, 015012 CrossRef.
- G. Sainath and B. K. Choudhary, Phys. Lett. A, 2015, 379, 1902–1905 CrossRef CAS.
- P. T. Li, Y. Q. Yang, Z. H. Xia, X. Luo, N. Jin, Y. Gao and G. Liu, RSC Adv., 2017, 7, 48315–48323 RSC.
- G. J. Shi, J. G. Wang and Z. Y. Hou, et al., Mod. Phys. Lett. B, 2017, 31(27), 1750247 CrossRef CAS.
- G. Sainath and B. K. Choudhary, Philos. Mag., 2016, 96(32–34), 3502–3523 CrossRef CAS.
- A. Stukowski and K. Albe, Modell. Simul. Mater. Sci. Eng., 2010, 18, 025016 CrossRef.
- M. Feuerbacher, M. Heidelmann and C. Thomas, Philos. Mag., 2015, 95, 1221–1232 CrossRef CAS.
- Y. T. Zhu, X. L. Wub, X. Z. Liao, J. Narayan a, L. J. Kecskés and S. N. Mathaudhu, Acta Mater., 2011, 59, 812–821 CrossRef CAS.
- A. J. Cao, Y. G. Wei and S. X. Mao, Appl. Phys. Lett., 2007, 90, 151909 CrossRef.
| This journal is © The Royal Society of Chemistry 2020 |

