 Open Access Article
Interaction effects on a gold nanoparticle-based colorimetric assay for antioxidant capacity evaluation of polyphenols†
Yanhui Wanga,
Shiqi Liua,
Mengnan Yanga,
Ahmed Aboueloyoun Tahaa,
Jing Wangb and
Chao Ma *a
*a
aBeijing Key Laboratory of Forest Food Processing and Safety, College of Biological Sciences and Biotechnology, Beijing Forestry University, Beijing, 100083, PR China. E-mail: machao@bjfu.edu.cn; Tel: +86-10-6233-6700
bInstitute of Quality Standard and Testing Technology for Agro-products, Chinese Academy of Agricultural Sciences, Beijing, 100081, China
First published on 17th April 2020
Abstract
A gold nanoparticle (AuNP)-based colorimetric assays have been applied to evaluate the total antioxidant capacities (TAC) of various food samples, while the potential endogenous polyphenol interaction effects on the AuNP assays are less explored. In this work, 12 representative polyphenols were strategically selected, and their corresponding AuNPs were synthesized and characterized by UV-Vis spectroscopy and transmission electron microscopy, which conformed the formation of AuNPs. Then, the TAC of the polyphenols, alone and in their equimolar binary or ternary combinations, were estimated and their synergistic effects were evaluated. In addition, the matrix effects of endogenous components from 6 kinds of foods on the recovery of the TAC estimation of gallic acid and rutin were evaluated. Markedly stronger interaction effects and matrix effects were observed in the AuNP assay than in conventionally well-established methods, indicating that the validation and application of the AuNP assay for TAC evaluation should be fully studied and explored.
Introduction
Over the past few decades, many studies have demonstrated the high relevance of the total antioxidant capacity (TAC) of phenolic compounds to their remarkable health-promoting benefits.1–3 Therefore, the determination of the TAC of polyphenolic compound-rich or enriched foods, nutraceuticals and other dietary supplements has become fundamental in the food industry.5 Several in vitro chemical-based methods, with different advantages and disadvantages, have been critically evaluated and extensively applied including 1,1-diphenyl-2-picrylhydrazyl (DPPH) and 2,2-azino-bis-(3-ethylbenzothiazoline-6-sulfonic acid) diammonium salt (ABTS) radical scavenging assays and ferric reducing antioxidant power (FRAP) assay.6 However, despite the number of TAC analytical methods, there is no well-validated and standard quantitative method that can provide a reliable and adequate evaluation of the TAC due to the complexity of chemical composition and antioxidant action. Thus, it is still desirable to develop novel approaches for TAC estimation.7Recently, the spectrophotometric methods based on the formation of metal nanoparticles have been proposed to evaluate the TAC of a wide variety of food samples.8–10 Among these metal nanoparticles, gold nanoparticles (AuNPs) and silver nanoparticles (AgNPs) have received special attention due to their intrinsic characteristics such as ease of preparation, biocompatibility, stability and high extinction coefficients.11–13 In pioneering studies, it was demonstrated that a series of phenolic acids14–16 and flavonoids15 could act as active reductants for the catalytic growth of AuNPs and AgNPs, and the optical properties of the AuNPs/AgNPs generated were found to be well correlated with their antioxidant power with good linearity, precision, accuracy and sensitivity.
However, separating each phenolic compound and studying it individually is costly and sometimes unavailable, because many unknown compounds could occur in the final extracts. In addition, the polyphenols present in a mixture can interact, and their interactions can affect the TAC of whole food extracts, as elucidated in conventional well-established methods.17 Therefore, when the objective is to evaluate the TAC of a combination of several polyphenols or a whole food extract, possible interaction among the endogenous polyphenolic compounds and even other components could influence the TAC since the formation of AuNPs in situ is generated by the overall action of all endogenous antioxidants. Despite the AuNPs based assay has been applied to estimate the TAC of various food samples such as brassica oilseeds, white flakes, meal, Chinese rice wine, Zhuyeqing liquor, soybean, Tagetes lucida, Mentha piperita, Cynara scolymus, Cymbopogon citratus and Calendula officinalis,4,7,18 the possible polyphenol interaction effects on the formation and the optical properties of AuNPs generated by polyphenol-mediated method have been less explored, which could lead to underestimate or overestimate the TAC. Herein, the interaction effects among the polyphenolic components and the matrix effects of endogenous components in foods on the TAC estimation was demonstrated.
Experimental
Materials and standards
DPPH, ABTS, 2,4,6-tripyridyl-s-triazine (TPTZ), 6-hydroxy-2,5,7,8-tetramethylchroman-2-carboxylic acid (Trolox), Folin–Ciocalteu's phenol reagent and chloroauric acid (40–50% Au based) were purchased from Macklin (Shanghai, China). All polyphenol standards including gallic acid, protocatechuic acid, caffeic acid, vanillic acid, ferulic acid, p-coumaric acid, apigenin, luteolin, rutin, quercetin, epigallocatechin (EGC) and epigallocatechin gallate (EGCG) were purchased from the Spring & Autumn Biological Engineering (Nanjing, China) with purity over 98%. Standard stock solutions of the polyphenol standards were prepared with methanol. Analytical grade methanol, ethanol, hydrochloric acid and acetic acid were purchased from Beijing Chemical Factory (Beijing, China). Ferrous sulfate heptahydrate, potassium persulfate, anhydrous sodium dihydrogen phosphate, sodium carbonate, sodium acetate trihydrate and ferric chloride were all analytical grade purchased from the Sino Pharm Chemical Reagent (Shanghai, China). Water was purified using Milli-Q from Millipore (Bedford, MA, USA). Raspberries (Rubus idaeus L.), apples (Malus domestica), grapes (Vitis vinifera cv. Kyoho), tangerines (Citrus reticulata Blanco), red peppers (Capsicum annuum sp.) and tomatoes (Solanum lycopersicum) used in the study were purchased from Wumei Supermarket (Beijing, China).Evaluation of antioxidant capacities by AuNPs assay
The AuNPs were synthesized according to a method reported recently.4 Briefly, 1.0 ml of acetic buffer (pH 4.6, 0.2 mM) and 1.0 ml of chloroauric acid (3.9 mM, pre-incubated at 60 °C for 10 min) were transferred into a 20 ml centrifuge tube, and then 0.5 ml of equimolar polyphenolic solutions were added, followed by addition of 7.5 ml of distilled water. The mixed solution was stirred for 2 min with a pulsing vortex mixer and then incubated at room temperature for 1 hour in the dark. Finally, AuNPs colloidal solutions were obtained and the absorbance at 540 nm was recorded. The antioxidant capacities of the polyphenolic compounds were calculated using the calibration curve of Trolox, and expressed as mM Trolox equivalent (TE)/g sample.Characterization of AuNPs
The UV-Vis spectra in the range of 400 and 800 nm of each AuNPs colloidal solution were recorded using a 1 cm quartz cell in a Shimadzu UV-1601 spectrophotometer (Shimadzu, Kyoto, Japan). The morphology of the AuNPs synthesized using 12 polyphenol compounds was observed using a transmission electron microscope (TEM, Hitachi, H-7650, Japan) at 80 KV by dropping a small droplet (10 μl) of the AuNPs colloidal solution on a carbon-covered microgrid (100 mesh) and the solvents were evaporated under ambient conditions before testing. The average size of AuNPs was also measured by the Dynamic Light Scattering (DLS) Analyzer (Malvern, ZetasizerNano ZS 90, Britain) at 25 °C.Evaluation of polyphenol interaction effects on AuNPs assay
12 combination samples of 12 individual polyphenols were prepared, including 3 combinations of two kinds of phenolic acids (gallic acid + protocatechuic acid, gallic acid + caffeic acid, caffeic acid + ferulic acid), 2 combinations of two kinds of flavonoids (rutin + quercetin, luteolin + rutin), 2 combination of two kinds of phenolic acids and flavonoids (gallic acid + rutin, gallic acid + EGC), 1 combination of three kinds of phenolic acids (gallic acid + vanillic acid + ferulic acid), 1 combination of three flavonoids (luteolin + rutin + EGC) and 3 combination of three kinds of phenolic acids and flavonoids (gallic acid + rutin + EGC, gallic acid + quercetin + rutin, EGC + ferulic acid + luteolin). The molar concentration of each polyphenolic compound in the final combination is the same, and the antioxidant activities of individual and combined polyphenols were measured, calculated and expressed as mM TE per g according to the method described above. The variation of observational and theoretical TAC was calculated as below with modification of the equation of synergic effects in literatures.19| Variation = (AO − AT)/AT × 100% = (AO − ∑Ai)/∑Ai × 100% |
Evaluation of matrix effects on AuNPs assay
6 kinds of vegetable and fruit including raspberries, apples, grapes, tangerines, red peppers and tomatoes were selected to demonstrate the influence of the endogenous components on the estimation of antioxidant capacities of gallic acid and rutin when spiked. All extracts were prepared using a modified ultrasound-assisted extraction method reported previously.22 In brief, 20 g fresh fruits and vegetables were homogenized for 5 min in 60 ml of aqueous acetone solution 80% (v/v) using a blender. After which, samples were ultrasonicated in an ultrasound probe system (70% of nominal power) for 5 min, and the homogenates were centrifuged at 1000 rpm for 5 min to obtain supernatant for further analysis. The total polyphenolic contents (TPC) and total flavonoids contents (TFC) in each sample were determined using Folin–Ciocalteu assay23 and aluminum chloride colorimetric assay,24 and expressed as mg gallic acid (GAE) and rutin (RE) equivalents per gram samples, respectively. Then, 2.5 ml of gallic acid or rutin solution was spiked into 2.5 ml of polyphenol extracts, and the molar concentration of gallic acid and rutin spiked in each extract was set equal to the corresponding TPC and TFC, respectively. The TAC of the crude and the spiked extracts were measured in AuNPs assay and well-established assays, and the recovery of the antioxidant capacities of gallic acid or rutin were calculated using the following equation:| Recovery% = (A − AC)/AS × 100% |
Reference assays
For comparison, three well-established TAC assays, such as DPPH and ABTS radical scavenging assay and FRAP assay were carried out according to the methods previously reported.25–27 In each assay, a calibration curve of Trolox was plotted and the antioxidant activities of all samples obtained were expressed as mM TE per g.Statistical analysis
The structure diagrams of the polyphenols were obtained using ChemDraw 18 (PerkinElmer, USA). All analysis was carried out in at least triplicate throughout the experiment, and data were presented as mean ± standard deviations (SD). Analysis of variance (ANOVA) and Duncan's new multiple range test were estimated using SPSS 25.0 (SPSS Inc., Chicago, IL, USA), with a statistically significant difference at the 95% confidence level. Correlation analysis was obtained using Pearson correlation method with a probability level of p < 0.05. Calibration curve was plotted using Origin 8.5 (Origin Lab Corp., USA).Result and discussion
Formation and characterization of AuNPs
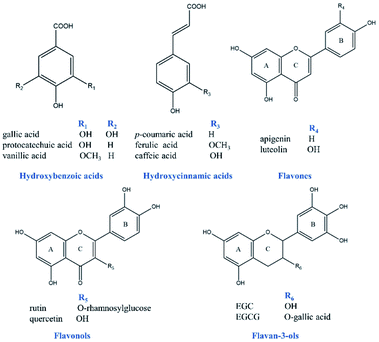
Previous studies have demonstrated that the formation of AuNPs is based on the electron transfer reaction between the gold ions and reductants.12,28 Specifically, the hydroxyl groups, especially phenol groups present in polyphenolic compounds reduce gold ions with higher chemical valence (Au3+) to the ions with lower chemical valence (Au0), and the polyphenolic compounds are oxidized to the corresponding benzoquinone structure. Meanwhile, the gold ions are reduced to AuNPs, resulting in the significant color changes and absorption peaks in the UV-Vis spectra.28 In order to evaluate in depth the effects of chemical structures and corresponding antioxidant activities of polyphenols on the morphology and optical characteristics of AuNPs, five prominent classes of representative polyphenols (shown in Fig. 1) were strategically chosen, including 3 hydroxybenzoic acid (gallic acid, protocatechuic acid, vanillic acid), 3 hydroxycinnamic acid (caffeic acid, ferulic acid and p-coumaric acid), 2 flavonols (rutin, quercetin), 2 flavan-3-ols (EGC, EGCG) and 2 flavone (apigenin, luteolin) as reductants to produce AuNPs. These polyphenolic compounds have different amount of phenol groups, which would lead to different antioxidant activities.7,11The reaction conditions of AuNPs synthesis have significant impact on the color and UV-Vis spectra of gold colloidal solutions and the morphology of AuNPs, and many studies have been carried out to optimize the reaction conditions. In the present work, the synthesis of AuNPs was carried out under an optimized condition reported recently,4 with pH 4.6, reaction at room temperature for 1 hour in the dark. During the process of synthesis, the color change of the gold colloidal solutions was monitored, and the final color of each solution following incubation (with the same molar concentration of 6.0 mM) was shown in Fig. 2 (insets top right). It could be clearly seen that the color of gold colloidal solutions formed by EGC, EGCG, quercetin, luteolin, gallic acid, rutin, ferulic acid, p-coumaric acid and apigenin appeared purplish red, despite their color intensity were quite different when the same concentration of polyphenols was added. By comparison, the gold colloidal solution formed by caffeic acid, vanillic acid and protocatechuic acid changed to bluish violet, black green or orange-yellow, respectively. These distinct optical properties of different AuNPs could be attributed to their localized surface plasmon resonance (LSPR), which is sensitive to the shape, size, and the local refractive index near the surface of AuNPs.29
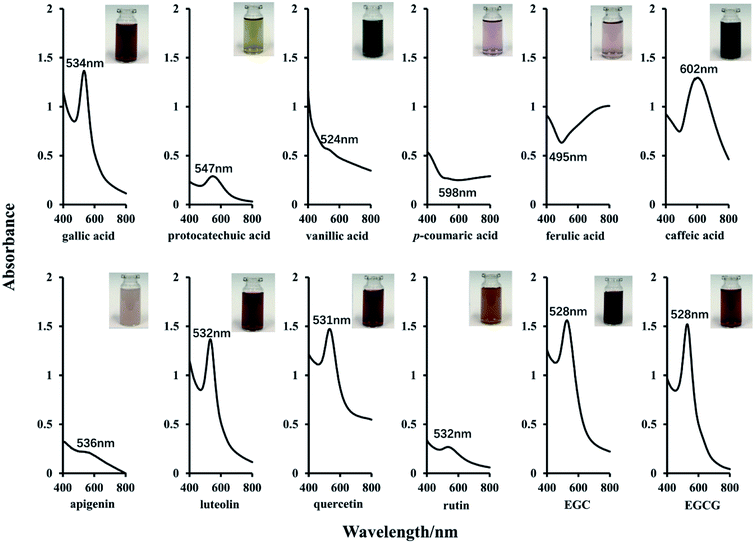 | ||
| Fig. 2 UV-Vis spectra and color images of AuNPs colloidal solutions formed by 12 different polyphenolic compounds. | ||
To further demonstrate the optical characteristics of the AuNPs, the UV-Vis absorption spectra of all gold colloidal solutions obtained were recorded. As shown in Fig. 2, strong absorption bands at around 540 nm were observed in the UV-Vis spectra of solutions formed using EGC (528 nm), EGCG (528 nm), quercetin (531 nm), luteolin (532 nm) and gallic acid (534 nm), and weak absorption bands at around 540 in those of protocatechuic acid (547 nm), rutin (532 nm) and apigenin (536 nm) were found. However, no obvious absorption bands were observed in the solution formed by ferulic acid, p-coumaric acid and vanillic acid, and a strong peak at 602 nm was observed in the solution formed by caffeic acid. The absorption band at round 540 nm is usually regarded as LSPR extinction peak, which corresponds to the so-called transversal plasmon.18 The spectral shifts of the LSRP extinction peak are usually attributed to the local refractive index change and self-assembly of the AuNPs.29 These formation of the distinct LSPR peak is usually considered as indicators of the formation of AuNPs.7,11 The distinct peak was observed in EGC, EGCG, quercetin, luteolin, and gallic acid, which are consistent with those reported in literatures, indicating the success of AuNPs generation. However, neither the color nor LSPR distinct peak of the gold colloidal solutions of caffeic acid, ferulic acid and p-coumaric acid and vanillic acid agreed with those found in literatures.30,31
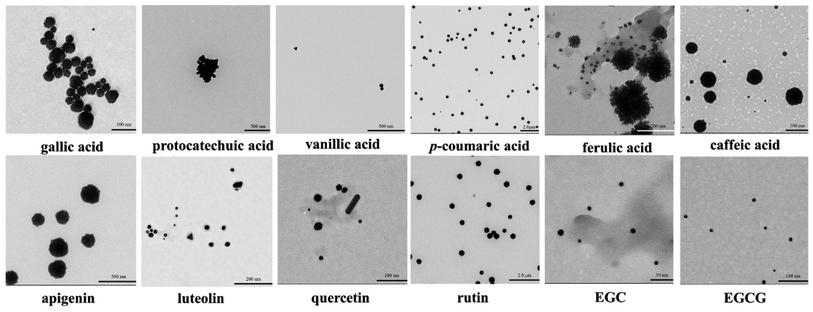
To confirm the formation of AuNPs and to obtain the information about the morphology characteristics of the AuNPs such as shape and size, all gold colloidal solutions obtained using 12 polyphenolic compounds were characterized by TEM. As is apparent from Fig. 3, AuNPs were clearly observed in all solutions, but the shape and size of them were quite distinct from each other. EGC, EGCG, quercetin, luteolin, and gallic acid drove the formation of very well-dispersed nanoparticles with average diameters less than 100 nm. The AuNPs formed using caffeic acid, vanillic acid, p-coumaric acid, rutin and apigenin were also well dispersed, but their size was much larger. By comparison, the AuNPs formed using protocatechuic acid and ferulic acid were not well dispersed at all. These observations indicated that the color and the LSPR peak shift significantly depended on the size of the AuNPs.
It seemed that the larger the AuNPs formed the lower absorption intensity was observed, as described in literature.18 Also, the LSPR band red shifted with larger particles, which could be attributed to electromagnetic retardation32,33 and the changes of the distance between AuNPs,34 because the inherent properties of localized surface plasmon resonance of AuNPs are related to the size, shape, composition, inter-particle distance and dielectric constant of the surrounding medium.11
Evaluation of antioxidant capacities of individual polyphenol based on AuNPs assay
Since the optical properties of the polyphenol-mediated generated AuNPs have been found correlated well with the antioxidant activities of the corresponding polyphenols, and the absorbance signals of the gold colloidal solutions are linearly dependent upon the concentration of the polyphenols, the AuNPs assay has been applied for estimating the antioxidant capacities of polyphenols.18 In the present study, the antioxidant capacities of the selected 12 polyphenols were estimated using AuNPs assay and 3 well-established conventional assays including DPPH, ABTS and FRAP assays, and the results were all expressed as mM TE per g as shown in Table S1† and Fig. 4A. As expected, we found that the polyphenols' antioxidant capacities vary depending upon their chemical structures, as demonstrated in literatures. Specifically, the number of the phenolic hydroxyl groups is found to be a crucial factor for their antioxidant capacities.35 Among the 12 polyphenols tested, three pairs showed higher antioxidant capacities due to the more hydroxyl groups they possess (gallic acid > protocatechuic acid, caffeic acid > p-coumaric acid, luteolin > apigenin) in all assays. Also, the level of hydroxylation, the positions of the hydroxyl groups, and the hydroxyl-substituted groups as well as the existence of conjugated double bonds can also affect their antioxidant capacities.36 Like in the case of rutin and quercetin, the substituted hydroxyl group in rutin resulted in attenuated antioxidant capacities in all assays compared to quercetin.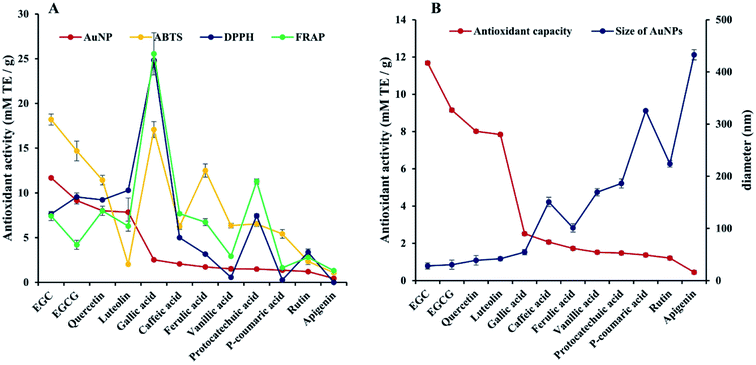 | ||
| Fig. 4 Comparison of antioxidant capacities of 12 individual polyphenol estimated using DPPH, ABTS, FRAP and AuNPs assay (A) and the average DLS diameters of the corresponding AuNPs (B). | ||
However, it was also found that the relative antioxidant ranking was influenced significantly by the assays. For example, the relative antioxidant capacities between protocatechuic acid and vanillic acid, caffeic acid and ferulic acid obtained by four assays were different. Among the 12 individual polyphenols, protocatechuic acid and caffeic acid obtained by AuNPs were much lower than those obtained by DPPH, ABTS and FRAP assays (shown in Table S1† and Fig. 4A). Similar variations due to the reaction mechanism were also found in literature,37 where the antioxidant activities of quercetin, resveratrol and caffeic acid were evaluated using site-specific and non-site-specific hydroxyl radical-mediated 2-deoxy-D-ribose degradation assay, ferric ion reducing power (RP) assay, nitric oxide (NO) scavenging assays, DPPH, ABTS and FRAP assays, and data show that the median inhibitory concentration (IC50) of each polyphenol and their ranking obtained in different assay were quite different, indicating that the predicated values of antioxidant capacities depend markedly on the reaction mechanism of the assay used. Even the methods sharing a similar mechanism feature show different IC50 and antioxidant ranking, because of different test conditions.37 In the present study, all the assays are based on electron transfer mechanism, but FRAP assay runs in a buffer with pH 3.6, AuNPs assay runs in a buffer with pH 4.6, while protic solvent was used in DPPH and ABTS assays, which may also strongly influence the electronic status of polyphenols.37
Pearson correlation analysis among these assays (shown in Table S2†) revealed that DPPH assay showed a good correlation with FRAP assay (r = 0.909, p < 0.01) and ABTS assay (r = 0.580, p < 0.05), while no significant correlation between AuNPs assay and three conventional assays were observed (p > 0.05). To elucidate the correlation of antioxidant capacities obtained by AuNPs assay with the size of AuNPs formed using corresponding polyphenols, the average size was obtained using DLS analysis. As shown in Fig. 4B, the larger the AuNPs formed by polyphenols, the lower antioxidant activities were obtained, which agreed with those reported previously.38 As mentioned by R. Majumdar,39 the formation kinetics of AuNPs is significantly influenced by the reduction of antioxidants, and the stronger reduction could result in the faster nucleation, the more seed crystals, the more gold ions consumption, and the less gold ions supplies to the AuNPs, all of which could lead to smaller size of the AuNPs. Therefore, the elements which could affect the morphology or size of AuNPs, such as interactions of reaction conditions, interaction of polyphenols, could show significant impacts on the antioxidant capacities obtained.
Polyphenol interaction effects on AuNPs assay
In previous studies, it was reported that the polyphenols were synergistically driving the AuNPs formation,11 but the impact of polyphenol interactions on the TAC estimation using AuNPs assay was less studied. In the present study, 12 combination of individual polyphenol standards were strategically selected, and the TAC of individual and combined compounds was estimated using four methods (data shown in Table S3†), and the estimation variation of each combination were calculated and shown in Fig. 5. For DPPH assay, the variation of 3 combinations including rutin + ferulic acid, luteolin + rutin, gallic + vanillic acid was nearly zero, indicating additive interaction effects were observed in the TAC estimation, while for the other 9 combinations, the variation percentage was negative, indicating the TAC of the combination was underestimated because of antagonistic interaction effects. For ABTS assay, the absolute values of the variation percentage of 3 combinations such as luteolin + rutin, luteolin + rutin + EGC and gallic acid + vanillic acid + ferulic acid were over 30%, and those of other combinations were all less than 30%, particularly those of 3 combinations of two kinds of phenolic acids, gallic acid + rutin, and gallic acid + EGC were nearly zero. For FRAP assay, the TAC of the combination gallic acid + rutin and gallic acid + EGC was significantly underestimated (>30%), and that of combination gallic acid + quercetin + rutin and EGC + ferulic acid + luteolin was significantly overestimated (>30%). The above observations indicated that interaction effects (additive, antagonistic or synergy) occurred for the TAC estimation using DPPH, ABTS and FRAP assays. However, their absolute values of variation percentage observed were all less than 50%. By comparison, the variation percentage of AuNPs assay was all more than 40%, indicating the TAC was much overestimated when combined due to markedly synergy effects. Among the 12 combinations, the variations of 6 combinations including gallic acid + protocatechuic acid, caffeic acid + ferulic acid, rutin + quercetin, luteolin + rutin, gallic acid + vanillic acid + ferulic acid, and gallic acid + quercetin + rutin were more than 100%. Particularly, the maximum variation percentage was observed in combination of gallic acid + vanillic acid + ferulic acid, with values over 250%. Previous study has shown that quercetin and caffeic acid act slightly antagonistically in the linoleic acid system in an aqueous dispersion with 2,2′-azobis(2-amidinopropane)dihydrochloride (AAPH).40 It has also shown that resveratrol and caffeic acid act antagonistically in DPPH and ABTS assays, while synergically in FRAP and RP assays.37 In another study, both synergistic and antagonistic effects were found in combination of 11 flavonoids such as catechin, epicatechin, kaempferol myricetin, quercetin et al., but different interaction patterns were observed for the same combination when different assays were used. For example, the mixture of myricetin and quercetin-3-β-glucoside act antagonistically in DPPH assay, while synergistically in FRAP assay.17 Therefore, the interaction effects of polyphenols depend significantly upon the reaction mechanism of the assay used, and significantly synergy or antagonistic effects of them may influence the TAC of the mixture. In the present study, Pearson correlation analysis (shown in Table S4†) revealed that FRAP assay showed a good correlation with DPPH assay (r = 0.586, p = 0.045) and ABTS assay (r = 0.603, p = 0.038). However, no significant correlation was observed between AuNPs assay and those well-established methods (p > 0.05). Therefore, more poor accuracy was expected for the TAC estimation of polyphenol combinations using AuNPs assay, compared to DPPH, ABTS and FRAP assays.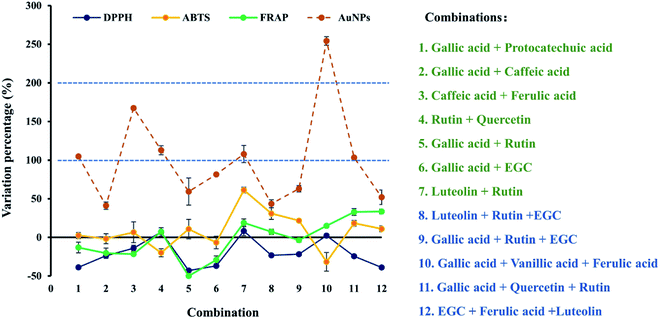 | ||
| Fig. 5 Estimation variation of observational and theoretical antioxidant capacities for different combinations of 12 individual polyphenols using DPPH, ABTS, FRAP and AuNPs assay. | ||
Sample matrix effects on AuNPs assay
There are various endogenous components in vegetables and fruits, including sugars, polysaccharides, proteins, amino acids, polyphenols and flavonoids et al. Considering the polyphenol interaction effects on the TAC estimation using AuNPs observed above, the sample matrix effects, i.e. the interaction effects of endogenous components on the AuNPs assay seemed no negligible. To further evaluate the matrix effects, 6 common vegetable and fruits including raspberry, apple, grape, tangerine, red pepper and tomato were selected and their extracts were prepared using simple and commonly used ultrasound-assistant extraction methods. As shown in Table S5,† the total content of phenolics and flavonoids of each extract, and their corresponding TAC were quite different. Generally, raspberry possess the highest total contents of phenolics, followed by grape, tangerine, apple, red pepper and tomato.41 By comparison, grape possesses the maximum contents of total flavonoids, followed by raspberry, apple, tangerine, red pepper and tomato.42,43 The TAC expressed as mM TE per g of the 6 extracts obtained using AuNPs assay was much lower than that obtained using conventional DPPH, ABTS and FRAP assays. The values recorded using FRAP and ABTS assay for raspberry, grape and tangerine extracts were higher than those for the red pepper, apple and tomato extracts, which was in agreement with Nicoletta et al.44 When estimated using DPPH and AuNPs assays, the order of antioxidant capacities obtained from high to low was raspberry, grape, apple, red pepper, tangerine and tomato. Generally, berries had strong antioxidant capacities, such as the blackberry and raspberry due to high contents of phenolic acids and flavonoids,45 which has been demonstrated in different systems.46 The antioxidant capacities of raspberry were followed by grape and tangerine because of the high contents of phenolic and vitamin C present in these extracts.47 As illustrate in Table S6†, significant correlation between TAC estimation using AuNPs assay and TPC, TFC, DPPH, ABTS and FRAP assays were observed, which was consistent with those observed in studies on Brassica oilseeds,4 olive oil,16 rice wine and Zhuyeqing liquor.7 Due to the high correlation of the data obtained in the AuNPs assay with those in the consolidated estimation methods of TAC, the AuNPs assay has been applied to estimate the TAC of different samples.To quantitatively evaluate the accuracy of the TAC estimation using AuNPs assay, gallic acid and rutin were selected as representative target indicators of phenolic acids and flavonoids, respectively. By spiking gallic acid and rutin in different extracts, the recovery of TAC estimation of gallic and rutin was calculated, and the matrix effects were evaluated. As shown in Fig. 6, the recovery of both gallic acid and rutin obtained by DPPH, ABTS and FRAP methods were close to 100%, indicating that the endogenous components showed almost negligible impact on the TAC estimation of gallic acid and rutin, although various phenolics and flavonoids were found in these samples (Table S5†). By comparison, poor recovery of both gallic acid and rutin was found as shown in Fig. 6. Specifically, the recovery of gallic acid in red pepper, apple and tangerine was more than 150%, indicating the TAC estimation of gallic acid were overestimated when spiked in these samples, while it was less than 40% in raspberry and grape, indicating the antioxidant capacities were significantly underestimated. The recovery of rutin in red pepper and apple was more than 250%, and more than 185% in grape and tomato, indicating the antioxidant capacities of rutin was also greatly overestimated when spiked in red pepper, apple, grape and tomato. These observations illustrated the endogenous components in food samples showed markedly stronger interaction effects and matrix effects on the TAC estimation in AuNPs assay than in conventionally consolidated methods such as DPPH, ABTS and FRAP assays.48
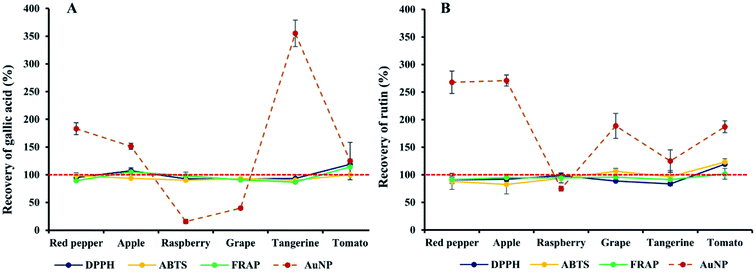 | ||
| Fig. 6 Recovery of antioxidant capacities for gallic acid (A) and rutin (B) when spiked in different polyphenolic extracts of food samples. | ||
Conclusion
As a conclusion, by using 12 representative polyphenols, it has been demonstrated that all selected polyphenols could act as reductants to synthesize AuNPs, and the optical characteristics of AuNPs such as the color and UV-Vis spectra of gold colloidal solutions were highly correlated with their size and morphology characteristics. When used as approaches to evaluate the antioxidant capacities of individual polyphenols, AuNPs assay showed poor correlation with consolidated methods including DPPH, ABTS and FRAP assays. In the antioxidant capacity estimation of binary or ternary polyphenol combinations, much higher estimation variations of observational and theoretical TAC were found in AuNPs assay, indicating synergic interaction effects of individual polyphenol interaction effects significantly influence the TAC estimation of their combinations. In addition, in the recovery evaluation of gallic acid and rutin spiked in the extracts of food samples such as raspberry, grape, apple, red pepper, tangerine and tomato, AuNPs assay exhibited much poor performance compared with DPPH, ABTS and FRAP assays. These markedly stronger polyphenolic interaction effects and matrix effects than the well-established assays indicated that the validation and application of AuNPs-based method for the TAC estimation remained to be fully studied and exploited in the future.Conflicts of interest
The authors declare that there are no conflicts of interest.Acknowledgements
The study was financially supported by the Special Fund of Public Welfare of State Forestry Administration of the People's Republic of China (201504606), the Fundamental Research Funds for the Central Universities, China (2018ZY39), and Natural Science Foundation of China (31770614).References
- G. C. Van de Bittner, C. R. Bertozzi and C. J. Chang, J. Am. Chem. Soc., 2013, 135, 1783–1795 CrossRef CAS PubMed.
- A. Szydłowska-Czerniak, A. Tułodziecka and E. Szłyk, Food Anal. Methods, 2012, 5, 807–813 CrossRef.
- Y. Du, C. Bao, J. Huang, P. Jiang, L. Jiao, F. Ren and Y. Li, Food Chem., 2019, 271, 707–714 CrossRef CAS PubMed.
- A. Tułodziecka and A. Szydłowska-Czerniak, Food Chem., 2016, 208, 142–149 CrossRef PubMed.
- K. L. Wolfe and R. H. Liu, J. Agric. Food Chem., 2007, 55, 8896–8907 CrossRef CAS PubMed.
- H. E. Tahir, Z. Xiaobo, L. Zhihua and Z. Yaodi, J. Food Biochem., 2015, 39, 349–359 CrossRef CAS.
- Z. Wu, E. Xu, J. Li, J. Long, A. Jiao, Z. Jin and X. Xu, Food Anal. Methods, 2016, 10, 1–11 Search PubMed.
- S. Veena, T. Devasena, S. Sathak, M. Yasasve and L. Vishal, J. Cluster Sci., 2019, 30, 1591–1597 CrossRef CAS.
- S. Pu, J. Li, L. Sun, L. Zhong and Q. Ma, Carbohydr. Polym., 2019, 211, 161–172 CrossRef CAS PubMed.
- M. F. Zayed, R. A. Mahfoze, S. M. El-kousy and E. A. Al-Ashkar, Colloids Surf., A, 2020, 585, 124167 CrossRef.
- D. Vilela, M. C. González and A. Escarpa, Anal. Chim. Acta, 2012, 751, 24–43 CrossRef CAS PubMed.
- H. B. Ahmed, M. Zahran and H. E. Emam, Int. J. Biol. Macromol., 2016, 91, 208–219 CrossRef CAS PubMed.
- D. Philip, Spectrochim. Acta, Part A, 2009, 73, 374–381 CrossRef PubMed.
- M. Scampicchio, J. Wang, A. J. Blasco, A. Sanchez Arribas, S. Mannino and A. Escarpa, Anal. Chem., 2006, 78, 2060–2063 CrossRef CAS PubMed.
- J. Wang, L. Wang, X. Liu, Z. Liang, S. Song, W. Li, G. Li and C. Fan, Adv. Mater., 2007, 19, 3943–3946 CrossRef CAS.
- F. Della Pelle, D. Vilela, M. C. González, C. L. Sterzo, D. Compagnone, M. Del Carlo and A. Escarpa, Food chem., 2015, 178, 70–75 CrossRef CAS PubMed.
- M. Hidalgo, C. Sánchez-Moreno and S. d. Pascual-Teresa, Food Chem., 2010, 121, 691–696 CrossRef CAS.
- D. Vilela, M. C. Gonzalez and A. Escarpa, TrAC, Trends Anal. Chem., 2015, 64, 1–16 CrossRef CAS.
- B. Fuhrman, N. Volkova, M. Rosenblat and M. Aviram, Antioxid. Redox Signaling, 2000, 2, 491–506 CrossRef CAS PubMed.
- B. Queiros, J. C. M. Barreira, A. C. Sarmento and I. C. F. R. Ferreira, Int. J. Food Sci. Nutr., 2009, 60, 160–172 CrossRef CAS PubMed.
- V. Vieira, A. Marques, L. Barros, J. C. M. Barreira and I. C. F. R. Ferreira, J. Food Nutr. Res., 2012, 51, 109–116 CAS.
- H. Xiangjiu, L. Dong and L. Rui Hai, J. Agric. Food Chem., 2008, 56, 9337–9344 CrossRef PubMed.
- J. Zhen, T. S. Villani, Y. Guo, Y. Qi, K. Chin, M. H. Pan, C. T. Ho, J. E. Simon and Q. Wu, Food Chem., 2016, 190, 673–680 CrossRef CAS PubMed.
- S. T. Fan, Z. H. Qiu, C. Li and S. P. Nie, LWT–Food Sci. Technol., 2015, 64, 1022–1027 CrossRef.
- K. T. Desta, G. S. Kim, Y. H. Kim, W. S. Lee, S. J. Lee, J. S. Jin, A. Abd El-Aty, H. C. Shin, J. H. Shim and S. C. Shin, Biomed. Chromatogr., 2016, 30, 225–231 CrossRef CAS PubMed.
- B. d. l. T. Amparo Angelica S, H. Terence, N. Poonam Singh and R. K. Owusu-Apenten, Food Chem., 2015, 174, 119–123 CrossRef PubMed.
- D. Hua, D. Zhang, B. Huang, P. Yi and C. Yan, Carbohydr. Polym., 2014, 103, 143–147 CrossRef CAS PubMed.
- R. Herrera-Becerra, J. L. Rius and C. Zorrilla, Appl. Phys. A: Mater. Sci. Process., 2010, 100, 453–459 CrossRef CAS.
- X. Li, L. Jiang, Q. Zhan, J. Qian and S. He, Colloids Surf., A, 2009, 332, 172–179 CrossRef CAS.
- S. A. Aromal, V. Vidhu and D. Philip, Spectrochim. Acta, Part A, 2012, 85, 99–104 CrossRef CAS PubMed.
- V. Sanna, N. Pala, G. Dessì, P. Manconi, A. Mariani, S. Dedola, M. Rassu, C. Crosio, C. Iaccarino and M. Sechi, Int. J. Nanomed., 2014, 9, 4935 Search PubMed.
- P. K. Jain, X. Huang, I. H. El-Sayed and M. A. El-Sayed, Acc. Chem. Res., 2008, 41, 1578–1586 CrossRef CAS PubMed.
- C. J. Murphy, A. M. Gole, S. E. Hunyadi, J. W. Stone, P. N. Sisco, A. Alkilany, B. E. Kinard and P. Hankins, Chem. Commun., 2008, 544–557, 10.1039/b711069c.
- S. K. Ghosh and T. Pal, Chem. Rev., 2007, 107, 4797–4862 CrossRef CAS PubMed.
- A. Scalbert and G. Williamson, J. Nutr., 2000, 130, 2073S–2085S CrossRef CAS PubMed.
- A. A. Bhutto, Ş. Kalay, S. Sherazi and M. Culha, Talanta, 2018, 189, 174–181 CrossRef CAS PubMed.
- E. Kurin, P. Mučaji and M. Nagy, Molecules, 2012, 17, 14336–14348 CrossRef CAS PubMed.
- G. Ozkan, S. Kamiloglu, E. Capanoglu, J. Hizal and R. Apak, in Impact of Nanoscience in the Food Industry, Elsevier, 2018, pp. 311–350 Search PubMed.
- R. Majumdar, B. G. Bag and N. Maity, Int. Nano Lett., 2013, 3, 53 CrossRef.
- M. Peyrat-Maillard, M.-E. Cuvelier and C. Berset, J. Am. Oil Chem. Soc., 2003, 80, 1007 CrossRef CAS.
- X. Wu, G. R. Beecher, J. M. Holden, D. B. Haytowitz, S. E. Gebhardt and R. L. Prior, J. Agric. Food Chem., 2004, 52, 4026–4037 CrossRef CAS PubMed.
- D. J. Charles, in Antioxidant properties of spices, herbs and other sources, Springer, 2012, pp. 65–138 Search PubMed.
- A. A. Franke, L. J. Custer, C. Arakaki and S. P. Murphy, J. Food Compos. Anal., 2004, 17, 1–35 CrossRef CAS.
- N. Pellegrini, M. Serafini, B. Colombi, D. Del Rio, S. Salvatore, M. Bianchi and F. Brighenti, J. Nutr., 2003, 133, 2812–2819 CrossRef CAS PubMed.
- S. Häkkinen, M. Heinonen, S. Kärenlampi, H. Mykkänen, J. Ruuskanen and R. Törrönen, Food Res. Int., 1999, 32, 345–353 CrossRef.
- H. Wang, G. Cao and R. L. Prior, J. Agric. Food Chem., 1997, 45, 304–309 CrossRef CAS.
- D. Ryan and K. Robards, Analyst, 1998, 123, 31R–44R RSC.
- B. Daramola, J. Food Sci. Technol., 2018, 55, 3827–3832 CrossRef CAS PubMed.
Footnote |
| † Electronic supplementary information (ESI) available. See DOI: 10.1039/d0ra01861a |
| This journal is © The Royal Society of Chemistry 2020 |

