
 Open Access Article
 This Open Access Article is licensed under a Creative Commons Attribution-Non Commercial 3.0 Unported Licence
Enhanced methane gas storage in the form of hydrates: role of the confined water molecules in silica powders†
Pinnelli S. R. Prasad *a,
Burla Sai Kiranab and
Kandadai Sowjanyaa
*a,
Burla Sai Kiranab and
Kandadai Sowjanyaa
aGas Hydrate Division, CSIR–National Geophysical Research Institute (CSIR–NGRI), Hyderabad – 500 007, India. E-mail: psrprasad@ngri.res.in; Fax: +91 40 2717 1564; Tel: +91 40 2701 2710
bAcademy of Scientific and Innovative Research (AcSIR), CSIR–NGRI Campus, Hyderabad – 500 007, India
First published on 7th May 2020
Abstract
Methane hydrates are promising materials for storage and transportation of natural gas; however, the slow kinetics and inefficient water to hydrate conversions impede its broad scale utilisation. The purpose of the present study is to demonstrate rapid (2–3 h) and efficient methane hydrate conversions by utilising the water molecules confined in the intra- and inter-granular space of silica powders. All the experiments were conducted with amorphous silica (10 g) powders of 2–30 μm; 10–20 nm grain size, to mimic the hydrate formations in fine sand and clay dominated environments under moderate methane pressure (7–8 MPa). Encasing of methane molecules in hydrate cages was confirmed by Raman spectroscopic (ex situ) and thermodynamic phase boundary measurements. The present studies reveal that the water to hydrate conversion is relatively slower in 10–20 nm grain size silica, although the nucleation event is rapid in both silicas. The process of hydrate conversion is vastly diffusion-controlled, and this was distinctly observed during the hydrate growth in nanosize silica.
Introduction
Clathrate hydrates, or gas hydrates (GH), are crystalline ice-like inclusion compounds consisting of hydrogen-bonded water molecules forming open cages of different sizes. These cages are occupied by suitably sized molecules such as methane (CH4), ethane (C2H5), propane (C3H8) and carbon dioxide (CO2). In nature, these are found in certain permafrost and oceanic sediments. Four essential conditions often required for their stable existence are (i) enough supply of guest (suitably sized hydrocarbons or other) and (ii) host (water) molecules; and simultaneous presence of (iii) moderately high pressure, (iv) lower temperature conditions. Methane (CH4) is a dominant constituent among hydrocarbons found in natural gas. Therefore, thermodynamic stability studies using methane gas are often useful for mimicking the natural gas hydrate stability conditions. Although the presence of higher hydrocarbons such as ethane and propane can significantly alter the structural and/or thermodynamic stability of natural gas hydrates.1–3On the other hand, the clathrate hydrates themselves have many interesting applications, such as fuel gas storage and transportation,4,5 gas separation from mixtures (flue gas),6 water purification,7 and carbon dioxide capture, storage/sequestration and utility.8–12 Typically, about 160–180 volumes (STP) of guest molecules can be encased in the hydrate cages. Their thermodynamic stability conditions are much milder (∼8 MPa and ∼10 °C), unlike liquefied (∼−162 °C and 0.1 MPa) or compressed (∼25 MPa and 25 °C) forms for natural gas.1 Slower formation kinetics and lower water to hydrate conversions are the prime obstacles for its industrial applications.13 Despite inherent risks and associated energy-intensive process in CNG and LNG technologies; they are the preferred methodologies for fuel gas storage & transportation. However, recent experiments on GH formation in porous medium signify that the process of hydrate nucleation and growth could be rapid.14–17 Thus the hydrate formation and dissociation in porous media or sediments should be understood, which is dependent on the medium property. Generally, gas hydrates occur in the form of segregated nodules, lenses, pellets or sheets in fine particle sediments, also as interstitial pore-filling between particles in coarse-grained sediments.18 Natural sediments hosting gas hydrates are generally characterised by mineral particle, organic debris, pore water, mud and clay, etc., so it is complicated to specify the impact of each factor. Because the deposition of sediment particles with different size controls the pore space, the amount of pore water and free gas, etc., and thus the particle size plays an important role in the hydrate morphology and distribution.19,20 Recent gas hydrate explorations in the Indian offshore region have indicated their presence in clay, fine-grained and coarse-grained sand dominated geological locations covering Krishna–Godavari (KG), Andaman and Mahanadi basins.21,22
The silica is a dominant constituent in oceanic sedimentary strata, and its morphology and grain size are also important factors in the hydrate formation mechanism.23–25 Chong et al.,26 examined methane hydrate formation in silica sand of different sizes namely sand-silt (0.063 mm) to granular pebbles (3 mm) and have reported that formation extending over 70 h. On the other hand, the addition of a small amount of silica to H2O–CH4 hydrate forming system has proven to be promoting methane hydrate formation kinetics.24,25,27 Further, series of earlier experiments from our group using hollow silica, comprising of inner void surrounded by a thinner solid shell, have shown several advantages over silica sand.28–31 In particular, the hollow silica helps in achieving rapid and efficient methane conversions with high confined water (4–6 g H2O/g SiO2).28–31 Further, it was established that the hydrate crystal growth morphology in low density (hollow) silica, that we used earlier, distinctly differs with that of silica sand or gels or capillary.32–35 In the former, the hydrate growth, predominantly, occurs on the top of the matrix bed, and the water subsequently is transported through the capillary action to the top of the bed.32 Whereas, in silica sand bed reactors, the hydrate growth reported to occur on the top layer of the sediment bed and subsequently spreads to the deeper parts; thereby the water confined in the interstitials were converted to hydrates.33–35 The solid silica samples of suitable size, are thus more appropriate, in mimicking the natural gas hydrate mechanism and therefore we choose two SiO2 samples having grain sizes 2–30 μm; 10–20 nm, for the present study with different water to SiO2 ratios, representative of typical fine-grained and clay-rich geological environments. The density of these solid silica samples is high, and they completely sink in water in the water column. Therefore intergranular spaces are saturated at lower water content compared to low-density hollow silica.28–31 Methane/carbon dioxide adsorption measurements were conducted earlier using carbonaceous material and reported enhancement in gas storage capacity; however, the studies were inconclusive about the mechanism, namely, was it due to hydrate formation or due to increased adsorption under wet conditions.36–38 Particularly enhanced isothermal (∼275 K) CO2 gas adsorption in ordered mesoporous carbon matrix with higher pre-adsorbed water molecules at 3.6 MPa is very attractive. It is 2.26 time higher than corresponding dry carbon matrix.38 In another report Casco et al.,39 have reported the formation of methane hydrates in the water confined in macro-, meso- and micropores of activated carbon. The authors have shown that the water in macropores was converted to hydrates at 3–4 MPa, while that in meso- and micropores require higher pressure (6–8 MPa). It is worth noticing that the experimental pressure and temperature employed in those studies are well within hydrate stable region. Liu and Liang40 recently reported the methane hydrate formation in a silica gel matrix, particularly, below ice melting temperature. The gas uptake was 0.150 mol mol−1, and the water to hydrate conversion was nearly 100% at 253 K and 6.0 MPa. Faster formation kinetics of 160 min (@263 K) was reported in this system, with gas uptake ratio of 52.96 mol min−1 m−3. Thus, indicating the surface area and morphological properties of the host matrix also play a critical role in the hydrate formation kinetics. On the other hand, the kinetics and water to hydrate conversion in consolidated sediments also critically depend on several parameters such as permeability, degree of water saturation and salinity.41
The present study aims at providing better insight into the mechanism of hydrate formation in SiO2–H2O–CH4 system, by conducting experiments by varying the water in matrix pores. In this study, we used solid silicas, wherein the confined water molecules occupy intergranular space. The driving force (pressure difference between the experimental and the equilibrium pressures at the hydrate nucleation temperature) was kept constant. Additionally, morphological and physical properties of the host sediments could influence the kinetics of hydrate formation and dissociation.38–43 The formation kinetics and ability of confined water into hydrates under the gas-rich environment is studied.
Experimental
The silica powders used in the present study were purchased from M/S Nanoshel (Intelligent Materials Pvt. Ltd.) (sample #1) and Sigma-Aldrich (sample #2), and they were used without further purification. De-ionized ultra-pure water (Millipore – type 1) and the methane gas (99.95% – M/S Linde India Ltd) were used in hydrate formation studies. The samples composed of fused amorphous silica (see ESI Fig. 1†) with distinctly different grain sizes such as 2–30 μm for sample #1 (see ESI Fig. 2†) and 10–20 nm for sample #2 (as specified by the supplier). Both the samples have high porosity (∼60 & 63%) and therefore accommodate a significant amount of water into inter- and intragranular spaces. The absence of sharp absorption band around 3650 cm−1, in FTIR analysis, indicates nonexistence of hydroxyl groups in these samples (see ESI Fig. 3†). We choose these samples because SiO2 is a dominant constituent, and the grain size variation is prominently noticed in oceanic sediments (clay-rich) and sand-rich reservoirs.The experimental procedure followed for gas hydrate synthesis has already been described earlier,25,26 and a schematic layout is shown in Fig. 1. Briefly, the central part was an SS-316 cylindrical vessel, which can withstand gas pressures up to 15 MPa, and the volume of the vessel was 250 mL. A cold fluid (water + glycol mixture) was circulated around the vessel with the help of a circulator to bring and maintain the temperature inside the cell at the desired level. A platinum resistance thermometer (Pt100) was inserted into the vessel to measure temperature with an accuracy of ±0.5 K. Pressure in the vessel was measured with a pressure transducer (WIKA, type A-10 for pressure range 0 to 25 MPa with ±0.5% accuracy).
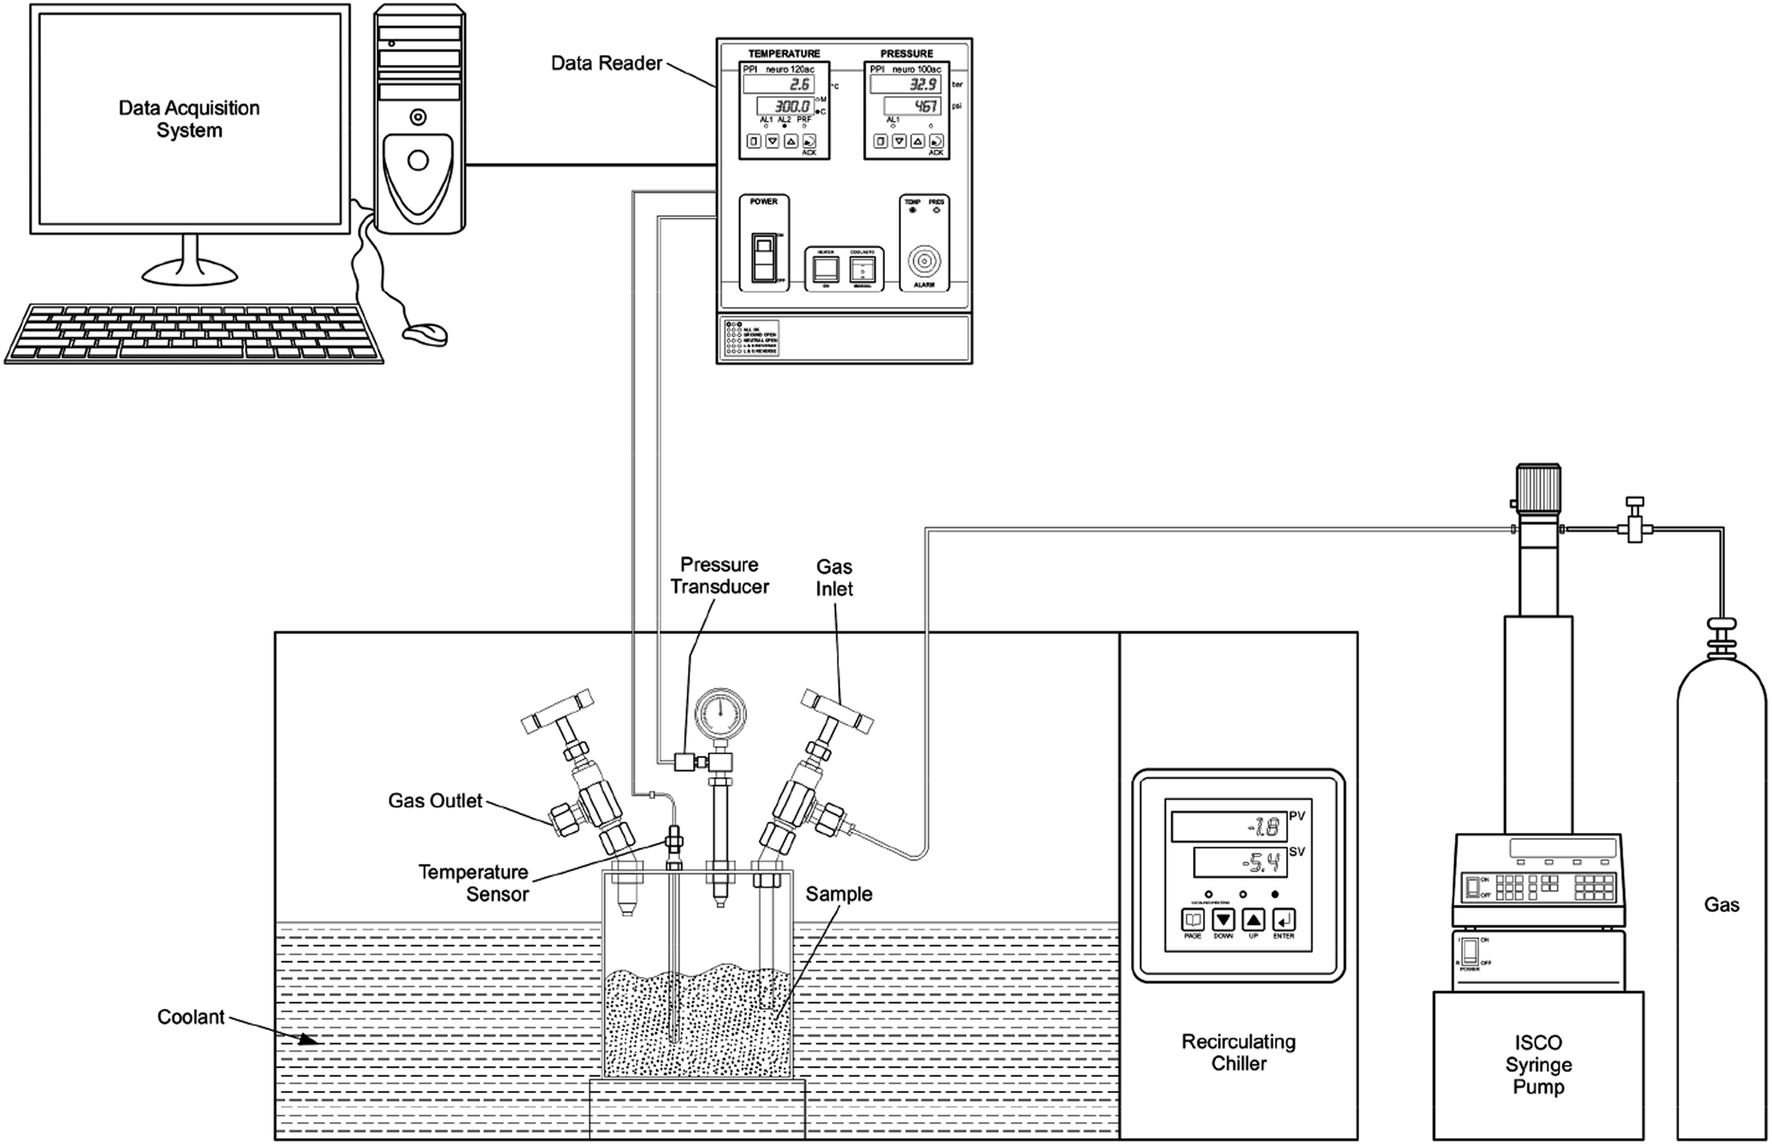 | ||
| Fig. 1 The schematic layout of the experimental arrangement. | ||
The reactor vessel was first filled with 10 g of silica powder and appropriated amount of water was added drop by drop and the vessel was pressurised (@300 K) with methane gas. The atmospheric gases in the experimental cell were diluted by purging with methane gas before the experiments, and the gas was filled to the desired level using the Teledyne ISCO syringe pump to pressure and temperature outside of the hydrate stability zone. Then, the reactor was isolated from the ISCO pump/gas tank by closing the gas inlet valve. Subsequently, a cold fluid from the chiller was circulated to bring down the temperature of the reactor, and the hydrate formation was detected by a sharp pressure drop at a particular temperature. Experimental set-up for probing the gas hydrate formation/dissociation under isochoric conditions is less expensive and simpler to implement. Thus, we adopted this methodology in our laboratory. The temperature and pressure were logged for every 60 seconds of the time interval. Insignificant head-pressure drop in the reactor observed over a longer duration indicates saturation in hydrate conversion. The bath temperature was slowly increased during the warming cycle. The heating rates during the hydrate formation (cooling cycle) and dissociation (warming cycle) regions were kept as 1–2° h−1.
Results and discussion
We systematically probed the methane gas consumption in SiO2 and water system in the temperature range 260 to 300 K. We pressurised the reactor vessels with 7–8 MPa (@ 300 K) and this p, T range is favourable for methane hydrate formation. In Fig. 2, we show the pressure–temperature (p–T) trajectories recorded in this system with different Rw (water mass ratio – Rw = mass of H2O/mass of SiO2) ratios. For consistency, we used 10 g of SiO2 powder in all the experiments. The black and red lines, respectively, correspond to the freezing (hydrate formation) and the thawing (hydrate dissociation) cycles. Significant pressure drops during the freezing cycle and subsequent gain in the thawing cycle, in the narrow temperature interval, vindicate the state change to solid methane hydrate phase and its dissociation into vapour. Experiments with methane gas alone and along with 10 g of SiO2 dry powder, i.e., Rw = 0.0, were conducted under similar p, T conditions for baseline studies. Interestingly, observed pressure variations in the same experimental conditions are linear (see ESI Fig. 4†) indicating that the pressure drop is mainly due to gas compression. The p–T trajectories, shown in Fig. 2, have distinct hysteresis loops, and it increases with increasing water i.e., Rw. The lowest temperature in the present set of experiments is below the ice melting temperature. The phase transformation to hydrates under such p, T conditions could be from (i) liquid water + gas or (ii) ice + gas. As already said, such transformation to hydrates is reflected by sudden (or nonlinear) pressure change at the hydrate onset. However, from Fig. 2, it is clear that the pressure drop is predominantly nonlinear above 273 K, thus indicating the bulk of hydrate conversion occurred in the liquid water phase. Further, linear pressure variation upon temperature decrease to 260 K and absence of hysteresis behaviour indicate gas intake is not due to hydrate transformation. The amount of methane gas consumed in the process, along with a total amount of water and its conversion into the hydrate phase is tabulated in Table 1. Generally, gas consumption increases with Rw and attains a level of saturation. Further, the increase in Rw results in dramatic reduction (or very slow) of gas uptake. These three steps can be classified as under-, just- and oversaturated conditions of intergranular spaces of the sediment (in the present case SiO2) matrix. A visual inspection of material, whether it converted to thick paste or slurry, will be good enough to distinguish the matrix stage among under-, just- or over-saturated conditions. The SiO2 matrix turned into a thick paste if the water reaches saturation. In ESI Fig. 5,† we show the photographs with two different Rw ratios. We observed that the hydrate conversion is difficult or very sluggish in a thick paste-like sample under unstirred conditions. However, it is not valid in a slurry state with much higher water content.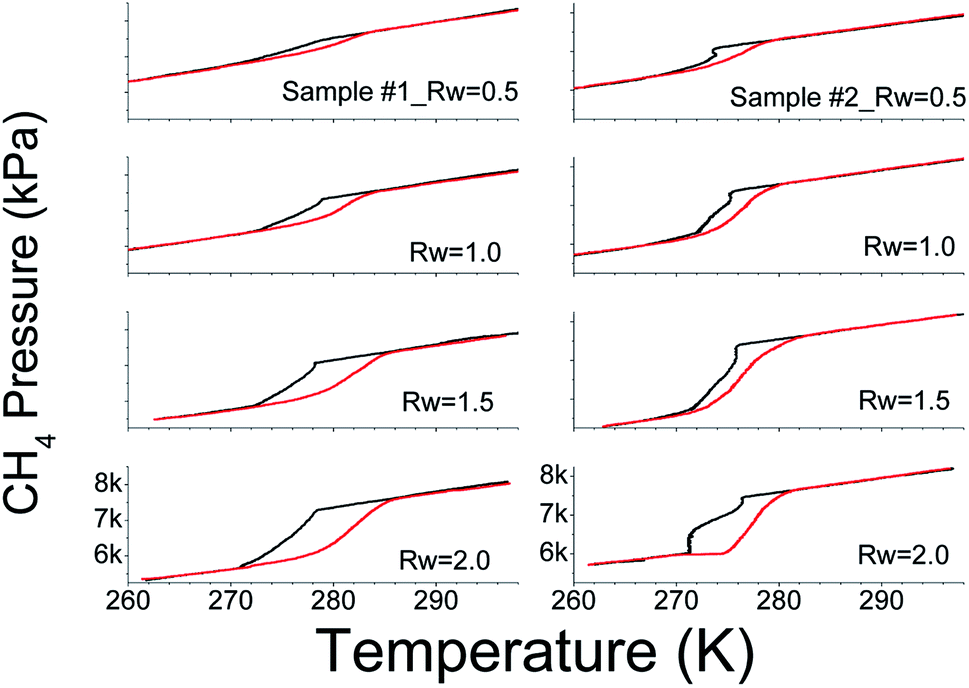 | ||
| Fig. 2 A plot showing the variation in CH4 gas pressure in gas hydrate systems as a function of temperature (p–T trajectory). Black and red lines respectively represent the freezing and warming cycles. The water to SiO2 mass ratio (Rw) is shown on each p–T trajectory. | ||
| Run no. | Rw | Nanoshel silica (sample #1) | Aldrich silica (sample #2) | ||||
|---|---|---|---|---|---|---|---|
| nW (mol) | nCH4 (mol) | % H2O conversion | nW (mol) | nCH4 (mol) | % H2O conversion | ||
| Unsaturated samples | |||||||
| 1 | 0.5 | 0.278 | 0.0735 | 152.02 | 0.278 | 0.0875 | 180.98 |
| 2 | 0.5 | 0.278 | 0.0705 | 145.82 | 0.278 | 0.0850 | 175.81 |
| 3 | 0.5 | — | — | — | 0.278 | 0.0860 | 177.88 |
| Average value | 0.0720 | 148.92 | 0.0862 | 178.22 | |||
| Standard deviation | 0.0021 | 4.38 | 0.0013 | 2.60 | |||
| 4 | 1.0 | 0.556 | 0.1250 | 129.27 | 0.556 | 0.1700 | 175.81 |
| 5 | 1.0 | 0.556 | 0.1125 | 116.34 | 0.556 | 0.1725 | 178.39 |
| 6 | 1.0 | 0.556 | 0.0950 | 98.25 | 0.556 | 0.1635 | 169.09 |
| Average value | 0.1108 | 114.62 | 0.1687 | 174.43 | |||
| Standard deviation | 0.0150 | 15.58 | 0.0046 | 4.80 | |||
| 7 | 1.5 | — | — | — | 0.834 | 0.2430 | 167.54 |
| 8 | 1.5 | — | — | — | 0.834 | 0.2400 | 165.47 |
| 9 | 1.5 | 0.834 | 0.1425 | 98.25 | 0.834 | 0.2450 | 168.92 |
| 10 | 1.5 | 0.834 | 0.1525 | 105.14 | 0.834 | 0.2350 | 162.02 |
| 11 | 1.5 | 0.834 | 0.1625 | 112.04 | 0.834 | 0.2250 | 155.13 |
| Average value | 0.1525 | 105.14 | 0.2376 | 163.82 | |||
| Standard deviation | 0.01 | 6.89 | 0.0079 | 5.51 | |||
![[thin space (1/6-em)]](https://www.rsc.org/images/entities/char_2009.gif) |
|||||||
| Saturated samples | |||||||
| 12 | 2.0 | 1.11 | 0.1875 | 97.13 | 1.11 | 0.1400 | 72.52 |
| 13 | 2.0 | 1.11 | 0.1925 | 99.72 | 1.11 | 0.1900 | 98.42 |
| 14 | 2.0 | 1.11 | 0.1950 | 101.01 | 1.11 | 0.1600 | 82.88 |
| 15 | 2.0 | 1.11 | 0.1950 | 101.01 | 1.11 | 0.1375 | 71.22 |
| Average value | 0.1925 | 99.72 | 0.1569 | 81.26 | |||
| Standard deviation | 0.0035 | 1.829 | 0.0243 | 12.57 | |||
|
|||||||
| Oversaturated samples | |||||||
| 16 | 2.2 | — | — | — | 1.223 | 0.1550 | 72.87 |
| 17 | 2.2 | — | — | — | 1.223 | 0.1450 | 68.17 |
| 18 | 2.2 | — | — | — | 1.223 | 0.1600 | 75.22 |
| Average value | 0.1533 | 72.09 | |||||
| Standard deviation | 0.0076 | 3.59 | |||||
| 19 | 2.5 | 1.389 | 0.0525 | 21.73 | — | — | — |
| 20 | 2.5 | 1.389 | 0.0550 | 22.76 | — | — | — |
| 21 | 2.5 | 1.389 | 0.0530 | 21.94 | — | — | — |
| Average value | 0.0535 | 22.14 | |||||
| Standard deviation | 0.0013 | 0.54 | |||||
We calculated the water conversion to hydrates by considering the total water added to the SiO2 matrix, amount of CH4 consumed during the hydrate conversion process and assumed the hydration number as 5.75.28–31 However, in literature, different authors have used different hydration numbers in the range of 5.75 to 6.1. This variation has been mainly attributed due to the cage occupancy factors.1 Throughout this study, we have used the ideal hydration number (5.75) assuming full occupancy of the cages, even though this is about 3% less than the estimated hydration number.44 As seen from Table 1, the water to hydrate conversion factor exceeds 100% for lower Rw ratios. Such anomalous variations in dry or partially wet porous systems were reported earlier by several authors,38,39,45 and precise mechanism remained resolved. However, the hydrate conversion factor quickly reaches to 100% in coarse-grained SiO2 matrix (sample #1) as Rw is 1.5–2.0. Whereas there is a significant contrast for the water conversion factor in fine-grained SiO2 matrix (sample #2), such as it is more than 100% at Rw = 1.5 and very much less than 100% at Rw = 2.0. Casco et al.39 have also estimated the stoichiometry of the methane hydrates synthesised in the confined nano space, of activated carbons, from the adsorbed methane gas and water at different Rw ratios. They have also suggested the stoichiometry to be CH4·(3.6–4.1)H2O, particularly, in undersaturated conditions. Further, they estimate the stoichiometry very close to natural one (i.e., 5.75) in oversaturated samples. Zhou et al.,38 also reported similar observations in CO2 hydrates synthesised in the mesoporous carbon matrix. They also reported a progressive increase in isothermal gas adsorption as a function of increasing Rw ratio in the range 0–2.35. In contrast, the gas adsorption capacity decreases drastically at higher Rw (= 3.55) values. Furthermore, estimated stoichiometry (2.65–3.26 for Rw = 1.55–2.35) in this system also showed more significant deviations from the ideal value of 5.75. Similarly, Zhang et al.45 have also investigated the role of pre-adsorbed water in ordered mesoporous silica system in CO2 gas adsorption. They reported the highest storage capacity (12.8 mmol g−1) at Rw = 2.48, which is 1.86 times higher than the dry (Rw = 0.0) samples. The gas adsorption capacity decreased considerably at higher Rw (= 3.07) value. Thus, these experiments indicate the necessity for critical water content in porous systems for higher gas storage capacity. The main reason for higher gas intake was advocated as hydrate formation because the temperature and pressure conditions of isothermal adsorption measurements were well within hydrate stability regions. At higher water content (higher than the critical value) the gas storage capacity decreases significantly, which could be due to plugging in the gas circulation paths.38,45 On the other hand, the authors45 have also reported a decrease in gas adsorption, compare to dry conditions when Rw = 1.08 and 1.52. Integrated experimental studies using high-pressure differential calorimetry (HP-DSC) along with standard hydrate formation/dissociation measurements could provide useful information to quantify gas uptake due to adsorption and hydrate conversion.
Further hydrate formation was very sluggish at higher Rw ratios. The pressure drop was negligibly small in these systems upon increasing Rw to 3.0 and 2.5 respectively, and this water was enough to convert the samples into a thick paste (see ESI Fig. 5†). Therefore, we reduced Rw to 2.5 and 2.2, respectively, in sample 1 and 2 and conducted another set of experiments. The hydrate conversion factor for sample #1 decreased significantly to about 22.14%. On the other hand, in sample #2, the hydrate conversion is comparable for Rw = 2.0 and 2.2. However, the hydrate formation rate is considerably slower (see the following paragraph). Prolonged gas consumption during the warming cycle is evident in Fig. 3. A plot of CH4 gas content verses the temperature is reconstructed from the logged p, T data using the procedure described earlier.27 The behaviour could be attributed to the apparent blockages in the gas circulation paths due to ice formation during the cooling cycle and was eventually opened up during the warming cycle.45,46 Subsequently considerable amount of gas was adsorbed, resulting in more hydrate formation before the onset of hydrate melting. Such behaviour was observed only in water-saturated systems with Rw = 2.0 and 2.2.
 | ||
| Fig. 3 A trajectory showing the variations in the amount of methane gas at different temperatures during the cooling (black) and warming (red) cycles for SiO2 (sample #2) with Rw = 2.2. | ||
The hydrate formation is a phase transformation, involving solid hydrates, from starting water and gas phases. To estimate the gas consumption and the kinetics in hydrate conversion, one needs time information on its onset and induction time. It is well known that the hydrate formation is an exothermic process accompanied by a small degree of increase in the local temperature and also associated with a decrease in the gas pressure. However, it has not always been the case in an isochoric process. Ideally, spectroscopic methods are suitable for detecting a state change such as hydrate conversion. Nevertheless, a distinct change in pressure decrease in conjunction with constant and/or temperature spike over sometime within the hydrate stability zone is considered as the onset point for hydrate nucleation.47 Fig. 4 shows the CH4 gas uptake per mole H2O in sample #1 (a) and sample #2 (b) in 10 h after the hydrate onset. These gas uptake kinetics plots are the average of repeat measurements tabulated in Table 1 with different Rw values. Initially, the gas uptake is rapid and eventually reaches a plateau, indicating the saturation in hydrate conversion. It is worth noting that the maximum methane gas uptake in sI hydrate, consisting of 8 empty cages formed from 46H2O molecules, is 0.173 (shown as a grey line in Fig. 3 and 4). The formation kinetics in both the systems is rapid, and 85–90% of gas uptake has occurred within 2–3 h. Further, in sample #1 (see Fig. 3a) the maximum gas uptake approached 100% of the permissible limit for Rw = 1.5–2.0 and this is an indication of pore water saturation state. The gas uptake understandably is more than 100%, and this mainly could be due to gas adsorption on wet/dry SiO2. Bagherzadeh et al.48 have shown through molecular simulations with a limited amount of water that a meniscus is formed between silica surfaces separated by 4–6 nm. Further, their studies on water and gas molecular distribution indicated that the water number density in the layers adjacent to the silica is higher, and these layers are more structured and less mobile compared with water layers far from the surface. Additionally, the concentrations of the gases are significantly higher at the liquid and silica interfaces than in other locations in the gas phase. In other words, higher free-gas adsorption was evidenced on a wet surface. Further, Bagherzadeh et al.48 speculated that “enhanced concentration of gases at the interface along with the extended contact area (curved meniscus compared with flat interface in the absence of silica surfaces) between water and guest molecules at the meniscus as well as lesser mobility of water molecules near the silica surface may provide a mechanism for the heterogeneous nucleation of the clathrate hydrate in a water-wetting porous medium”. Therefore, presences of the mineral body such as silica facilitate in the creation of nucleation sites and kinetically promote clathrate hydrates,49 However, they will not alter the space group of hydrates. Indeed the experiments conducted H2O–CH4 system with a small amount of silica supports such a mechanism.24,25,27 However, depending on the extent of hydrophobic or hydrophilic nature of the matrix materials, the lattice constant of the hydrates can show a small perturbation.50 The experimental studies reported in current research also support such conjecture.31,47 Nesterov et al.,47 investigated the role of certain oxides such as silicon, aluminium, zinc, titanium and manganese as active promoters for natural gas hydrates. Striking observations from their studies are; the presence of such oxides along with the surface functional groups, particularly, carbon-containing groups (e.g., carbonates) causes a decrease in the induction time of hydrate formation. The size of inducer particles should be much larger than the size of the hydrate nucleus. Induction time of gas hydrate formation decreases with an increase in the size of the promoter particles. From Fig. 3a, it is seen that the gas uptake, for sample #1, in the initial 0.5–1.0 h duration is only 40–50% and later on the gas uptake became slower for all Rw values. The time taken for 90% of the maximum (t90) gas uptake varies in the range of 3.6–2.3 h for Rw = 0.5 to 2.0. On the other hand, the gas uptake in nanosized SiO2 (sample #2, Fig. 4b) is comparatively slower. In fact, the gas uptake is 93, 77 and 67% of the maximum for under-saturated systems (Rw = 0.5, 1.0, 1.5) in 3.6 h duration; while it is ∼50% for saturated system with Rw = 2.0 or 2.2. The hydrate growth times in our experiments were restricted to ∼20 h; however, the hydrate growth may take place beyond these time scales. Our results are confirmatory to the literature data that the growth in fine-grained sediments is generally slower. This fact is further illustrated in Fig. 5 through the long-time behaviour of gas intake in two samples. The maximum hydrate conversion in micro-grained SiO2 (sample #1) is >98% (for saturated) and ∼20% (for oversaturated) on longer time scales; while the hydrate growth in nanosized SiO2 is slower but eventually reached higher hydrate conversions.
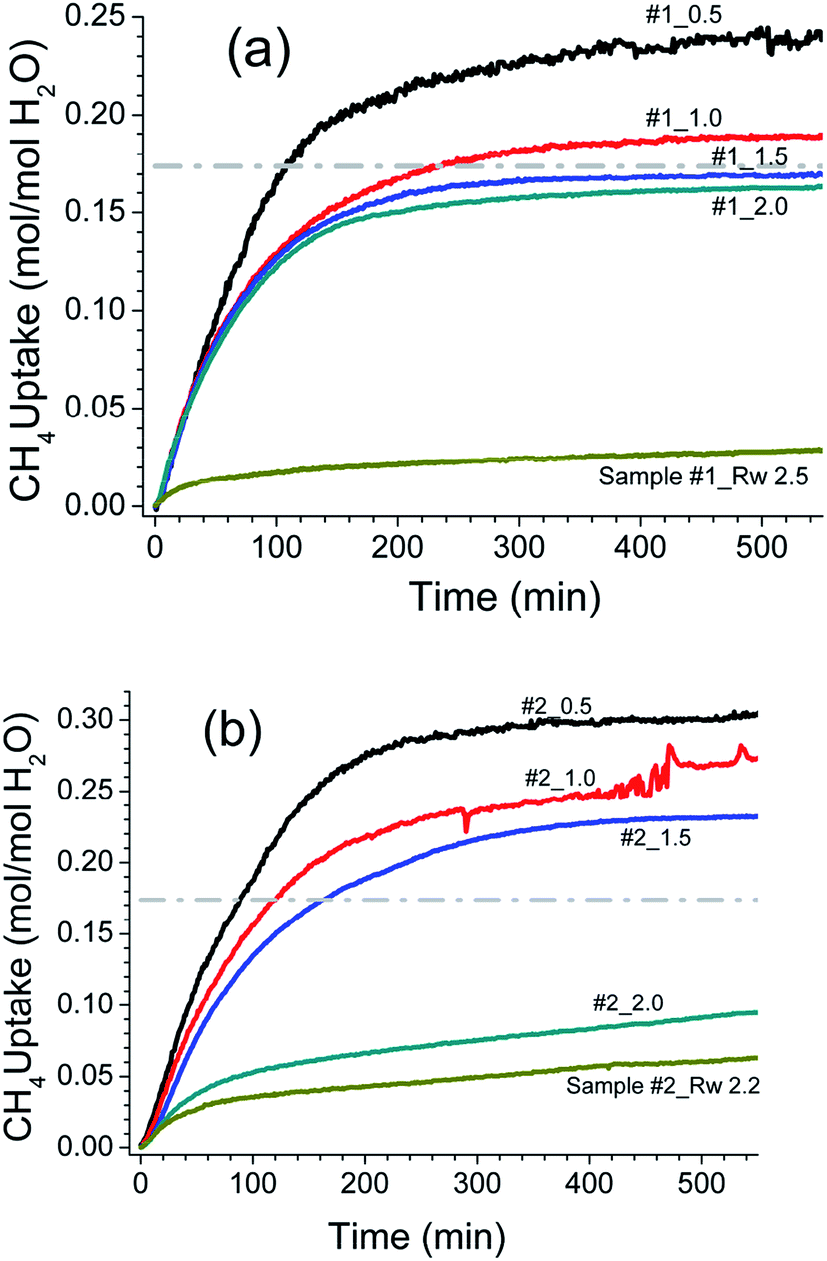 | ||
| Fig. 4 Observed methane gas uptake (normalised with H2O) in first 550 min after the onset of methane hydrate nucleation for micron grain (sample #1 – (a)) and nano grain (sample #2 – (b)) silica. The Rw values are shown along each curve, and each curve is the average behaviour of at least three repeat measurements. | ||
 | ||
| Fig. 5 The long duration kinetics plot of methane uptake during the hydrate formation in both silica samples. The corresponding Rw values are shown along the curves. | ||
As said, the formation of gas hydrates is a phase transformation to solid-state from liquid (H2O) and gaseous guest molecules. The process of methane hydrate formation can be fitted using the well-known classical crystallisation Avrami model for phase change.51–53 The following equations govern the model:
| α = 1 − exp(−k(t)n) | (1) |
| S. no | Rw | Nanoshel silica (sample #1) | Aldrich silica (sample #2) | ||
|---|---|---|---|---|---|
| n | k (mmol per mol H2O per min) | n | k (mmol per mol H2O per min) | ||
| 1 | 0.5 | 1.26 | 8.0 × 10⁻⁷ | 1.11 | 16.1 × 10⁻⁷ |
| 2 | 1.0 | 1.26 | 9.2 × 10⁻⁷ | 1.22 | 9.3 × 10⁻⁷ |
| 3 | 1.5 | 1.64 | 3.2 × 10⁻⁷ | 1.48 | 2.8 × 10⁻⁷ |
| 4 | 2.0 | 1.30 | 8.5 × 10⁻⁷ | 1.51 | 2.1 × 10⁻⁷ |
| 5 | 2.2 | — | — | 1.23 | 4.4 × 10⁻⁷ |
| 6 | 2.5 | 1.08 | 4.9 × 10⁻⁷ | — | — |
From the previous studies, it is well established that the Raman spectroscopy has unambiguous spectral signatures for the methane molecules in free/dissolved state or encased in clathrate cages.44,54 The methane molecules encaged in the clathrate phase have distinguishable Raman shifts at 2915 and 2904 cm−1 corresponding to methane in two different cages, whereas, in the gas/dissolved phase it shows a single mode at 2918 cm−1. Such diverse signatures are useful in establishing the molecular configuration of methane molecules. We collected the Raman signatures of the hydrates grown in these two silica matrices and the detailed procedure adopted for such measurements is described earlier.44 From Fig. 6, we can realise that the recorded spectrum in the C–H stretching mode region on both the samples is comparable to the methane hydrate features. The Raman shifts at 2915 and 2904 cm−1, full width at the half-maximum intensity and their relative intensity ratio are comparable with methane molecules encased in sI cages.44,54
 | ||
| Fig. 6 The Raman spectroscopic signatures of the methane hydrates formed in two silica samples. | ||
Contemporary literature states that the hydrate grain size is one of the parameters that portray phase boundary (PB) points of methane hydrates. In particular, methane hydrates formed in narrow pores (∼10 nm) are less stable than bulk hydrates and its PB point shifts to inhibition side. Furthermore, a progressive shift towards the bulk PB point has been reported as a function of increasing hydrate grain size.14 On the other hand, pure hydrates of 100 μm or bigger have no effect and their phase boundary points coincide well with bulk hydrates.14,55,56 Observed phase boundary behaviour, as shown in Fig. 7, in two silica samples investigated presently, agrees with this scenario. In all the experiments, the hydrate samples were dissociated with a heating rate of 1–2° h−1 and the reported values are the averages of repeat measurements. In under-saturate systems (Rw = 0.5) the PB point (279.8 ± 0.5 K, & 7.4 MPa) is lower by about 3 K in nanosized silica (sample #2); while that for sample #1 (283.8 ± 0.5 K, & 7.7 MPa) closely matches with bulk hydrates. The PB points shifts progressively towards 282.8 ± 0.5 K (7.7 MPa) as Rw ratio is increased to 2.2. We conjecture this could be due to the formation of thicker water layer (and therefore hydrate) within the nanosized silica. However, no such systematic shift is evident in micron-sized silica (sample #1). Still, the PB point has shifted by about 1.5–2.0 K to the right of bulk hydrate, i.e., towards the promotion side, and reasons could be multifold. Generally, the location of the thermal sensor, particularly when heat transfer is non-uniform, and faster hydrate dissociation rate with insufficient equilibration time. However, the primary goal of these measurements is to ensure the hydrate formation in water + silica system, and there is a measurable shift in their PB points. Tohidi et al.,57 have demonstrated that insufficient equilibration time in step heating could cause measurable drift in the dissociation temperature. Further, Park et al.,58 have reported that the PB points of methane hydrates, within the silica matrix (dry water), move to the promotion side by a small increment and this has been mainly attributed due to heat transfer efficiency of the matrix material.
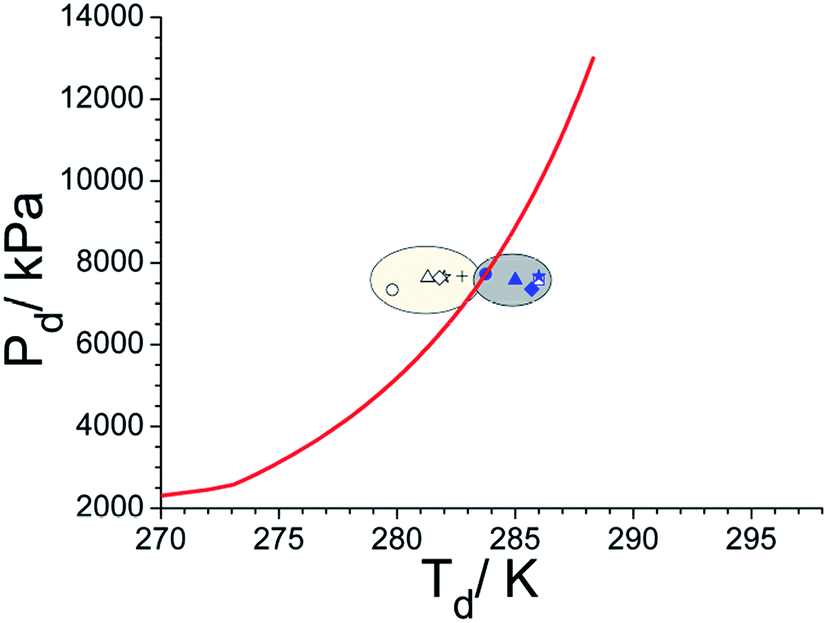 | ||
| Fig. 7 A plot showing the phase boundary points of methane hydrates formed in two silica samples. Each point is an average of at least three repeat measurements. The solid curve is computed behaviour using CSMGEM programme. The experimental points in the shaded portions are for sample #1 (right) and #2 (left). The circle, triangle, star and diamond symbols are used to depict the PB point with Rw = 0.5, 1.0, 1.5 and 2.0 (solid & open symbols for samples #1 & #2), while the open square and plus symbols represent the PB for sample #1 (Rw = 2.5) and sample #2 (Rw = 2.2). | ||
Conclusions
Methane hydrate formation in micro- and nanosized grain silica were studied under isochoric conditions in the pressure range 7–8 MPa. These systems are representative to fine-grained and the clay-rich sedimentary environment. The water content (5–30 g) in a fixed amount of silica (10 g) was varied systematically to probe the hydrate formation in under-saturated, saturated and oversaturated conditions. Our experiments have unambiguously provided pieces of evidence that the improved methane gas consumption in wet silica system is because of hydrate formation and excess gas consumption (>0.174 mol mol−1 H2O) could increase mainly due to free-gas adsorption. However, it is difficult to assign a particular reason for gas consumption, particularly in under-saturated H2O–SiO2 system. Nevertheless, rapid (2–3 h) and efficient (>75%) hydrate conversion, particularly in pore water-saturated silica system, is useful for gas storage applications. We also observed a dramatic fall in hydrate conversion efficiency in micro-sized silica (sample #1) upon over-saturating the pore water. In other words, even on the longer duration, conversion of confined water into hydrates is negligible in over-saturated silica. In contrast, the hydrate conversion is slower in nanosized silica. Overall, methane gas consumption at equal pore-filling ratio is comparably high in nanosized silica, probably could be due to the higher surface area.Conflicts of interest
There are no conflicts to declare.Acknowledgements
Authors sincerely thank the Director of the National Geophysical Research Institute, Hyderabad, for his encouragement, and permission to publish this paper (NGRI/Lib/2020/Pub-48). Financial support from DGH-NGHP (India) is acknowledged. Authors sincerely thank the comments/suggestions from the anonymous reviewers and helped improve the presentation.References
- E. D. Sloan and C. A. Koh, Clathrate hydrates of natural gases, CRC Press, Taylor & Francis Group, Boca Raton, 3rd edn, 2008, Ch. 2 Search PubMed.
- P. Englezos, Clathrate hydrates, Ind. Eng. Chem. Res., 1993, 32, 1251–1274 CrossRef.
- B. Beauchamp, Natural gas hydrates: myths, facts and issues, C. R. Geosci., 2004, 336, 751–765 CrossRef CAS.
- J. S. Gudmundsson, M. Parlaktuna, O. I. Levik and V. Andersson, Laboratory for continuous production of natural gas hydrates, Ann. N. Y. Acad. Sci., 2006, 912, 851–858 CrossRef.
- P. S. R. Prasad and V. D. Chari, Preservation of methane gas in the form of hydrates: use of mixed hydrates, J. Nat. Gas Sci. Eng., 2015, 25, 10–14 CrossRef CAS.
- L. C. Ho, P. Babu, R. Kumar and P. Linga, HBGS (hydrate based gas separation) process for carbon dioxide capture employing an unstirred reactor with cyclopentane, Energy, 2013, 63, 252–259 CrossRef CAS.
- K. C. Kang, P. Linga, K.-N. Park, S.-J. Choi and J.-D. Lee, Seawater desalination by gas hydrate process and removal characteristics of dissolved ions (Na+, K+, Mg2+, Ca2+, B3+, Cl−, SO42−), Desalination, 2014, 353, 84–90 CrossRef CAS.
- B. Castellani, M. Filipponi, A. Nicolini, F. Cotana and F. Rossi, Carbon dioxide capture using gas hydrate technology, J. Energy Power Eng., 2013, 7, 883–890 CAS.
- Y. Sowjanya and P. S. R. Prasad, Formation kinetics & phase stability of double hydrates of C4H8O and CO2/CH4: a comparison with pure systems, J. Nat. Gas Sci. Eng., 2014, 18, 58–63 CrossRef CAS.
- H. Dashti, L. Z. Yew and X. Lou, Recent advances in gas hydrate-based CO2 capture, J. Nat. Gas Sci. Eng., 2015, 23, 195–207 CrossRef CAS.
- G. Bhattacharjee, A. Kumar, T. Sakpal and R. Kumar, Carbon dioxide sequestration: influence of porous media on hydrate formation kinetics, ACS Sustainable Chem. Eng., 2015, 3, 1205–1214 CrossRef CAS.
- A. Kumar, B. Bhattacharjee, V. Barmecha, S. Diwan and O. S. Kushwaha, Influence of kinetics and thermodynamic promoters on post-combustion carbon dioxide capture through hydrate crystallization, J. Environ. Chem. Eng., 2016, 4, 1955–1961 CrossRef CAS.
- J. Rajnauth, M. Barrufet and G. Falcone, Potential Industry Applications Using Gas Hydrate Technology, West Indian J. Eng., 2013, 35, 15–21 Search PubMed.
- S. P. Kang and J. W. Lee, Formation characteristics of synthesized natural gas hydrates in meso- and macroporous silica gels, J. Phys. Chem. B, 2010, 114, 6973–6978 CrossRef CAS.
- P. Linga, N. Daraboina, J. A. Ripmeester and P. Englezos, Enhanced rate of gas hydrate formation in a fixed bed column filled with sand compared to a stirred vessel, Chem. Eng. Sci., 2012, 68, 617–623 CrossRef CAS.
- W. F. Waite, W. J. Winters and H. Mason, Methane hydrate formation in partially water saturated Ottawa sand, Am. Mineral., 2004, 89, 1202–1207 CrossRef CAS.
- W. Wang, L. B. Christopher, D. J. Adams and A. I. Cooper, Methane storage in dry water gas hydrates, J. Am. Chem. Soc., 2008, 130, 11608–11609 CrossRef CAS PubMed.
- M. B. Clennell, M. Hovland, J. S. Booth, P. Henry and W. J. Winters, Formation of natural gas hydrates in marine sediments: 1. Conceptual model of gas hydrate growth conditioned by host sediment properties, J. Geophys. Res., B, 1999, 104, 22985–23003 CrossRef CAS.
- M. B. Clennell, P. Henry, M. Hovland, J. S. Booth, W. J. Winters and M. Thomas, Formation of natural gas hydrates in marine sediments: gas hydrate growth and stability conditioned by host sediment properties, Ann. N. Y. Acad. Sci., 2000, 912, 887–896 CrossRef CAS.
- P. Henry, M. Thomas and M. B. Clennell, Formation of natural gas hydrates in marine sediments: 2. Thermodynamic calculations of stability conditions in porous sediments, J. Geophys. Res., B, 1999, 104, 23005–23022 CrossRef CAS.
- T. S. Collett, M. Riedel, J. R. Cochran, R. Boswell, P. Kumar and A. V. Sath, NGHP Expedition 01 Scientific Party, Indian Continental Margin Gas Hydrate Prospects: Results of the Indian National Gas Hydrate Program (NGHP) Expedition 01, Proceedings of the 6th International Conference on Gas Hydrates (ICGH 2008), Vancouver, British Columbia, Canada, July 6–10, 2008 Search PubMed.
- P. Kumar, T. S. Collett, R. Boswell, J. R. Cochran, M. Lall, A. Mazumdar, M. V. Ramana, T. Ramprasad, M. Riedel, K. Sain, A. V. Sathe, K. Vishwanath and U. S. Yadav, Geologic Implications of Gas Hydrates in the Offshore of India: Krishna-Godavari Basin, Mahanadi Basin, Andaman Sea, Kerala-Konkan Basin, Mar. Pet. Geol., 2014, 58, 29–98 CrossRef CAS.
- G. Ginsburg, V. Soloviev, T. Matveeva and I. Andreeva, Sediment grain-size control on gas hydrate presence, sites 994, 995, and 997, Proc. Ocean Drill. Program: Sci. Results, 2000, 164, 237–245 CAS.
- J. Guanli, W. Qingbai and Z. Jing, Effect of cooling rate on methane hydrate formation in media, Fluid Phase Equilib., 2010, 298, 225–230 CrossRef.
- P. S. R. Prasad, V. D. Chari, D. V. S. G. K. Sharma and S. R. Murthy, Effect of silica particles on the stability of methane hydrates, Fluid Phase Equilib., 2012, 318, 110–114 CrossRef CAS.
- Z. R. Chong, M. Yang, B. C. Khoo and P. Linga, Size effect of porous media on methane hydrate formation and dissociation in an excess gas environment, Ind. Eng. Chem. Res., 2016, 55, 7981–7991 CrossRef CAS.
- V. Govindaraj, D. Mech, G. Pandey, R. Nagarajan and J. S. Sangwai, Kinetics of methane hydrate formation in the presence of activated carbon and nano-silica suspensions in pure water, J. Nat. Gas Sci. Eng., 2015, 26, 810–818 CrossRef CAS.
- V. D. Chari, D. V. S. G. K. Sharma, P. S. R. Prasad and S. R. Murthy, Methane hydrates formation and dissociation in nano silica suspension, J. Nat. Gas Sci. Eng., 2013, 11, 7–11 CrossRef CAS.
- V. D. Chari, B. Raju, P. S. R. Prasad and D. N. Rao, Methane hydrates in spherical silica matrix: optimization of capillary water, Energy Fuels, 2013, 27, 3679–3684 CrossRef CAS.
- P. S. R. Prasad, Y. Sowjanya and V. D. Chari, Enhancement in Methane Storage Capacity in Gas Hydrates Formed in Hollow Silica, J. Phys. Chem. C, 2014, 118, 7759–7764 CrossRef CAS.
- P. S. R. Prasad, Methane hydrate formation and dissociation in the presence of hollow silica, J. Chem. Eng. Data, 2015, 60, 304–310 CrossRef CAS.
- H. P. Veluswamy, P. S. R. Prasad and P. Linga, Hydrate crystal growth and mechanism of methane hydrate formation in the presence of hollow silica, Korean J. Chem. Eng., 2016, 33, 2050–2062 CrossRef CAS.
- A. Kumar, T. Sakpal, P. Linga and R. Kumar, Enhanced carbon dioxide hydrate formation kinetics in a fixed bed reactor filled with metallic packing, Chem. Eng. Sci., 2015, 122, 78–85 CrossRef CAS.
- J. W. Jung and J. C. Santamarina, Hydrate formation and growth in pores, J. Cryst. Growth, 2012, 345, 61–68 CrossRef CAS.
- Y. Jin, Y. Konno and J. Nagao, Growth of methane clathrate hydrates in porous media, Energy Fuels, 2012, 26, 2242–2247 CrossRef CAS.
- A. Celzard and J. F. Marêché, Optimal wetting of active carbons for methane hydrate formation, Fuel, 2006, 85, 957–966 CrossRef CAS.
- A. Siangsai, P. Rangsunvigit, B. Kitiyanan, S. Kulprathipanja and P. Linga, Investigation on the roles of activated carbon particle sizes on methane hydrate formation and dissociation, Chem. Eng. Sci., 2015, 126, 383–389 CrossRef CAS.
- J. Zhou, W. Su, Y. Sun, S. Deng and X. Wang, Enhanced CO2 sorption on ordered mesoporous carbon CMK-3 in the presence of water, J. Chem. Eng. Data, 2016, 61, 1348–1352 CrossRef CAS.
- M. E. Casco, J. Silvestre-Albero, A. J. Ramirez-Cuesta, F. Rey, J. L. Jorda, A. Bansode, A. Urakawa, I. Peral, M. Martinez-Escandell, K. Kaneko and F. Rodriguez-Reinoso, Methane hydrate formation in confined nanospace can surpass nature, Nat. Commun., 2015, 6, 6432 CrossRef CAS PubMed.
- J. Liu and D. Liang, Investigation on methane hydrate formation in silica gel particles below the freezing point, RSC Adv., 2019, 9, 15022–15032 RSC.
- H. Liu, P. Guo, S. Zhan, P. Ma, N. Wei, J. Zhao and Y. Qiu, Experimental investigation into formation/dissociation characteristics of methane hydrate in consolidated sediments with resistance measurement, Fuel, 2018, 234, 985–995 CrossRef CAS.
- S. Y. Misyura, The influence of porosity and structural parameters on different kinds of gas hydrate dissociation, Sci. Rep., 2016, 6, 30324, DOI:10.1038/srep30324.
- S. Y. Misyura and I. G. Donskoy, Ways to improve the efficiency of carbon dioxide utilization and gas hydrate storage at low temperatures, J. CO2 Util., 2019, 34, 313–324 CrossRef CAS.
- V. D. Chari, P. S. R. Prasad and S. R. Murthy, Structural stability of methane hydrates in porous medium: Raman spectroscopic study, Spectrochim. Acta, Part A, 2014, 120, 636–641 CrossRef CAS PubMed.
- Z. Zhang, W. Wang, X. Chen, R. Xie, P. Gao, W. Wei and Y. Sun, CO2 sorption in wet ordered mesoporous silica KIT-6: effects of water content and mechanism on enhanced sorption capacity, Adsorption, 2014, 20, 883–888 CrossRef CAS.
- L. A. Stern, S. H. Kirby and W. B. Durham, Peculiarities of methane clathrate hydrate formation and solid state deformation, including possible superheating of water ice, Science, 1996, 273, 1843–1848 CrossRef CAS.
- A. N. Nesterov, A. M. Reshetnikov, A. Y. Manakov, T. V. Rodionova, E. A. Paukshtis, I. P. Asanov, S. P. Bardakhanov and A. I. Bulavchenko, Promotion and inhibition of gas hydrate formation by oxide powders, J. Mol. Liq., 2015, 204, 118–125 CrossRef CAS.
- S. A. Bagherzadeh, S. Alavi, J. John Ripmeester and P. Englezos, Formation of methane nano-bubbles during hydrate decomposition and their effect on hydrate growth, J. Chem. Phys., 2015, 142, 214701 CrossRef PubMed.
- D. Bai, G. Chen, X. Zhang, A. K. Sum and W. Wang, How properties of solid surfaces modulate the nucleation of gas hydrates, Sci. Rep., 2015, 5, 12747 CrossRef CAS.
- S. Takeya, H. Fujihisa, Y. Gotoh, V. Istomin, E. Chuvilin, H. Sakagami and A. Hachikubo, Methane clathrate hydrates formed within hydrophilic and hydrophobic media: kinetics of dissociation and distortion of host structure, J. Phys. Chem. C, 2013, 117, 7081–7085 CrossRef CAS.
- R. Susilo, J. A. Ripmeester and P. Englezos, Methane Conversion Rate into Structure H Hydrate Crystals from Ice, AIChE J., 2007, 53, 2451–2460 CrossRef CAS.
- A. Falenty, G. Genov, T. C. Hansen, W. F. Kuhs and A. N. Salamatin, Kinetics of CO2 hydrate formation from water frost at low temperatures: experimental results and theoretical model, J. Phys. Chem. C, 2011, 115, 4022–4032 CrossRef CAS.
- A. Nambiar, P. Babu and P. Linga, CO2 capture using the clathrate hydrate process employing cellulose foam as a porous media, Can. J. Chem., 2015, 93, 808–814 CrossRef CAS.
- A. K. Sum, R. C. Burruss and E. D. Sloan, Measurement of Clathrate Hydrates via Raman Spectroscopy, J. Phys. Chem. B, 1997, 101, 7371–7377 CrossRef.
- A. Hachikubo, S. Takeya, E. Chuvilin and V. Istomin, Preservation phenomena of methane hydrate in pore spaces, Phys. Chem. Chem. Phys., 2011, 13, 17449–17452 RSC.
- S.-C. Sun, C.-L. Liu, Y.-G. Ye and Y.-F. Liu, Phase behavior of methane hydrate in silica sand, J. Chem. Thermodyn., 2014, 69, 118–124 CrossRef.
- B. Tohidi, R. W. Burgass, A. Danesh, K. K. Ostergaard and A. C. Todd, Improving the accuracy of gas hydrate dissociation point measurements, Ann. N. Y. Acad. Sci., 2000, 912, 924–931 CrossRef.
- J. Park, K. Shin, J. Kim, H. Lee, Y. Seo, N. Maeda, W. Tian and C. D. Wood, Effect of hydrate shell formation on the stability of dry water, J. Phys. Chem., 2015, 119, 1690–1699 Search PubMed.
Footnote |
| † Electronic supplementary information (ESI) available. See DOI: 10.1039/d0ra01754j |
| This journal is © The Royal Society of Chemistry 2020 |