DOI:
10.1039/D0RA01721C
(Paper)
RSC Adv., 2020,
10, 14487-14492
Effects of metal cation doping in CeO2 support on catalytic methane steam reforming at low temperature in an electric field†
Received
22nd February 2020
, Accepted 31st March 2020
First published on 8th April 2020
Abstract
Catalytic methane steam reforming was conducted at low temperature using a Pd catalyst supported on Ce1−xMxO2 (x = 0 or 0.1, M = Ca, Ba, La, Y or Al) oxides with or without an electric field (EF). The effects of the catalyst support on catalytic activity and surface proton hopping were investigated. Results show that Pd/Al-CeO2 (Pd/Ce0.9Al0.1O2) showed higher activity than Pd/CeO2 with EF, although their activity was identical without EF. Thermogravimetry revealed a larger amount of H2O adsorbed onto Pd/Al-CeO2 than onto Pd/CeO2, so Al doping to CeO2 contributes to greater H2O adsorption. Furthermore, electrochemical conduction measurements of Pd/Al-CeO2 revealed a larger contribution of surface proton hopping than that for Pd/CeO2. This promotes the surface proton conductivity and catalytic activity during EF application.
1 Introduction
Currently, H2 is anticipated as an alternative energy source to fossil fuel, and as an important resource for chemical industries. The most widely used process for H2 production is methane steam reforming (MSR),1,2 the reaction of which proceeds as shown in eqn (1). The water gas shift reaction proceeds sequentially as shown in eqn (2). The total reaction can be presented as eqn (3).| | |
CH4 + H2O → CO + 3H2 ΔH0298 = 206.1 kJ mol−1
| (1) |
| | |
CO + H2O → CO2 + H2 ΔH0298 = −41.2 kJ mol−1
| (2) |
| | |
CH4 + 2H2O → CO2 + 4H2 ΔH0298 = 164.9 kJ mol−1
| (3) |
In general, this reaction is conducted industrially at high temperatures over 973 K with Ni catalysts to achieve high H2 yield because it is a highly endothermic reaction and because CH4 has a solid C–H bond.1–9 Nevertheless, such a severe condition entails many severe shortcomings such as carbon deposition, catalyst deactivation, and the need for heat-resistant materials and multiple heat-exchange processes. To resolve these difficulties, various catalytic research efforts related to MSR have been investigated to decrease the reaction temperature. Several researchers have reported that MSR can proceed at 873 K over Ni-based catalysts,10,11 but further investigation must be undertaken to establish new catalytic processes for obtaining high conversion rates, even at low temperatures.
Our earlier studies12–19 revealed that application of an electric field (EF) to Pd, Pt, or Rh catalyst supported on CeO2 enabled MSR to proceed even at low temperature such as 473 K. Especially in a lower temperature region (T < 600 K), CH4 conversion exceeded the thermodynamic equilibrium.15 Furthermore, various experiments were conducted to investigate the reaction mechanism with EF, and the following results were obtained. Firstly, to observe changes of the surface species with EF, operando – diffuse reflectance infrared Fourier transform (DRIFT) measurements using Pd/CeO2 catalyst were conducted.15 When EF was applied, the peak at 855 cm−1 was observed, which strongly relates to proton conduction via H bond of water, so-called the Grotthuss mechanism. Furthermore, peak of the O–H stretching bond shifted to lower wavenumber, which indicated that the water is activated by applying EF. These results revealed applying the EF promotes surface proton hopping via adsorbed H2O on the catalyst surface. Kinetics analysis using isotope were also conducted, and the inverse kinetic isotope effect (inverse KIE) was observed only when EF was applied.16 Considering inverse KIE theory and surface proton conduction in EF, the reaction mechanism is considered that proton collides with CH4. Second, to elucidate the active site, turn over frequency (TOF) normalized by the number of Pd on both two sites, perimeter and surface, were calculated respectively. Results revealed that TOF of the reaction with EF depends on the number of Pd at perimeter, although that of conventional thermal reaction depends on the number of surface Pd.15 Hence, the active site is metal-support interface in the reaction with EF, while that is the metal surface in the conventional reaction. To summarize these works, it is revealed that the hopping proton collides with CH4 at the metal–support interface, which promotes dissociative adsorption of CH4, the rate-determining step of MSR.15,16 These results demonstrated that the reaction mechanism with EF differs completely from the conventional one.
Consequently, surface proton hopping has a fundamentally important effect for obtaining high catalytic activity in MSR with EF. Because surface proton hopping occurs mainly over catalyst support,20 the surface proton hopping and MSR activity in the EF can presumably be controlled by doping various cations to the catalyst support. This study was aimed at increasing the catalytic activity with EF by doping various cations to the catalyst support, anticipating the improvement of surface proton conduction. To investigate the doping effects on activity and surface ion conductivity, various Pd/Ce1−xMxO2 (x = 0 or 0.1; M = Ca, Ba, La, Y or Al) catalysts were prepared. Then their MSR activity and surface ion conductivity were evaluated.
2 Experimental
2.1. Catalyst preparation
For this study, CeO2 and Ce0.9M0.1O2 (M = Ca, Ba, La, Y or Al) supports were prepared using a complex polymerization method with each metal nitrate, e.g. Ce(NO3)3·6H2O, Ca(NO3)2·4H2O, Ba(NO3)2, La(NO3)3·6H2O, Y(NO3)3·6H2O and Al(NO3)3·9H2O (Kanto Chemical Co. Inc.). After ethylene glycol and citric acid were dissolved in distilled water, metal nitrates were dissolved in the solution. The resultant mixed solution was heated at 343 K for 24 h with stirring. Then the solution was heated on a hot plate to remove water completely. The obtained powders were calcined at 773 K for 5 h, with a ramping rate of 10 K min−1.
As an active metal, Pd (1.0 wt%) was loaded on the prepared CeO2 or Ce0.9M0.1O2 (M-CeO2) support using an impregnation method with Pd(OCOCH3)2 (Kanto Chemical Co. Inc.) as a metal precursor. After drying catalysts at 393 K for 24 h, they were calcined at 723 K for 6 h, with a ramping rate of 10 K min−1.
2.2. Catalytic activity test
Catalytic activity tests were conducted using a fixed-bed flow-type reactor at atmospheric pressure. A quartz tube (8.0 mm o.d., 6.0 mm i.d.) was used as the reactor tube. Catalyst (80 mg) was placed in the reactor. The catalyst bed height was 1.6 mm, and we confirmed that the condition is in the kinetic region and that diffusion is not a rate determining factor. Two stainless steel electrodes (2.0 mm o.d.) were inserted into the reactor and were attached to both the top and bottom sides of the catalyst bed. As DC current (3–9 mA) was applied to the catalyst bed through these electrodes, the response voltage was recorded using a digital phosphor oscilloscope (TDS 2001C; Tektronix Inc.). The actual catalyst bed temperature was monitored using a thermocouple inserted into the reactor. The furnace temperature was fixed at 473 K for the reaction in EF. The reaction gas composition was CH4![[thin space (1/6-em)]](https://www.rsc.org/images/entities/char_2009.gif) :H2O:Ar = 1:2:7 (total flow rate: 120 SCCM). The product gases were analyzed after the reaction using a gas chromatograph (GC-2014; Shimadzu Corp.) with a flame ionization detector (FID) and a handmade methanizer (Ru/Al2O3). CH4, CO, and CO2 were assessed using GC-FID with a Porapak QS packed column. The reaction rate was calculated using the amount of generated CO and CO2 (rCO+CO2).
:H2O:Ar = 1:2:7 (total flow rate: 120 SCCM). The product gases were analyzed after the reaction using a gas chromatograph (GC-2014; Shimadzu Corp.) with a flame ionization detector (FID) and a handmade methanizer (Ru/Al2O3). CH4, CO, and CO2 were assessed using GC-FID with a Porapak QS packed column. The reaction rate was calculated using the amount of generated CO and CO2 (rCO+CO2).
2.3. Evaluation of the Pd loading state
2.3.1. CO-pulse adsorption measurement. With a catalyst analyzer (BELCAT II; Microtrac BEL Corp.), we took CO-pulse measurements to evaluate the particle size of the supported Pd. About 50 mg of each catalyst was placed in the cell. First, the catalyst was heated to 473 K for 60 min under He atmosphere as a pre-treatment. Then, the temperature was cooled to 323 K and kept for a while. After these operations, a series of CO pulses was injected until the detected CO amount reached a steady state. The amount of adsorbed CO on Pd was measured assuming adsorption stoichiometry of CO/Pd = 1.
2.3.2. Diffuse reflectance infrared Fourier transform spectroscopy (DRIFTS) measurement. We conducted DRIFTS measurements with resolution of 2 cm−1 and 50 scans using an FT-IR spectrometer (FT/IR-6200; Jasco Corp.) equipped with an MCT detector and ZnSe window. About 80 mg of catalysts sieved to 355–500 μm were used. As a pre-treatment, the catalyst was heated at 723 K for 30 min and was then cooled to 323 K, supplying only Ar (65 SCCM flow rate). Subsequently, the background spectra (BKG) were recorded. The spectra of adsorbed CO on Pd over the respective supports were recorded after purging with CO + Ar gas (CO:Ar = 1:12; 65 SCCM total flow rate) for 10 min.
2.3.3. X-ray photoelectron spectroscopy (XPS) measurement. The electronic state of Pd over catalyst was investigated by X-ray photoelectron spectroscopy (XPS; VersaProbe 2; ULVAC-PHI Inc.). The measurements were conducted with an Al Kα X-ray source. The binding energies were calibrated to C 1s peak at 284.8 eV. The distribution of Pd0 and Pd2+ was estimated by each peak area of 3d5/2 and 3d3/2.
2.4. Other characterizations
Powder X-ray diffraction (XRD; SmartLab III; Rigaku Corp.) for each sample was observed at 40 kV and 40 mA with Cu-Kα radiation in order to investigate the crystalline structure of Pd loaded catalysts and supports. Results are shown in Fig. S1 and S6 (ESI).† Raman spectra were recorded with a Raman spectroscopy (NRS-4500; JASCO Corp.). Moreover, we took inductively coupled plasma optical emission spectrometry (ICP-OES; 5100 ICP-OES, Agilent Inc.) to detect the molar ratio of the support. About 20 mg of the catalyst was dissolved in nitric acid. Calibration curves were performed by Ce and Al solutions ranging from approximately 0–20 ppm.
2.5. Measurement of electron/ion conductivity
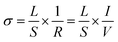
2.5.1. Electrochemical impedance spectroscopy (EIS) measurement. Electrochemical impedance spectroscopy (EIS) measurements were taken under dry (Ar) atmosphere in a two-electrode four-wire cell connected to an impedance spectrometer (alpha-Al; Novocontrol Technologies) with a ZG4 interface. The measurement sample preparation procedures are described in ESI.† Only Ar gas (50 SCCM total flow rate) was supplied into the measurement cell, at temperatures of 373–673 K. All AC impedance spectra were recorded at frequencies of 106 to 10−3 Hz with amplitude of 0.5 V RMS. The obtained data were analyzed using equivalent circuit fitting software (ZView ver. 3.5a; Scribner Associates Inc.). The equivalent circuit model is a simple RC parallel circuit of bulk component. Electrical conductivity was calculated using eqn (4), where L represents the pellet thickness, S denotes the Pt electrode area, and R stands for the fitted resistance value.| |
 | (4) |
2.5.2. Measurement of apparent conductivity using a reactor. The apparent conductivity including electrons and ions of each sample was assessed under the reaction atmosphere using a fixed-bed flow-type reactor with conditions identical to those described in Section 2.2. The furnace temperature was changed in the range of 333–573 K. DC current (9 mA) was applied at 10 min after the reactant gases were provided. The response voltages at 5 and 10 min after application of current were recorded with an oscilloscope at each temperature. The apparent electron/ion conductivity calculated using eqn (4), where I denotes the applied current and V signifies the response voltage.
2.6. Characterization for adsorbed H2O
2.6.1. In situ DRIFTS measurements. To evaluate surface adsorbed H2O on the catalyst, in situ DRIFTS measurements were performed under the same conditions and using the catalysts as those described in 2.3.1. The temperature was increased to 473 K under only Ar atmosphere (65 SCCM). The BKG spectra were recorded after the temperature was stabilized. The spectra were recorded after supplying the reactant gases (CH4:H2O:Ar = 1:2:62; 65 SCCM total flow rate) for 10 min.
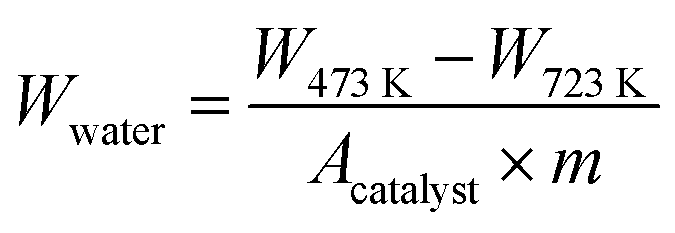
2.6.2. Thermogravimetry (TG) measurements. Using a thermogravimetric analyzer (TGA-50; Shimadzu Corp.) we took TG measurements. After about 40 mg of each catalyst was heated at 723 K for over 60 min under Ar atmosphere (100 SCCM flow rate), the sample was cooled to 323 K and heated to 723 K with a ramping rate of 5 K min−1 under wet gas (H2O:Ar = 1:49; 100 SCCM total flow rate). During these procedures, the weight change of sample was attributed to H2O adsorption/desorption. The amount of adsorbed H2O was calculated using eqn (5). The specific surface area of catalysts (denoting Acatalyst in the following eqn. (5)) was measured using N2 adsorption by the Brunauer–Emmett–Teller (BET) method using an automated specific surface area analyzer (Gemini VII; Micromeritics Instrument Corp.).| |
 | (5) |
Wwater/mg m−2: the amount of adsorbed H2O per specific surface area at 473 K, W473 K (723 K)/g: weight loss at 473 K (723 K), Acatalyst/m2 g−1: specific surface area of catalysts, m/g: initial weight of catalysts.
3 Results and discussion
3.1. Catalytic activity tests
Catalytic activity tests were performed using 1.0 wt%Pd/M-CeO2 (M = Ca, Ba, Y, La or Al) with and without an electric field (EF) to evaluate the metal doping effect on catalytic activity. Results are presented in Fig. 1. In addition, the temperature dependence of CH4 conversion without EF and its related data are presented respectively in Fig. S2 and Table S1.† Without application of EF (Fig. 1(A)), although little difference of catalytic activity at higher temperature than 700 K was observed from Fig. S2 (ESI),† the apparent activation energies were almost identical among all catalysts (Table S1).† Considering that the catalytic activity is known to depend on the metal dispersion and electronic state of the supported metal, the metal dispersion and the electronic state of the supported metal have little difference among these catalysts. With EF (Fig. 1(B)), however, the activity varied markedly by doping different metal cations. Particularly, as presented in Fig. 1(C), Pd/Al-CeO2 showed higher activity than Pd/CeO2 with EF at the same electric power (EP) input (0.8 W). To clarify the positive effect of Al-doping on the catalytic activity with EF, various characterizations were conducted for both Pd/CeO2 and Pd/Al-CeO2 in the following sections.
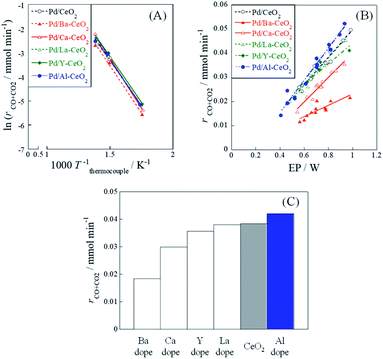 |
| | Fig. 1 Catalytic activity of 1.0 wt%Pd/M-CeO2 (M = Ca, Ba, La, Y or Al). (A) Arrhenius plots without EF at 523–723 K, (B) electric power (EP) dependences of activity with EF (3–9 mA) at 473 K, and (C) catalytic activity with EF (EP = 0.8 W) at 473 K. | |
3.2. Pd loading state
Catalytic activity is well known to depend on the metal particle size and electronic state of the supported metal. To investigate the particle size and electronic state of the supported Pd, CO-pulse chemisorption and DRIFTS measurements were conducted with CO adsorption. Results of CO-pulse measurements show that the Pd particle size of Pd/Al-CeO2 was similar to that of Pd/CeO2 (Pd/CeO2: 1.12 nm, Pd/Al-CeO2: 1.60 nm). The results of XPS is shown in Fig. 2 and Table 1. The peaks at 335.30 eV for Pd/CeO2 and 335.39 eV for Pd/Al-CeO2 were assigned to Pd 3d5/2, while the peaks at 336.52 eV for Pd/CeO2 and 336.75 eV for Pd/Al-CeO2 were assigned to 3d3/2, respectively.21,22 As shown in Table 1, the Pd0 distribution for Pd/CeO2 was similar to that of Pd/Al-CeO2 (Pd/CeO2; 42.2%, Pd/Al-CeO2; 38.4%). The apparent activation energies Ea for these catalysts were also similar without the electric field. Results of DRIFTS measurements after CO adsorption are shown in Fig. S3.† Both catalysts showed a peak at 2087 cm−1, which is assignable to the stretching vibration of liner-adsorbed CO on Pd (2100–2000 cm−1).23,24 Because the wavenumber of this peak on Pd/CeO2 was equal to that on Pd/Al-CeO2, the electronic states of the supported Pd over these catalysts are estimated as the same. By CO-pulse, XPS and DRIFTS measurements, results suggest that the Pd loading state over each support was almost identical. Therefore, we inferred that the difference in catalytic activity with EF between Pd/CeO2 and Pd/Al-CeO2 was not derived from the difference in Pd loading state (i.e. the particle size and electronic state).
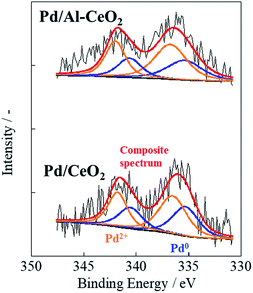 |
| | Fig. 2 Pd 3d spectra for Pd/CeO2 and Pd/Al-CeO2. | |
Table 1 The results of XPS analysis for Pd 3d5/2 and 3d3/2
| Catalyst |
Binding energy/eV |
Pd distribution at surface/% |
| Pd0 |
Pd2+ |
Pd0 |
Pd2+ |
| Pd/CeO2 |
335.3 |
336.5 |
42.2 |
57.8 |
| Pd/Al-CeO2 |
335.4 |
336.7 |
38.4 |
61.6 |
3.3. Characterization for adsorbed H2O
In principle, proton conduction depends on the strength of the O–H stretching bond of adsorbed H2O or the adsorbed amount of H2O on the surface.15,25 Therefore, the adsorbed H2O value over the catalyst was investigated qualitatively and quantitatively based respectively on DRIFTS and TG measurements. Fig. S4† shows the DRIFT spectra of Pd/CeO2 and Pd/Al-CeO2 under flowing CH4 + H2O + Ar gas at 473 K. A peak at 3675 cm−1, which is assignable to the O–H stretching bond of adsorbed H2O,26,27 was observed over both catalysts. In other words, H2O molecules surely adsorbed over the catalysts even at 473 K. This result indicated that the strengths of O–H stretching bond of adsorbed H2O over both samples were identical, and that the proton mobility would be almost identical.
Then, TG measurements were taken to quantify the amount of adsorbed H2O on the catalysts. Fig. 3 depicts the temperature dependence of the weight loss per specific surface area (SSA). As shown in Fig. 3, the amount of adsorbed H2O depended on the temperature drastically. Therefore, the amount of adsorbed H2O at 473 K for both catalysts was considered, so as to compare the effect of the amount of H2O on the surface proton hopping at the reaction temperature. Table 2 presents the calculated amount of H2O over each catalyst. As depicted in Table 2, the adsorbed amount of adsorbed H2O per unit area of Pd/Al-CeO2 was greater than that of Pd/CeO2. K. Murakami et al. revealed that the adsorption energy of H2O becomes lower with doping smaller cation like Al into CeO2 by DFT calculation.28 By doping Al to CeO2, the adsorption energy of H2O on several Ce cations which are adjacent to Al decreases. Therefore, the amount of adsorbed H2O improved drastically. In other words, doping Al to CeO2 caused that more H2O molecules adsorbed compared to Pd/CeO2, which contributed to the promotion of surface proton conduction.
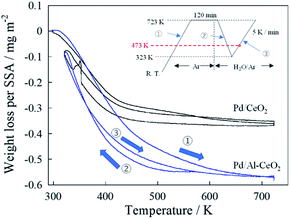 |
| | Fig. 3 Temperature dependence of weight loss on specific surface area (SSA). Inset is a flow chart of the experiment. | |
Table 2 Calculated H2O amount per unit area on Pd/CeO2 and Pd/Al-CeO2
| Catalyst |
Acat/m2 g−1 |
m/mg |
W473 K−W723 K/mg |
Wwater/mg m−2 |
| Pd/CeO2 |
41.5 |
41.2 |
0.0786 |
0.0460 |
| Pd/Al-CeO2 |
32.0 |
42.1 |
0.208 |
0.154 |
3.4. Evaluation of proton conductivity
The surface electronic/ionic conductivity plays an important role in the reaction in the electric field.15–18 The electronic/ionic conductivity was assessed under dry (Ar) and wet (reaction condition i.e. CH4:H2O:Ar = 1:2:7) atmospheres to evaluate the surface proton conduction. Fig. S5† shows the temperature dependence of conductivity for CeO2 and Al-CeO2 under a dry condition. In fact, both supports showed typical Arrhenius behavior: the conductivity decreased with decreasing temperature. In this temperature region (373 K < T < 673 K), the dominant conductive carrier mechanism was estimated as electron diffusion in the inner bulk,15,25 because there is no surface adsorbate. Comparison of the behaviors of CeO2 and Al-CeO2 reveals that the apparent activation energy and the conductive magnitude were almost equal. Fig. 4 depicts the temperature dependence of conductivity of Pd/CeO2 and Pd/Al-CeO2 under a wet condition. Results show that both supports exhibit anti-Arrhenius behavior: the conductivity increased at the lower temperature region (T < 423 K). Such a specific trend is derived from surface proton conduction at lower temperatures.15,25,29–36 Under a humid condition, H2O physisorption on grain surface is feasible at lower temperatures. Then, proton conductivity is enhanced by the formed water layer. Comparison of Pd/CeO2 and Pd/Al-CeO2, Pd/Al-CeO2 shows a larger contribution of surface proton hopping than Pd/CeO2 at lower temperatures. These results indicate that the bulk conductivity of electron is the same for CeO2 and Al-CeO2. However, the surface proton hopping is promoted by Al doping into CeO2 under a wet condition.
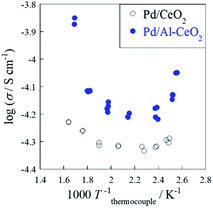 |
| | Fig. 4 Temperature dependence of electron/ion conductivity of Pd/CeO2 and Pd/Al-CeO2 under a wet condition (CH4:H2O:Ar = 1:2:7) with application of 9 mA current. | |
3.5. Discussion
Result of catalytic activity tests show that the activity with EF of Pd/Al-CeO2 was higher than that of Pd/CeO2, although no difference was found between them without application of EF. These results revealed that enhancement of activity by Al doping can be exactly attributed to the EF application.
With EF, the activity is reportedly influenced by three factors: (i) the electronic state of the active metal, (ii) the perimeter of the metal–support interface, and (iii) surface proton conductivity.15,18 The results of CO-pulse, XPS and DRIFTS measurements demonstrated that the Pd loading state over each support was almost identical, indicating that the increase of activity is attributable to the difference in catalyst support, not in the Pd loading state. Therefore, in this case, factors (i) and (ii) are negligible. We therefore specifically examined the surface proton conductive property.
The apparent activation energy and conductive magnitude of electrochemical conductivity are almost equal between CeO2 and Al-CeO2 under a dry atmosphere. From the measured temperature region (373 K < T < 673 K), the dominant conduction carrier was estimated as electron, which diffuses throughout the inner bulk for both samples. From this result, it was inferred that Al doping to CeO2 does not affect bulk electron conduction. As presented in Fig. 4, however, the apparent conductivity of Pd/Al-CeO2 was higher than that of Pd/CeO2 under a wet atmosphere, especially at low temperatures. Under such conditions, the dominant conduction carrier is expected to be proton generated from adsorbed H2O over surface. Considering that the bulk electron conductivity of both samples was identical, the difference of apparent conductivity under a wet atmosphere between these samples can be attributed to the difference in surface proton conductivity. Accordingly, the contribution of proton conduction over Pd/Al-CeO2 was greater than that over Pd/CeO2.
Generally, the factors governing proton conductivity are regarded as the strength of the O–H stretching bond of the adsorbed H2O and the amount of H2O adsorbed on the surface.15,25 From results of DRIFTS and TG measurements, it was presumed that enhancement of proton conductivity by Al doping was attributable to an increase of the adsorbed H2O amount, not to a change in the O–H stretching bond strength. Consequently, the Al doping effect to CeO2 was identified as the increase of H2O amount over the catalyst surface, which contributes to the promotion of surface proton hopping. That would induce higher catalytic activity with the EF application.
4 Conclusions
Catalytic methane steam reforming was investigated with and without application of an electric field (EF) using Pd/Ce1−xMxO2 (x = 0 or 0.1, M = Ca, Ba, La, Y or Al). Results show that activity with EF was different among Pd/Ce1−xMxO2 (Pd/M-CeO2) catalysts, although it was almost identical to that obtained without EF. It is particularly interesting that Pd/Al-CeO2 showed higher activity than Pd/CeO2 with EF. That result is attributable to enhancement of surface proton conduction over the Al-CeO2 support surface because Pd loading state on CeO2 and Al-CeO2 was confirmed to be almost identical. In fact, electronic/ionic conduction measurements confirmed a larger contribution of surface proton hopping for Al-CeO2. In this case, the proton conductivity on the surface depends on the adsorbed H2O amount because the absorbed H2O amount on Pd/Al-CeO2 was greater than that on Pd/CeO2. Results of this study indicate that surface proton hopping strongly dominate catalytic activity with EF, and that they can be controlled by characteristics of the catalyst support. This finding reveals that the importance of surface proton conductivity on the catalytic activity in the electric field, and leads to better catalyst design.
Conflicts of interest
There are no conflicts to declare.
Acknowledgements
This research was supported as a JST CREST JPMJCR1423 and COLD project.
Notes and references
- I. Dincer and C. Acar, Int. J. Hydrogen Energy, 2015, 40, 11094–11111 CrossRef CAS.
- J. D. Holladay, J. Hu, D. L. King and Y. Wang, Catal. Today, 2009, 139, 244–260 CrossRef CAS.
- J. R. Rostrup-Nielsen, J. Catal., 1973, 31, 173–199 CrossRef CAS.
- J. R. Rostrup-Nielsen, J. Catal., 1984, 85, 31–43 CrossRef CAS.
- J. R. Rostrup-Nielsen, Phys. Chem. Chem. Phys., 2001, 3, 283–288 RSC.
- J. Rostrup-Nielsen, Catal. Today, 2006, 111, 4–11 CrossRef CAS.
- J. R. H. Ross, M. C. F. Steel and A. Zeini-Isfahani, J. Catal., 1978, 52, 280–290 CrossRef CAS.
- C. A. Bernardo, I. Alstrup and J. R. Rostrup-Nielsen, J. Catal., 1985, 96, 517–534 CrossRef CAS.
- Y. Matsumura and T. Nakamori, Appl. Catal., A, 2004, 258, 107–114 CrossRef CAS.
- M. A. Nieva, M. M. Villaverde, A. Monzón, T. F. Garetto and A. J. Marchi, Chem. Eng. J., 2014, 235, 158–166 CrossRef CAS.
- L. Q. Nguyen, L. C. Abellaa, S. M. Gallardoa and H. Hinode, React. Kinet. Catal. Lett., 2008, 93, 227–232 CrossRef CAS.
- Y. Sekine, M. Haraguchi, M. Tomioka, M. Matsukata and E. Kikuchi, J. Phys. Chem. A, 2010, 114(11), 3824–3833 CrossRef CAS PubMed.
- Y. Sekine, M. Haraguchi, M. Matsukata and E. Kikuchi, Catal. Today, 2011, 171(1), 116–125 CrossRef CAS.
- K. Oshima, T. Shinagawa, M. Haraguchi and Y. Sekine, Int. J. Hydrogen Energy, 2013, 38(7), 3003–3011 CrossRef CAS.
- R. Manabe, S. Okada, R. Inagaki, K. Oshima, S. Ogo and Y. Sekine, Sci. Rep., 2016, 6, 38007 CrossRef CAS PubMed.
- S. Okada, R. Manabe, R. Inagaki, S. Ogo and Y. Sekine, Catal. Today, 2018, 307, 272–276 CrossRef CAS.
- M. Torimoto, S. Ogo, D. Harjowinoto, T. Higo, J. G. Seo, S. Furukawa and Y. Sekine, Chem. Commun., 2019, 55, 6693–6695 RSC.
- M. Torimoto, K. Murakami and Y. Sekine, Bull. Chem. Soc. Jpn., 2019, 92, 1785–1792 CrossRef CAS.
- K. Oshima, T. Shinagawa and Y. Sekine, J. Jpn. Pet. Inst., 2013, 56, 11–21 CrossRef CAS.
- R. Manabe, S. Stub, T. Norby and Y. Sekine, Solid State Commun., 2018, 270, 45–49 CrossRef CAS.
- B. Wang, D. Weng, X. Wu and R. Ran, Appl. Surf. Sci., 2011, 257, 3878–3883 CrossRef CAS.
- X. Zhao, Q. Lin and W. Xiao, Appl. Catal., A, 2005, 284, 253–257 CrossRef CAS.
- J. A. Wang, J. M. Dominguez, A. Montoya, S. Castillo, J. Navarrete, M. Moran-Pineda, J. Reyes-Gasga and X. Bokhimi, Chem. Mater., 2002, 14, 4676–4683 CrossRef CAS.
- J. R. Gallagher, D. J. Childers, H. Zhao, R. E. Winans, R. J. Meyer and J. T. Miller, Phys. Chem. Chem. Phys., 2015, 17, 28144–28153 RSC.
- S. Ø. Stub, E. Vøllestad and T. Norby, J. Phys. Chem. C, 2017, 121, 12817–12825 CrossRef CAS.
- S. Ø. Stub, K. Thorshaug, P. M. Rørvik, T. Norby and E. Vøllestad, Phys. Chem. Chem. Phys., 2018, 20, 15653–15660 RSC.
- P. A. Agron, E. L. Fuller and H. F. Holmes, J. Colloid Interface Sci., 1975, 52, 553–561 CrossRef CAS.
- K. Murakami, S. Ogo, A. Ishikawa, Y. Takeno, T. Higo, H. Tsuneki, H. Nakai and Y. Sekine, J. Chem. Phys., 2020, 152, 014707 CrossRef PubMed.
- S. Miyoshi, Y. Akao, N. Kuwata, J. Kawamura, Y. Oyama, T. Yagi and S. Yamaguchi, Solid State Ionics, 2012, 207, 21–28 CrossRef CAS.
- S. Ø. Stub, E. Vøllestad and T. Norby, J. Mater. Chem. A, 2018, 6, 8265–8270 RSC.
- B. Scherrer, M. V. F. Schlupp, D. Stender, J. Martynczuk, J. G. Grolig, H. Ma, P. Kocher, T. Lippert, M. Prestat and L. J. Gauckler, Adv. Funct. Mater., 2013, 23, 1957–1964 CrossRef CAS.
- I. G. Tredici, F. Maglia, C. Ferrara, P. Mustarelli and U. Anselmi-Tamburini, Adv. Funct. Mater., 2014, 24, 5137–5146 CrossRef CAS.
- S. Miyoshi, Y. Akao, N. Kuwata, J. Kawamura, Y. Oyama, T. Yagi and S. Yamaguchi, Chem. Mater., 2014, 26, 5194–5200 CrossRef CAS.
- C. Tandé, D. Pérez-Coll and G. C. Mather, J. Mater. Chem., 2012, 22, 11208–11213 RSC.
- F. Maglia, I. G. Spinolo, G. Tredici and U. Anselmi-Tamburini, J. Mater. Res., 2012, 27(15), 1975–1981 CrossRef CAS.
- G. Gregori, M. Shirpour and J. Maier, Adv. Funct. Mater., 2013, 23, 5861–5867 CrossRef CAS.
Footnote |
| † Electronic supplementary information (ESI) available. See DOI: 10.1039/d0ra01721c |
|
| This journal is © The Royal Society of Chemistry 2020 |
Click here to see how this site uses Cookies. View our privacy policy here. 
 Open Access Article
 This Open Access Article is licensed under a Creative Commons Attribution-Non Commercial 3.0 Unported Licence
 c,
Takuma Higo
c,
Takuma Higo