 Open Access Article
Exploring a new dinuclear Fe(III) complex for the fixation of atmospheric CO2 and optical recognition of nano-molar levels of Zn2+ ions†
Seikh Taniya,
Somnath Khanra,
Sabyasachi Ta,
Sudeshna Chatterjee,
Noor Salam* and
Debasis Das *
*
Department of Chemistry, The University of Burdwan, Burdwan, 713104, W.B., India. E-mail: ddas100in@yahoo.com; Fax: +91-342-2530452; Tel: +91-342-2533913 ext. 424
First published on 10th June 2020
Abstract
A dinuclear Fe(III) complex (F1) of an imine derivative (L1) derived from 3-ethoxy-2-hydroxy-benzaldehyde and hydrazine, structurally characterised via single crystal X-ray studies, is employed for the catalytic conversion of epoxides to cyclic carbonates utilizing carbon dioxide. In addition, F1 is employed for the selective optical recognition of nano-molar levels of Zn2+ (42.23 nM) via a metal displacement approach. The Job plot reveals interactions between F1 and Zn2+ at a 1![[thin space (1/6-em)]](https://www.rsc.org/images/entities/char_2009.gif) :
:![[thin space (1/6-em)]](https://www.rsc.org/images/entities/char_2009.gif) 3 molar ratio with an association constant of 7.71 × 10⁴ M−1. Studies on the catecholase-like activity of F1 reveal a kcat value of 4.42 × 10³ h−1.
3 molar ratio with an association constant of 7.71 × 10⁴ M−1. Studies on the catecholase-like activity of F1 reveal a kcat value of 4.42 × 10³ h−1.
Introduction
Despite the high abundance of iron at the earth's surface, its bio-availability at physiological pH under aerobic conditions is low.1,2 However, the role of iron in bio-systems is highly significant. For example, it is involved in energy transfer and bio-catalysis,3 and acts as a cofactor of several enzymes.4 Iron deficiency may cause liver dysfunction and anaemia, whereas its presence at higher concentrations may lead to hemochromatosis and Parkinson's disease.5 It is well known that iron deficiency in pregnant women can adversely affect both the mother and infant, including an increased risk of sepsis, maternal mortality, perinatal mortality, and low birth weight.6Similarly, Zn2+ plays a significant role in several biological processes,7 including in brain activity, gene transcription, immune functioning, etc.8,9 It is a cofactor of almost three hundred enzymes,10 including those involved in DNA repair and gene expression.11 On the other hand, abnormal zinc metabolism leads to several health issues, including delayed sexual maturation, prostate cancer, type 2 diabetes mellitus (T2DM), Wilson's disease, amyotrophic lateral sclerosis (ALS), and age-related macular degeneration (AMD).12–14 It is believed that Zn2+ homeostasis has some correspondence with the pathology of Alzheimer's disease15 and other brutal neurological problems, such as cerebral ischemia4 and epilepsy.5
Currently, the catalytic activities of metal complexes have acquired significant attention. Scientists are attempting to lower carbon dioxide levels16–18 in the atmosphere through its conversion to cyclic carbonates using metal complexes as catalysts. The cyclo-addition of CO2 and epoxides, forming cyclic carbonates, is a process with 100% atom economy19–21 that can lead to reduced CO2 levels. Moreover, cyclic carbonates have enormous numbers of industrial applications, for example as non-toxic/polar/high boiling solvents, electrolytes in lithium ion batteries, reactive intermediates, etc.22 However, the low reactivity of CO2 means that a catalyst23–25 is required for the cyclo-addition reactions to be feasible. Iron compounds,26 having low intrinsic toxicity, can catalyse the combination of CO2 and epoxides to form cyclic carbonates.27,28
These facts motivated us to study the catalytic activity of a new iron complex for the fixation of CO2 as cyclic carbonates using different epoxides.
Additionally, catechol oxidase of the oxidoreductase class of enzymes is very vital in biological systems.29–34 The use of transition metal complexes as bio-catalysts that can mimic catechol oxidase has become a pioneering field of research.
Therefore, the above discussion clearly demonstrates our motivation for investigating the optical recognition35–38 of the bio-relevant metal ion Zn(II) and the (bio)catalytic application of a new Fe(III) complex.
Herein, a new dinulcear Fe(III) complex (F1), structurally characterized via single crystal X-ray diffraction analysis, is used for the selective optical recognition of nanomolar levels of Zn2+. F1 functions as an excellent catalyst for the fixation of atmospheric CO2 as cyclic carbonates using epoxides. Moreover, the catecholase-like activity of F1 has been investigated. Finally, F1 is also established as a good extractor of Zn(II) from water to ethyl acetate.
Experimental
Synthesis
![[double bond, length as m-dash]](https://www.rsc.org/images/entities/char_e001.gif) O, stretch); 1500, ν(C
O, stretch); 1500, ν(C![[double bond, length as m-dash]](https://www.rsc.org/images/entities/char_e001.gif) N); 1068, ν(N–N) (Fig. S1c, ESI†).
N); 1068, ν(N–N) (Fig. S1c, ESI†).Dinuclear Fe(III) complex (F1)
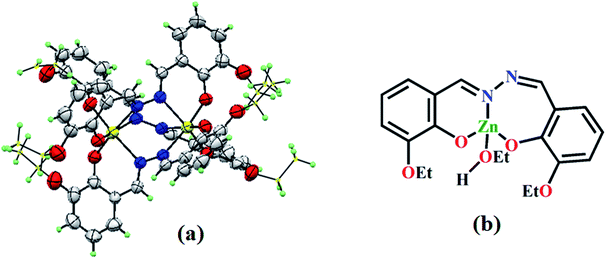
Methanol solution of FeCl3·6H2O (27 mg, 0.1 mmol, 5 mL) was added to DMF solution of L1 (50 mg, 1.5 mmol, 5 mL), and the mixture was stirred for 2 h. The mixture was kept for a week for the growth of black crystals, which were suitable for SC-XRD analysis (Fig. 1a). The yield was 64%. Its molecular formula is C54H54Fe2N2O12 (MW = 1090.73 g mol−1). Anal. found (%): C, 59.41; H, 5.13; and N, 7.10; calcd (%): C, 59.46; H, 4.99; and N, 7.70. ESI-MS (m/z): [M]+, 1113.08 (Fig. S2a, ESI†). FTIR (KBr, cm−1): 3011, ν(C–H, aromatic); 1639, ν(C![[double bond, length as m-dash]](https://www.rsc.org/images/entities/char_e001.gif) O); 1451, ν(C
O); 1451, ν(C![[double bond, length as m-dash]](https://www.rsc.org/images/entities/char_e001.gif) N); 1140, ν(N–N) (Fig. S2b, ESI†).
N); 1140, ν(N–N) (Fig. S2b, ESI†).
Zn(II) adduct (Z1)
Ethanol solution of F1 was stirred with Zn(OAc)2 and kept for 3 days to get the Z1 adduct in 59% yield (Fig. 1b). Its molecular formula is C20H23N2O5Zn (MW = 436.80 g mol−1). Anal. found (%): C, 54.72; H, 5.40; and N, 6.04; calcd (%): C, 54.99; H, 5.31; and N, 6.41. ESI-MS (m/z): [M]+, 435.50 (Fig. S3a, ESI†). FTIR (KBr, cm−1): 3169, ν(C–H, aromatic); 165, ν(C![[double bond, length as m-dash]](https://www.rsc.org/images/entities/char_e001.gif) O); 1481, ν(C
O); 1481, ν(C![[double bond, length as m-dash]](https://www.rsc.org/images/entities/char_e001.gif) N); 1227, ν(N–N) (Fig. S3b, ESI†) (Scheme 1).
N); 1227, ν(N–N) (Fig. S3b, ESI†) (Scheme 1).
Results and discussion
The single crystal X-ray structure of F1 (ref. 39)
It is desirable to confirm the structure of a new compound via single crystal X-ray diffraction (SC-XRD) analysis. Thus, in addition to the spectroscopic characterization of F1, its structure is authenticated from SC-XRD analysis (Fig. 1a). The crystallographic data and refinement parameters are presented in Table S1 (ESI).† Selected bond lengths and angles are listed in Table S2 (ESI).† F1 is triclinic, having the space group P![[1 with combining macron]](https://www.rsc.org/images/entities/char_0031_0304.gif) (CCDC 1864282), with a (Å): 14.8885(7); b (Å): 15.0825(6); c (Å): 15.1336(6); α (°): 104.859(3); β (°): 104.285(3); γ (°): 117.418(3); volume (Å3): 2639.0(2); and Z = 2, and adopts octahedral geometry around both Fe(III) centres. L1 exhibits cis geometry in the complex with selected bond lengths N1–C00P: 1.294(9) Å; and N2–C00U: 1.284(9) Å, indicating the presence of –CH
(CCDC 1864282), with a (Å): 14.8885(7); b (Å): 15.0825(6); c (Å): 15.1336(6); α (°): 104.859(3); β (°): 104.285(3); γ (°): 117.418(3); volume (Å3): 2639.0(2); and Z = 2, and adopts octahedral geometry around both Fe(III) centres. L1 exhibits cis geometry in the complex with selected bond lengths N1–C00P: 1.294(9) Å; and N2–C00U: 1.284(9) Å, indicating the presence of –CH![[double bond, length as m-dash]](https://www.rsc.org/images/entities/char_e001.gif) N double bonds. Bond angles of O004–Fe01–O007: 96.1(2)°; O004–Fe01–O003: 94.2(2)°; O003–Fe01–N3: 92.3(2)°; O004–Fe01–N00J: 83.9(2)°; O007–Fe01–N00J: 93.6(2)°; and N3–Fe01–N00J: 89.3(2)° clearly reveal the octahedral geometry around the Fe(III) centres. Symmetrical L1 contributes to each of the Fe(III) centres unbiasedly and co-ordinates via phenol O- and aldimine N- groups, with Fe01–O003 and Fe01–N2 bond lengths of 1.920(4) Å and 2.197(6) Å, respectively.
N double bonds. Bond angles of O004–Fe01–O007: 96.1(2)°; O004–Fe01–O003: 94.2(2)°; O003–Fe01–N3: 92.3(2)°; O004–Fe01–N00J: 83.9(2)°; O007–Fe01–N00J: 93.6(2)°; and N3–Fe01–N00J: 89.3(2)° clearly reveal the octahedral geometry around the Fe(III) centres. Symmetrical L1 contributes to each of the Fe(III) centres unbiasedly and co-ordinates via phenol O- and aldimine N- groups, with Fe01–O003 and Fe01–N2 bond lengths of 1.920(4) Å and 2.197(6) Å, respectively.
Spectroscopic studies
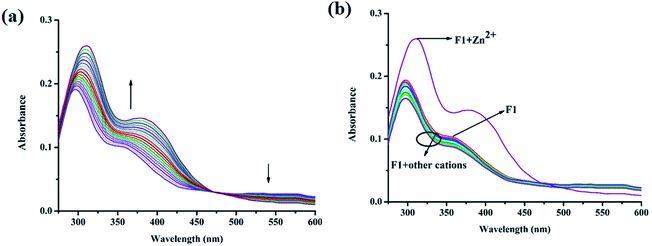
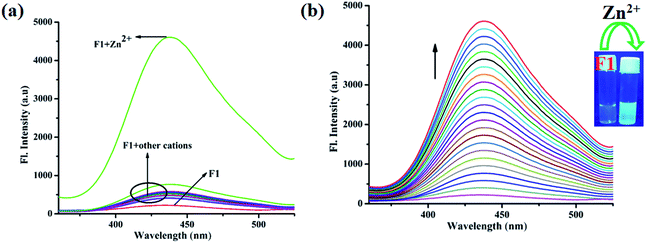
The absorption characteristics of F1 were studied using UV-vis spectroscopy. F1 exhibits two significant absorption peaks at 296 nm and 358 nm, which can be assigned to π–π* and n–π* electronic transitions (Fig. 2a). Upon the gradual addition of Zn2+, the absorbance increases along with the slight red-shifting of the peaks from 296 nm and 358 nm to 310 nm and 380 nm, respectively (Fig. 2a). The selectivity of F1 towards Zn2+ is shown in Fig. 2b.Also, the emission properties of F1 were monitored via fluorescence spectroscopy. In the presence of Zn2+ the emission spectrum of F1 is selectively perturbed, while other cations, viz. Al3+, K+, Ca2+, Mg2+, Hg2+, Pb2+, Cr3+, Fe3+, Mn2+, Co2+, Ni2+, Cu2+, Zn2+, Cd2+ and Ag+, have no effect (EtOH/H2O: 4/1 v/v; 10 mM HEPES buffer; pH: 7.4; λex: 332 nm; Fig. 3a). The weak emission of F1 at 437 nm gradually increases to a 19-fold maximum upon the gradual addition of Zn2+ (Fig. 3b). Fluorescence behavior is susceptible to pH, and the Zn2+-induced emission intensity of F1 becomes highest at pH 7 (Fig. S4, ESI†). Hence, fluorescence experiments have been performed at physiological pH: 7.4. Competitive experiments indicate that there is no interference from common cations (Fig. S5, ESI†). Moreover, a sigmoidal plot of the emission intensity vs. [Zn2+] has a linear region (Fig. S6, ESI†). The Zn2+ detection limit of F1 is 42.23 nM (Fig. S7, ESI†). The binding constant calculated via the Benesi–Hildebrand equation is 7.71 × 10⁴ M−1 (Fig. S8, ESI†). The Job plot indicates a 1![[thin space (1/6-em)]](https://www.rsc.org/images/entities/char_2009.gif) :
:![[thin space (1/6-em)]](https://www.rsc.org/images/entities/char_2009.gif) 3 (molar ratio) interaction between F1 and Zn2+ (Fig. S9, ESI†).
3 (molar ratio) interaction between F1 and Zn2+ (Fig. S9, ESI†).
Sensing mechanism
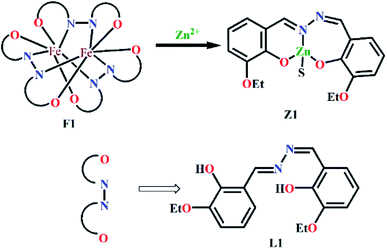
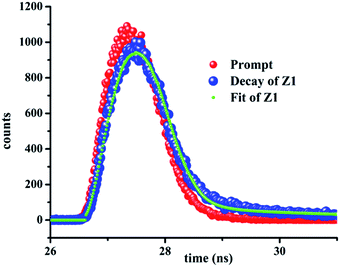
To obtain a plausible Zn(II) recognition mechanism in the presence of F1, a proper interpretation and understanding of the spectroscopic properties of F1 in the presence and absence of Zn(II) is very crucial. Thus, through interpreting the mass spectra, FTIR spectra and Job plot experiments, we can propose a “metal ion displacement protocol” as a plausible sensing mechanism (Scheme 2). The ν(N–N) band at 1140 cm−1 for F1 is shifted to 1227 cm−1 in the case of Z1. The absence of the ν(O–H) band in the case of Z1 also indicates the complexation of L1 with Zn2+.The selective recognition of an analyte by the probe using fluorescence spectroscopy is reflected by the fluorescence lifetime of the probe in the presence and absence of the analyte. Thus, Fig. 4 and Table 1 definitely suggest a significant interaction between F1 and Zn2+, leading to fluorescence enhancement. Non-fluorescent F1 shows an average lifetime of 2.64 ns in the presence of Zn2+.
| Sample | B1 | B2 | t1 (ns) | t2 (ns) | χ2 |
|---|---|---|---|---|---|
| Z1 | 78.82 | 22.18 | 0.23 | 3.25 | 0.96 |
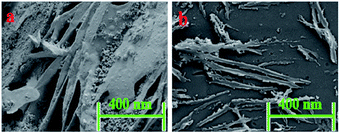
It is very much expected that the two different systems possibly possess different morphologies, in terms of particle size, pattern, texture, etc. FESEM images indicate significant differences in morphological appearance between F1 and Z1 (Fig. 5). For F1, congested geometry is seen due to the large di-nuclear Fe(III) complex, whereas changes detected in Z1, along with a reduction in particle size, reveal the formation of a mono-nuclear complex.
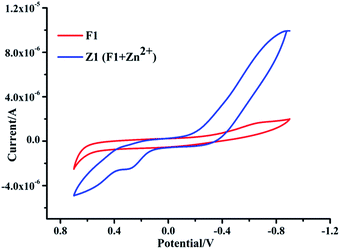
Furthermore, the electrochemical behaviours of the two different metal complexes seem to be different in terms of reversibility, redox potential, and E1/2. Fig. 6 indicates that the electrochemical properties of Z1 are quite different from those of F1. The electrochemical behaviours of the F1 and [F1–Zn2+] systems were monitored in anhydrous acetonitrile (ACN) media using tetra-butyl ammonium bromide (TBAB) as the supporting electrolyte at a scan rate of 100 mV s−1, with [F1] = 1 × 10⁻⁴ M, [F1–Zn2+] = 1 × 10⁻⁴ M, and [TBAB] = 0.1 M at room temperature. The redox process associated with F1 is quasi-reversible, having an E1/2 value of +0.52 V, while the value is +0.31 V in the presence of Zn2+. The cyclic voltammogram of F1 significantly differs in the presence of Zn2+.
Kinetics of Fe(III) displacement from F1 by Zn2+
The proposed mechanism of Fe(III) replacement from F1 by Zn(II) is kinetically followed via the stopped-flow technique, where the change in absorbance of F1 at 380 nm is monitored as a function of the amount of added Zn2+ ions. The Zn2+-assisted absorbance enhancement is attributed to the displacement of Fe3+ by Zn2+ within ∼1.2 s. The rate constant of the pseudo first-order displacement reaction with respect to Zn2+ is 2.7315 × 10⁸ s−1 (Fig. S10, ESI†).Extraction of Zn2+ using F1
F1 is also employed for the enrichment of Zn2+ via solvent extraction from water to ethyl acetate. Three organic solvents, viz. EtOAc, CHCl3 and CCl4, are tested for the extraction of Zn2+ from aqueous solution. F1 was equilibrated and partitioned at various concentrations (0.1 × 10⁻³, 0.5 × 10⁻³, 1.0 × 10⁻³, 1.5 × 10⁻³, and 2.0 × 10⁻³ M) with known concentrations of Zn2+ for 1 h at room temperature. After the removal of the organic layer, the concentration of Zn2+ in the aqueous phase is measured using the presented method. The highest extraction efficiency is observed for EtOAc (95.47%), followed by chloroform (90.11%), and carbon tetrachloride (87.35%). The effects of various solvents on the extraction efficiency are presented in Fig. S11 (ESI).†F1 catalyzed cyclic carbonate synthesis
The importance of the fixation of atmospheric CO2 in the form of cyclic carbonates has already been discussed above. Hence, attempts have been made to study the catalytic activity of the new iron complex (F1) for the fixation of CO2 as cyclic carbonates using different epoxides (Scheme 3).The reaction of epichlorohydrin with CO2 at 70 °C and under atmospheric pressure under solvent-free conditions, leading to a cyclic carbonate, is studied as a model reaction (Scheme 4). The reaction conditions have been optimized with respect to diverse parameters, viz., temperature, reaction time and TBAB concentration, for maximum yield (Table S3, ESI†).
Among different trials, 5 mol% loading of co-catalyst (TBAB) led to the maximum yield of cyclic carbonate (Table S3, entry 9, ESI†). Above 5 mol% TBAB, no further improvement in product yield is observed. Traces of the desired product formed without TBAB under identical reaction conditions. Interestingly, without the F1 catalyst, TBAB alone fails to improve the yield of the product. A synergistic effect between F1 and TBAB accelerated the product yield. It is noted that the reaction temperature plays a crucial role in determining the yield of the product (Table S3, ESI†). The highest yield is observed at 70 °C. Thus, the optimum parameters that lead to the highest yield of product are 5 mol% TBAB (co-catalyst), 70 °C (temp.), 12 h (reaction time), 15 mg of F1 (catalyst load), and 1 atm. CO2 (pressure) (Table S3, ESI†).
To verify the efficiency and performance of the F1 catalyst, the fixation of CO2 is tested with some substituted epoxides, like 1,2-epoxy-3-phenoxy propane epichlorohydrin and styrene oxide (Table 2). Of these, epichlorohydrin provided a better yield, probably due to the electron withdrawing effects of the substituent.
| Entry | Epoxide | Product | Yieldb (%) | Conversionc (%) | TONd | TOFe |
|---|---|---|---|---|---|---|
| a Reaction conditions: epoxide (5 mmol), F1 catalyst (15 mg), TBAB (5 mol%), 70 °C, CO2 (1 atm.), 12 h.b GC yield of cyclic carbonate.c Conversion is determined via GC.d Turnover number (TON) = (% conversion × mmol of substrate used)/(mmol of catalyst used).e Turnover frequency (TOF) = TON/time of reaction (h). | ||||||
| 1 |  |
 |
87 | 90 | 32![[thin space (1/6-em)]](https://www.rsc.org/images/entities/char_2009.gif) 142 142 |
2678 |
| 2 |  |
 |
97 | 99 | 35![[thin space (1/6-em)]](https://www.rsc.org/images/entities/char_2009.gif) 357 357 |
2946 |
| 3 |  |
 |
91 | 94 | 33![[thin space (1/6-em)]](https://www.rsc.org/images/entities/char_2009.gif) 571 571 |
2797 |
The catalytic efficiency of F1, the methodology, and the reaction conditions are highly competitive when compared with other reported iron catalysts (Table 3).
| Reaction | Catalyst | Reaction conditions | Yield (%) | Ref. |
|---|---|---|---|---|
| Cyclic carbonate synthesis | Iron(III)aminobis(phenolate) complexes | Epichlorohydrin (5.0 × 10⁻² mol), PPNCl (5.00 × 10⁻⁵ mol), CO2 (20 bar), 4 h, 100 °C | 99 | 40 |
| Pyridine-bridged bispincer-type Fe(II) complex | Epichlorohydrin (10 mmol), TBAB (97.6 mg, 0.29 mmol), 25 °C, 0.5 MPa CO2, 24 h. | 91 | 41 | |
| Fe(III) thio ether–triphenolate complex | Epichlorohydrin (7.0 × 10⁻² mol), TBAB (7.0 × 10⁻⁵ mol), CO2 (2 MPa); 100 °C, 6 h. | 78 | 42 | |
| F1 | Epichlorohydrin (5 mmol), TBAB (5 mol%), 70 °C, CO2 (1 atm.), 12 h | 97 | Present study |
Plausible mechanism for epoxide formation
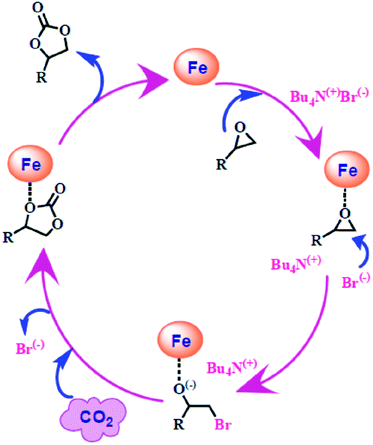
Based on experimental findings and the associated literature,40–44 a plausible mechanism for fixing CO2 using an epoxide, leading to an organic cyclic carbonate, is portrayed in Scheme 5. At first, the active site of F1 coordinates with the O-donor of the epoxide, followed by nucleophilic attack by Br− (from TBAB) at the C-centre attached to the epoxide oxygen; this opens the ring to form an α-halo-alkoxide. Then, the O-donor attached to the Fe centre interacts with the C-centre of CO2 to produce an alkyl cyclic carbonate along with the regeneration of the catalyst F1.Catecholase-like activity
The catecholase-like activity of F1 (1 × 10⁻⁴ M) is monitored via time-dependent absorption spectroscopy through its reaction with the model compound 3,5-DTBC (1 × 10⁻² M, 100 equiv.) in methanol under aerobic conditions at room temperature.As saturation kinetics are observed at a high substrate concentration, the Michaelis–Menten equation and a Lineweaver–Burk plot (Fig. S12a, ESI†) are used to elucidate the kinetic parameters. The initial first order rate constant, V (s−1), is calculated from the slope of the plot log[A∞/(A∞α − At)] vs. time. Kinetic parameters like binding constant (KM), maximum velocity (Vmax), and rate constant (turnover number, kcat) are determined from the linear plot of 1/V vs. 1/[S] (Lineweaver–Burk plot) as per the Michaelis–Menten enzymatic kinetics approach. From the Lineweaver–Burk plot, 1/V = {KM/Vmax} × {1/[S]} + 1/Vmax, and the values for Vmax, kM, and kcat are found to be 5.49 × 10⁻² M s−1, 1.23 × 10⁻⁴ M, and 4.42 × 10³ h−1. Scheme S1 (ESI†) shows the well-known catalytic catechol oxidation protocol, supported by the ESI-MS(+) spectrum of a mixture of F1 and 3,5-DTBC (1![[thin space (1/6-em)]](https://www.rsc.org/images/entities/char_2009.gif) :
:![[thin space (1/6-em)]](https://www.rsc.org/images/entities/char_2009.gif) 50 molar ratio) in aqueous methanol (Fig. S12b, ESI†). The two predominant peaks at m/z values of 237.19 (calcd: 238.16) and 1135.13 (calcd: 1135.29) are attributed to [3,5-DTBQ + H2O]+ and [F1 + 2H2O + Li]+, respectively.
50 molar ratio) in aqueous methanol (Fig. S12b, ESI†). The two predominant peaks at m/z values of 237.19 (calcd: 238.16) and 1135.13 (calcd: 1135.29) are attributed to [3,5-DTBQ + H2O]+ and [F1 + 2H2O + Li]+, respectively.
The electrochemical transformation of catechol to quinone has also been monitored in the presence of F1 (Fig. S12c, ESI†). The electrochemical behaviours of the F1 and [F1-catechol] systems have been investigated in anhydrous acetonitrile media in the presence of tetra-butyl ammonium bromide (TBAB) as a supporting electrolyte at a scan rate of 100 mV s−1, where [F1] = 1 × 10⁻⁴ M, [F1-catechol] = 1 × 10⁻⁴ M, and [TBAB] = 0.1 M, at room temperature. Cyclic voltammograms (CV) of the F1 and [F1-catechol] systems appear different, with associated E1/2 values of +0.52 V and +0.47 V, respectively.
Conclusion
A new dinuclear Fe(III) complex (F1) of a symmetrical azine derivative, structurally characterized via single-crystal X-ray analysis, is employed as a catalyst for the fixation of atmospheric CO2 using epoxides, leading to organic cyclic carbonates with 97% yield. In addition, F1 selectively recognizes Zn2+ at concentrations as low as 42.23 nM through TURN-ON fluorescence via a metal displacement protocol. Moreover, F1 efficiently (95.47%) extracts Zn2+ from aqueous media to ethyl acetate. The catecholase-like activity of F1 is demonstrated, providing a kcat value of 4.42 × 10³ h−1.Conflicts of interest
There are no conflicts to declare.Acknowledgements
S. Khanra and S. Chatterjee acknowledge CSIR (New Delhi) and DST-INSPIRE (New Delhi) for fellowships. N. Salam (Award letter no. F.4-2/2006(BSR)/CH/17-18/0176) is grateful to UGC, New Delhi for D. S. K. postdoctoral fellowship. We acknowledge USIC, BU for SC-XRD and FESEM facilities. We sincerely thank Prof. Nikhil Guchhait, University of Calcutta, Kolkata, for extending the facilities for TCSPC experiments.References
- O. Ardon, H. Weizman, J. Libman, A. Shanzer, Y. Chen and Y. Hadar, Microbiology, 1997, 143, 3625–3631 CrossRef CAS.
- A. Correa, O. Garca MancheÇoa and C. Bolm, Chem. Soc. Rev., 2008, 37, 1108–1117 RSC.
- T. L. Foley and A. Simeonov, Expet Opin. Drug Discov., 2012, 7, 831–847 CrossRef CAS PubMed.
- L. Salmon, P. Thuery, E. Riviere and M. Ephritikhine, Inorg. Chem., 2006, 45, 83–93 CrossRef CAS PubMed.
- M. Graham, M. N. J. Paley, R. A. Grünewald and N. Hoggard, Brain, 2000, 123, 2423–2431 CrossRef PubMed.
- CDC Breastfeeding Report Card, United states: Outcome Indicators (Publication, from Centers for Disease Control and Prevention, National Immunization Survey, last accessed on, 11 May 2010 Search PubMed.
- J. M. Berg and Y. Shi, Science, 1996, 271, 1081–1085 CrossRef CAS PubMed.
- N. P. Pavletich and C. O. Pabo, Science, 1991, 252, 809–817 CrossRef CAS PubMed.
- C. O. Pabo and R. T. Sauer, Annu. Rev. Biochem., 1992, 61, 1053–1095 CrossRef CAS PubMed.
- K. A. McCall, C. C. Huang and C. A. Fierke, J. Nutr., 2000, 130, 1437S–1446S CrossRef CAS PubMed.
- L. Vallee and K. H. Falchuk, Phys. Rev., 1993, 73, 79–118 CrossRef.
- J. Y. Liang, Y. Y. Liu, J. Zou, R. B. Franklin, L. C. Costello and P. Feng, Prostate, 1999, 40, 200–207 CrossRef CAS PubMed.
- K. Jobe, C. H. Brennan, M. Motevalli, S. M. Goldup and M. Watkinson, Chem. Commun., 2011, 37, 6036–6038 RSC.
- S. Khanra, S. Ta, M. Ghosh, S. Chatterjee and D. Das, RSC Adv., 2019, 9, 21302–213010 RSC.
- D. A. Pearce, N. Jotterand, I. S. Carrico and B. Imperiali, J. Am. Chem. Soc., 2001, 123, 5160–5161 CrossRef CAS PubMed.
- D. J. Darensbourg, Inorg. Chem., 2010, 49, 10765–10780 CrossRef CAS PubMed.
- M. Cokoja, C. Bruckmeier, B. Rieger, W. A. Herrmann and F. E. Kühn, Angew. Chem., Int. Ed., 2011, 50, 8510–8537 CrossRef CAS PubMed.
- M. Aresta, A. Dibenedetto and A. Angelini, Chem. Rev., 2013, 114, 1709–1742 CrossRef PubMed.
- R. Li, X. Tong, X. Li and C. Hu, Pure Appl. Chem., 2012, 84, 621–636 CAS.
- N. Kielland, C. J. Whiteoak and A. W. Kleij, Adv. Synth. Catal., 2013, 355, 2115–2138 CrossRef CAS.
- M. North, R. Pasquale and C. Young, Green Chem., 2010, 12, 1514–1539 RSC.
- J. H. Clements, Ind. Eng. Chem. Res., 2003, 42, 663–674 CrossRef CAS.
- K. Motokura, S. Itagaki, Y. Iwasawa, A. Miyaji and T. Baba, Green Chem., 2009, 11, 1876–1880 RSC.
- E. A. Prasetyanto, M. B. Ansari, B.-H. Min and S.-E. Park, Catal. Today, 2010, 158, 252–257 CrossRef CAS.
- H. Zhou, Y.-M. Wang, W.-Z. Zhang, J.-P. Qu and X. B. Lu, Green Chem., 2011, 13, 644–650 RSC.
- I. Bauer and H. J. Knölker, Chem. Rev., 2015, 115, 3170–3387 CrossRef CAS PubMed.
- A. Buchard, M. R. Kember, K. G. Sandeman and C. K. Williams, Chem. Commun., 2011, 47, 212–214 RSC.
- C. J. Whiteoak, E. Martin, M. M. Belmonte, J. BenetBuchholz and A. W. Kleij, Adv. Synth. Catal., 2012, 354, 469–476 CrossRef CAS.
- K. S. Banu, T. Chattopadhyay, A. Banerjee, S. Bhattacharya, E. Suresh, M. Nethaji, E. Zangrando and D. Das, Inorg. Chem., 2008, 47, 7083–7093 CrossRef CAS PubMed.
- S. Majumder, S. Sarkar, S. Sasmal, E. Carolina Sãnudo and S. S. Mohanta, Inorg. Chem., 2011, 50, 7540–7554 CrossRef CAS PubMed.
- A. Biswas, L. K. Das, M. G. B. Drew, C. Diaz and A. Ghosh, Inorg. Chem., 2012, 51, 10111–10121 CrossRef CAS PubMed.
- A. Neves, L. M. Rossi, A. J. Bortoluzzi, B. Szpoganicz, C. Wiezbicki and E. Schwingel, Inorg. Chem., 2002, 41, 1788–1794 CrossRef CAS PubMed.
- P. Comba, B. Martin, A. Muruganantham and J. Straub, Inorg. Chem., 2012, 51, 9214–9225 CrossRef CAS PubMed.
- M. Mitra, A. K. Maji, B. K. Ghosh, G. Kaur, A. R. Choudhury, C.-H. Lin, J. Ribas and R. Ghosh, Polyhedron, 2013, 61, 15–19 CrossRef CAS.
- J. Wang, W. Lin and W. Li, Chem.–Eur. J., 2012, 18, 13629–13632 CrossRef CAS PubMed.
- L. H. Feng, C. L. Zhu, H. X. Yuan, L. B. Liu, F. T. Lv and S. Wang, Chem. Soc. Rev., 2013, 42, 6620–6633 RSC.
- G. B. Li, H. C. Fang, Y. P. Cai, Z.-Y. Zhou, P. K. Thallapally and J. Tian, Inorg. Chem., 2010, 49, 7241 CrossRef CAS PubMed.
- M. Ghosh, S. Ta, M. Banerjee and D. Das, ACS Omega, 2018, 3, 16089–16098 CrossRef CAS PubMed.
- O. V. Dolomanov, L. J. Bourhis, R. J. Gildea, J. A. K. Howard and H. Puschmann, J. Appl. Crystallogr., 2009, 42, 339–341 CrossRef CAS.
- Y. Ge, G. Cheng, N. Xu, W. Wang and H. Ke, Catal. Sci. Technol., 2019, 9, 4255–4261 RSC.
- H. Ullah, B. Mousavi, H. A. Younus, Z. A. K. Khattak, S. Suleman, M. T. Jan, B. Yu, S. Chaemchuen and F. Verpoort, J. Catal., 2019, 377, 190–198 CrossRef CAS.
- Z. A. K. Khattak, H. A. Younus, N. Ahmad, H. Ullah, S. Suleman, M. S. Hossain, M. Elkadi and F. Verpoort, Chem. Commun., 2019, 55, 8274–8277 RSC.
- F. Chen, N. Liu and B. Dai, ACS Sustainable Chem. Eng., 2017, 5, 9065–9075 CrossRef CAS.
- A. Buonerba, A. De Nisi, A. Grassi, S. Milione, C. Capacchione, S. Vagin and B. Rieger, Catal. Sci. Technol., 2015, 5, 118–123 RSC.
Footnote |
| † Electronic supplementary information (ESI) available: Contains information regarding materials; physical measurements; the general UV-vis and fluorescence measurement methods; Job experiments; binding constant, detection limit, and quantum yield measurements; copies of different spectra scans; CV data; crystal parameters; bond lengths and angles; catalytic performance data; etc. The CCDC no. of F1 is 1864282. For ESI and crystallographic data in CIF or other electronic format see DOI: 10.1039/d0ra01698e |
| This journal is © The Royal Society of Chemistry 2020 |

