 Open Access Article
Poly(fluorenone-co-thiophene)-based nanoparticles for two-photon fluorescence imaging in living cells and tissues†
Nan Du ab,
Ying Tan
 ab,
Chen Zhangab and
Chunyan Tan
 *ab
*ab
aDepartment of Chemistry, Tsinghua University, Beijing, 100084, P. R. China
bState Key Laboratory of Chemical Oncogenomic, Tsinghua Shenzhen International Graduate School, Tsinghua University, Shenzhen, 518055, P. R. China. E-mail: tancy@sz.tsinghua.edu.cn; Fax: +86-755-26032094; Tel: +86-755-26036533
First published on 26th March 2020
Abstract
Conjugate polymer nanoparticles (CPNs) were constructed based on poly(fluorenone-co-thiophenes) (PFOTs) synthesized through a direct arylation polymerization (DArP) approach. Results demonstrate that the developed novel CPNs have potential applications in two-photon fluorescence imaging of both cells and tissues.
Fluorescence imaging has been widely applied in biological studies on subcellular microenvironments and tissues to develop disease diagnostic methods and clinical treatment.1–3 The emerging two-photon fluorescence imaging approach has demonstrated some advantages over traditional single-photon fluorescence imaging, including deeper penetration depth, less photo-damage, reduced self-absorption and background signal due to autofluorescence, etc.4–6 Several two-photon absorption (TPA) materials have been reported thus far, such as organic molecules, quantum dots, metal complexes, carbon quantum dots, graphene quantum dots, et al.,7–11 both small-molecule fluorescent probes and nano-sized imaging agents fabricated by CPs are attractive and versatile materials for studying biological systems, and their size, composition, surface ligands, optical properties are important for their application.12–14 So, developing new TPA materials remains challenging but is needed to improve fluorescence quantum yield, biocompatibility, photostability, and ease of preparation compared to existing TPA probes.
Conjugated polymers (CPs) with extended π-conjugation structure have been studied as promising fluorescent probes over the past two decades. Due to their effective absorption and fluorescence, high photostability, signal amplification effect, and excellent biocompatibility, they have been widely implemented in biosensing, drug delivery, and imaging.15–19 For instance, CPs-based nanoparticles with two-photon excitation character were applied as high contrast cell imaging probes by Xu et al.20,21 It was reported that synthesized chromophores with donor–acceptor (D–A) structures, which tend to exhibit relatively large two-photon absorption cross-section, and thus, enhanced TPA properties by the charge transfer effect.22,23 Wu et al. fabricated CPNs with polyfluorene derivative that were characterized by cross sections values up to 2.0 × 10⁵ GM.24 Recently, Schanze et al. reported anionic conjugated polyelectrolytes (CPEs), such as PPE-SO3−, with moderate two-photon absorption cross-sections in the near-infrared (NIR) region for two-photon fluorescence cell imaging.25 Their work disclosed the potentials of CPEs and CPNs as TPA fluorescent materials in tissue imaging.
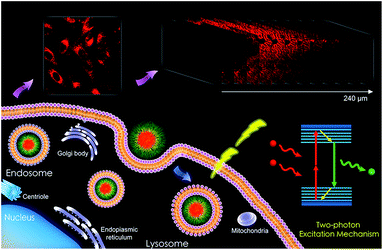
Herein, we developed novel PFOT-based nanoparticles to exploit their single- and two-photon fluorescence properties for imaging applications in living cells and tissues (Scheme 1).
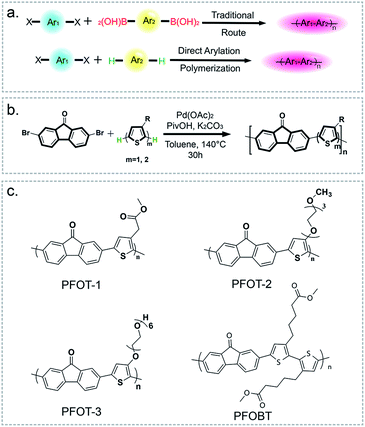
Direct arylation polymerization (DArP) has emerged as a simple and atom-economic method for polymer synthesis compared to traditional metal-catalyzed coupling polymerization, as shown in Fig. 1a.26 In this work, 4 novel D–A type CPs composed of fluorenone and thiophene moieties were synthesized via the DArP method, as displayed in Fig. 1b and c. All polymers are soluble in typical organic solvents, such as chloroform, THF, methanol, acetone, and DMF. PFOT-2 and PFOT-3 are slightly soluble in water due to the increased length of their hydrophilic side chains. Under optimized experimental conditions, we acquired PFOT-1, PFOT-2, PFOT-3, and PFOBT with reasonable Mn of 1.99, 2.57, 5.14, and 4.76 kg mol−1 respectively.
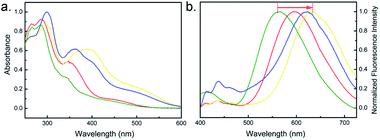
Photophysical properties of CPs are affected by their main chain conjugated structure, molecular weight, side chain structure, solvent, and etc. For the fluorenone-based copolymers, it has been reported that the intermolecular CO⋯HC (aromatic) hydrogen bonds (H-bonds) would exert influence on absorption maximum position.27,28 In addition, side chains of the CPs could also have impact on the conformation of the backbone and the aggregation state of the polymers. Photophysical properties of the obtained four CPs (PFOT-1, PFOT-2, PFOT-3, and PFOBT) were studied. UV-visible absorption and fluorescence emission spectra of the four CPs in chloroform are shown in Fig. 2a. The absorption of all the four polymers in chloroform features a strong band in the UV range and a broader and weaker band in the visible range. PFOT-1 and PFOBT show UV absorption with two maxima at 287 and 265 nm, that are assigned, respectively, to cisoid and transoid conformations of the conjugated backbone, while PFOT-2 and PFOT-3 only demonstrate one peak at about 305 nm, suggesting that the cisoid conformation dominates which enhance the polymer aggregation. Strong and wide fluorescence emission bands of the 4 polymers can be observed with the full width at half maxima (FWHM) at about 200 nm (Fig. 2b). Polymers with single thiophene in their repeat units, such as PFOT-1, PFOT-2, and PFOT-3, demonstrated red-shifted emission maximum wavelengths (595 to 630 nm) compared to that of the polymer PFOBT (555 nm), which contains bithiophene in its repeat units. We believe that PFOBT is in a less aggregated state than all other three PFOT polymers, leading to a blue-shifted absorption and emission band. It has been reported that D–A type CPs usually demonstrate lower bandgaps and large Stokes shifts due to the intramolecular charge transfer (ICT).29 As the spectra shown, PFOT-1, PFOT-2, PFOT-3, and PFOBT CPs exhibit large Stokes shifts of 220, 260, 250, and 170 nm respectively, which is in favour of diminishing the reabsorption effect. Quantum yields (QYs) of PFOT-1, PFOT-2, PFOT-3, and PFOBT CPs in CHCl3 were determined to be 0.081, 0.193, 0.376, and 0.432, respectively, via the reference method with coumarin 6 in ethanol as a reference. Then, PFOT-2, PFOT-3, and PFOBT were selected for further imaging studies.
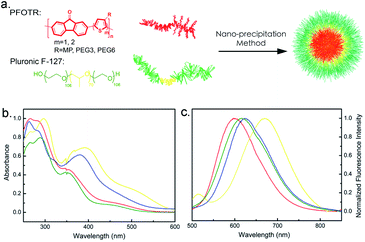
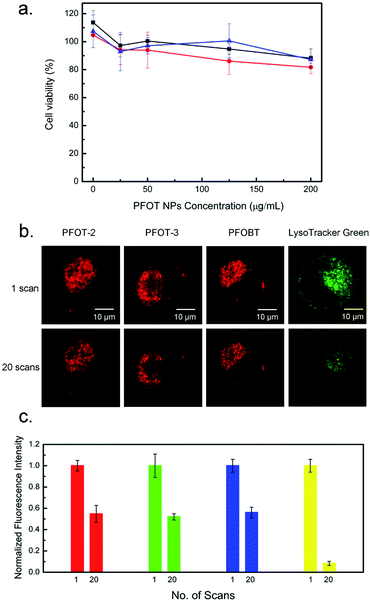
For bio-imaging, efficient internalization of probes by cells is an essential step. In order to improve the biocompatibility of the CPs, CPNs were fabricated via the nanoprecipitation method using polymers and Pluronic-F127 as a surfactant and encapsulation matrix, as shown in Fig. 3a. The diameters of CPNs were characterized by dynamic light scattering (DLS) for three times with the average diameters range from 45.1 to 142.3 nm (Table 1). Fig. S3† revealed the core–shell morphology of the CPNs, probably formed by the hydrophobic inner cores and hydrophilic outer shells. This core–shell morphology of the CPNs helps with improving their stability in aqueous environment, and demonstrates their potential application as fluorescent probes and drug nano-vehicles. In Fig. 3b, compared to the corresponding CPs in solutions, fluorescence emission spectra of the four CPNs revealed red-shifts. This may be ascribed to the internal stress of the particles that increases with the formation of CPNs, which leads to variation in the energy band structures, incremental overlap of the electron wave function, narrowing of energy band-gap, and red-shift of the emission peak length.30 Also, it has been reported that aggregated particles fabricated via nanoprecipitation method usually exhibit red-shifted emission compared to their non-aggregated forms, which can be ascribed to the bending, kinking, and interchain interactions of polymer backbones in the aggregation.31,32 Cellular cytotoxicity assay of the PFOT CPNs towards HeLa cells displayed no apparent cytotoxicity with a concentration up to 200 μg mL−1 as shown in Fig. 4a. The low cytotoxicity and efficient endocytosis (Fig. S4†) demonstrated a good biocompatibility of the synthesized CPNs. Also, the photostability assay of PFOT-2 NPs, PFOT-3 NPs, and PFOBT NPs was carried out via a photobleaching experiment. As shown in Fig. 4b and c, fluorescence of PFOT-2 NPs, PFOT-3 NPs, PFOBT NPs, and LysoTracker Green remained at 55%, 54%, 54%, and 8% respectively, after 20 times scans, suggesting that the CPNs exhibited stronger photostability than the small molecular probe LysoTracker Green. Our results also show that the CPs and CPNs are stable at pH ranging from 5.0–7.4, which cover the biological pH ranges of tumor tissues, late endosomes and lysosomes, normal tissues and blood (Fig. S6†).
| Sample name | Da (nm) | PDIa | QYsb | Stokes shiftc |
|---|---|---|---|---|
| a The hydrodynamic diameter (Dh) and polydispersity index (PDI) of PFOT nanoparticles.b Quantum yields (QYs) were measured via the reference method with coumarin 6 in ethanol as a reference.c Stokes shift of PFOT series CPNs. | ||||
| PFOT-1 | 91.7 ± 1.5 | 0.12 | 0.012 | 120 |
| PFOT-2 | 82.6 ± 0.5 | 0.17 | 0.021 | 200 |
| PFOT-3 | 142.3 ± 1.9 | 0.44 | 0.029 | 150 |
| PFOBT | 45.1 ± 0.5 | 0.32 | 0.027 | 145 |
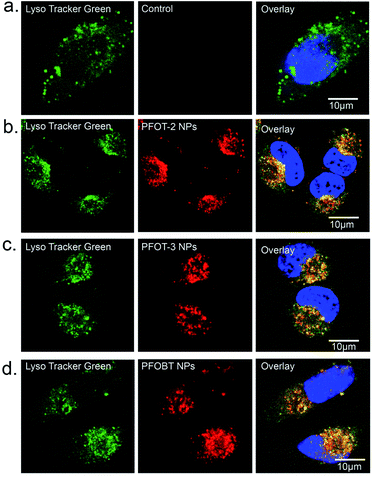
Then, HeLa cells were incubated with PFOT-2, PFOT-3, and PFOBT NPs (concentration of 5 μM each) for 4 h and observed with a one-photon confocal fluorescence microscope. As shown in Fig. S4,† almost all cells demonstrated CPNs internalization signals of red fluorescence. Furthermore, to explore the endocytosis process of these CPNs, organelle location was investigated via a lysosome co-localization probe, LysoTracker green. Fig. 5 displays the fluorescence imaging of HeLa cells co-stained with CPNs (red) and the LysoTracker probe (green). As shown in Fig. 5, red signal of PFOT-2, PFOT-3, and PFOBT NPs and green signal well overlapped with Pearson correlation coefficients (PCCs) of 0.94 (±0.03), 0.94 (±0.02), and 0.97 (±0.02), respectively. This means that most NPs localized in lysosomes, while others appear in early or late endosomes, suggesting that lysosomes are the primary organelle participating in the endocytosis process of these CPNs.33
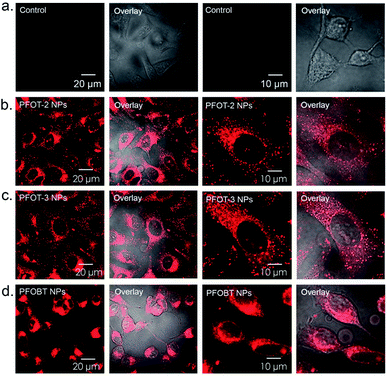
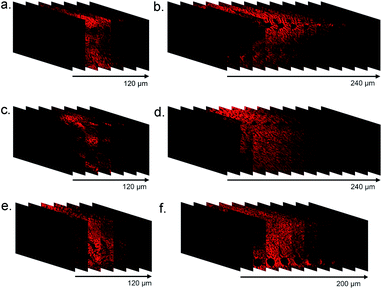
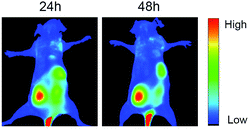
Many researchers have high interest in investigating D–A type CPs with TPA property for use in photoelectric devices and bio-probes.34,35 It has been acknowledged that molecules constructed by electron donating and accepting functional groups with extended π-conjugated systems are capable of displaying two-photon absorption cross-sections.36,37 In this work, the application of PFOT CPNs as two-photon imaging probes were explored by an Olympus FVMPE RS two-photon microscope with femtosecond laser excitation at 720 and 960 nm. The pictures taken by the two-photon microscope in Fig. 6 show that 5 μM of CPNs is sufficient to give clear cells fluorescent images of high quality with an emission wavelength range of 575–645 nm. It should also be noted that both excitation and emission wavelengths of CPNs are located in the 575–960 nm range, encompassing the deep red and near-infrared areas. Combining these properties, PFOT CPNs as NIR probes could provide both deep tissue penetration and low autofluorescence, which has great potential in medical fluorescent imaging applications. To further verify the advantages of deep-red emission and two-photon absorption of PFOT CPNs, fluorescence images of mice liver tissue slices were studied. The tissue slices were pre-treated with PFOT-2, PFOT- 3, and PFOBT NPs for 1 h, then one-photon and two-photon confocal imaging in Z-scan mode were performed to obtain fluorescence images as shown in Fig. 7. All the PFOT CPNs were effectively applied as tissue imaging probes with penetration depths of 120–240 μm. Compared with one-photon confocal Z-scan imaging, two-photon Z-scan imaging showed a deeper penetration depth up to 240 μm due to the longer absorption and emission wavelength in deep red and NIR areas. All results suggest that the CPNs based on PFOT polymers possess excellent tissue-penetrating, staining, and imaging capabilities. Also, to investigated the in vivo NIR fluorescence imaging ability of PFOBT NPs, we established the common BALB/c murine breast cancer (4T1) model. As shown in Fig. 8, the PFOBT CPNs were able to accumulate in tumor tissue efficiently after 48 h tail vein injection, due to the enhanced permeability and retention (EPR) effect.
Conclusions
In summary, we designed and synthesized a series of new CPs with poly(fluorenone-co-thiophene) backbones via DArP. The PFOT series CPs exhibit long emission wavelength ranges of 500–800 nm and two-photon absorption property, which allows for longer excitation wavelengths of 720 and 960 nm located in the deep red and NIR areas. CPNs based on PFOT polymers also demonstrated good biocompatibility, high photostability, excellent lysosome co-localization, and two-photon imaging properties, with a much deeper tissue penetration than one-photon confocal imaging. In this work, the novel PFOT CPNs provide new insight and perspectives for fabricating TPA NPs with novel backbones and demonstrate their application potentials in NIR in vitro and in vivo imaging.Conflicts of interest
There are no conflicts to declare.Acknowledgements
The authors would like to acknowledge the financial support from the National Natural Science Foundation of China (NSFC No. 21572115), and the Shenzhen Bay Laboratory Open Funding (SZBL2019062801009).Notes and references
- K. P. Carter, A. M. Young and A. E. Palmer, Chem. Rev., 2014, 114, 4564–4601 CrossRef CAS.
- H. Peng and D. T. Chiu, Chem. Soc. Rev., 2015, 44, 4699–4722 RSC.
- W. K David and H. Niko, Chem. Soc. Rev., 2015, 44, 4792–4834 RSC.
- Y. Shen, A. J. Shuhendler, D. Ye, J. J. Xu and H. Y. Chen, Chem. Soc. Rev., 2016, 45, 6725–6741 RSC.
- Y. Sheng and K. D. Belfield, Eur. J. Org. Chem., 2012, 17, 3199–3217 Search PubMed.
- F. Helmchen and W. Denk, Nat. Methods, 2005, 2, 932–940 CrossRef CAS PubMed.
- B. Swagata, E. B. Veale, C. M. Phelan, S. A. Murphy, G. M. Tocci, L. J. Gillespie, D. O. Frimannsson, J. M. Kelly and G. Thorfinnur, Chem. Soc. Rev., 2014, 44, 1601–1618 Search PubMed.
- H.-W. Liu, L. Chen, C. Xu, Z. Li, H. Zhang, X.-B. Zhang and W. Tan, Chem. Soc. Rev., 2018, 47, 7140–7180 RSC.
- D. Wu, A. C. Sedgwick, T. Gunnlaugsson, E. U. Akkaya, J. Yoon and T. D. James, Chem. Soc. Rev., 2017, 46, 7105–7123 RSC.
- Y. Shen, A. J. Shuhendler, D. Ye, J.-J. Xu and H.-Y. Chen, Chem. Soc. Rev., 2016, 45, 6725–6741 RSC.
- J. Sun, Q. Xin, Y. Yang, H. Shah, H. Cao, Y. Qi, J. R. Gong and J. Li, Chem. Commun., 2018, 54, 715–718 RSC.
- H. M. Kim and B. R. Cho, Chem. Rev., 2015, 115, 5014–5055 CrossRef CAS PubMed.
- M. Pawlicki, H. Collins, R. Denning and H. Anderson, Angew. Chem., Int. Ed., 2009, 48, 3244–3266 CrossRef CAS PubMed.
- J. Olesiak-Banska, M. Waszkielewicz, P. Obstarczyk and M. Samoc, Chem. Soc. Rev., 2019, 48, 4087–4117 RSC.
- J. Hui, T. Prasad, J. R. Reynolds and K. S. Schanze, Angew. Chem., 2009, 48, 4300–4316 CrossRef PubMed.
- F. Liheng, Z. Chunlei, Y. Huanxiang, L. Libing, L. Fengting and W. Shu, Cheminform, 2014, 44, 6620–6633 Search PubMed.
- J. Yu, Y. Rong, C. T. Kuo, X. H. Zhou and D. T. Chiu, Anal. Chem., 2017, 89, 42–56 CrossRef CAS PubMed.
- X. Xinjun, L. Ronghua and L. Lidong, Chem. Commun., 2015, 51, 16733–16749 RSC.
- P. Johannes and M. Stefan, Chem. Rev., 2010, 110, 6260–6279 CrossRef.
- L. Shuang, S. Xiaoqin, L. Lin, Y. Peiyan, G. Zhenping, S. Q. Yao and X. Qing-Hua, Langmuir, 2014, 30, 7623–7627 CrossRef.
- S. Xiaoqin, L. Lin, W. Hao, S. Q. Yao and X. Qing-Hua, Nanoscale, 2011, 3, 5140–5146 RSC.
- M. Rumi, J. E. Ehrlich, A. A. Heikal, J. W. Perry, S. Barlow, Z. Hu, D. McCord-Maughon, T. C. Parker, H. Röckel and S. Thayumanavan, J. Am. Chem. Soc., 2000, 122, 9500–9510 CrossRef CAS.
- M. Albota, D. Beljonne, J. L. Brédas, J. E. Ehrlich, J. Y. Fu, A. A. Heikal, S. E. Hess, T. Kogej, M. D. Levin and S. R. Marder, Science, 1998, 281, 1653–1656 CrossRef CAS.
- C. Wu, C. Szymanski, Z. Cain and J. McNeill, J. Am. Chem. Soc., 2007, 129, 12904–12905 CrossRef CAS.
- A. Parthasarathy, H. Y. Ahn, K. D. Belfield and K. S. Schanze, ACS Appl. Mater. Interfaces, 2010, 2, 2744–2748 CrossRef CAS.
- X. Pang, Y. Tan, C. Tan, W. Li, N. Du, Y. Lu and Y. Jiang, ACS Appl. Mater. Interfaces, 2019, 11, 28246–28253 CrossRef CAS.
- N. A. Kukhta, D. A. da Silva Filho, D. Volyniuk, J. V. Grazulevicius and G. Sini, Chem. Mater., 2017, 29, 1695–1707 CrossRef CAS.
- A. Saeki, T. Fukumatsu and S. Seki, Macromolecules, 2011, 44, 3416–3424 CrossRef CAS.
- B. Jana, A. Ghosh and A. Patra, J. Phys. Chem. Lett., 2017, 8, 4608–4620 CrossRef CAS.
- B. Muthuraj, S. Mukherjee, C. R. Patra and P. K. Iyer, ACS Appl. Mater. Interfaces, 2016, 8, 32220–32229 CrossRef CAS PubMed.
- Y. H. Chan and P.-J. Wu, Part. Part. Syst. Charact., 2015, 32, 11–28 CrossRef CAS.
- N. Feiner-Gracia, M. Buzhor, E. Fuentes, S. Pujals, R. J. Amir and L. Albertazzi, J. Am. Chem. Soc., 2017, 139, 16677–16687 CrossRef CAS.
- L. Zhou, F. Lv, L. Liu and S. Wang, ACS Appl. Mater. Interfaces, 2017, 9, 27427–27432 CrossRef CAS.
- S. Wang, Z. Li, X. Liu, S. Phan, F. Lv, K. D. Belfield, S. Wang and K. S. Schanze, Chem. Mater., 2017, 29, 3295–3303 CrossRef CAS.
- W. Zhang, J. Kang, P. Li, L. Liu, H. Wang and B. Tang, Chem. Commun., 2016, 52, 13991–13994 RSC.
- X. Shen, L. Li, H. Wu, S. Q. Yao and Q. H. Xu, Nanoscale, 2011, 3, 5140–5146 RSC.
- M. Pawlicki, H. A. Collins, R. G. Denning and H. L. Anderson, Angew. Chem., Int. Ed., 2010, 48, 3244–3266 CrossRef.
Footnote |
| † Electronic supplementary information (ESI) available: Experimental including materials, general methods, synthesis, some supplementary spectra and tables. See DOI: 10.1039/d0ra01664k |
| This journal is © The Royal Society of Chemistry 2020 |

