 Open Access Article
Fabrication of Pd3@Beta for catalytic combustion of VOCs by efficient Pd3 cluster and seed-directed hydrothermal syntheses†
Wenjuan Sun *a,
Zhenglong Yanga,
Yanbin Xua,
Yawei Shib,
Yongjie Shena and
Guozhu Liu*c
aSchool of Chemistry and Materials Science, Ludong University, 264025 Yantai, Shandong Province, China. E-mail: sunwenjuan@ldu.edu.cn
bState Key Laboratory of Separation Membranes and Membrane Processes, School of Environmental Science and Engineering, Tiangong University, Tianjin 300387, China
cKey Laboratory for Green Chemical Technology of Ministry of Education, School of Chemical Engineering & Technology, Tianjin University, Tianjin 300072, China. E-mail: gliu@tju.edu.cn
First published on 31st March 2020
Abstract
Subnanometric Pd clusters confined within zeolite crystals was fabricated using zeolitic seeds with premade [Pd3Cl(PPh2)2(PPh3)3]+ clusters under hydrothermal conditions. Characterization of the Pd3@Beta catalysts indicate that the Pd clusters confined in the channels of Beta zeolite exhibit better dispersion and stronger interaction with the zeolite support, leading to stabilized Pd species after heat treatment by high temperature. In the model reaction of toluene combustion, the Pd3@Beta outperforms both zeolite-supported Pd nanoparticles prepared by conventional impregnation of Pd3/Beta and Pd/Beta. Temperatures for achieving toluene conversion of 5%, 50% and 98% of Pd3@Beta are 136, 169 and 187 °C at SV = 60![[thin space (1/6-em)]](https://www.rsc.org/images/entities/char_2009.gif) 000 mL g−1 h−1, respectively. Pd3@Beta could also maintain the catalytic reaction for more than 100 h at 230 °C without losing its activity, an important issue for practical applications. The metal-containing zeolitic seed directed synthesis of metal clusters inside zeolites endows the catalysts with excellent catalytic activity and high metal stability, thus providing potential avenues for the development of metal-encapsulated catalysts for VOCs removal.
000 mL g−1 h−1, respectively. Pd3@Beta could also maintain the catalytic reaction for more than 100 h at 230 °C without losing its activity, an important issue for practical applications. The metal-containing zeolitic seed directed synthesis of metal clusters inside zeolites endows the catalysts with excellent catalytic activity and high metal stability, thus providing potential avenues for the development of metal-encapsulated catalysts for VOCs removal.
1. Introduction
Breathing clean air is one basic demand for an ecological environment or for human health and well-being. However, volatile organic compounds (VOCs) from industrial emission have been seen as a major constituent of air pollution and gained much attention due to their effect on the formation of suspended particulate, photochemical fog and haze. Thus, various applicable techniques can be used for VOCs elimination, such as adsorption, membrane separation, condensation, thermal incineration, biological oxidation and catalytic combustion. Catalytic combustion is regarded as the most important technology, where VOCs can be completely converted into harmless products of CO2 and H2O at relatively low temperatures (<400 °C), especially for low VOC concentration (<1000 ppm). Generally, transition-metal complexes, perovskites and supported noble metal are three categories of catalysts for VOC combustion. However, in order to achieve good catalytic performance for the former two catalysts, a high temperature (>600 °C) must be performed. By contrast, supported noble-metal (e.g., palladium and platinum) catalysts display excellent catalytic activity and metal stability for VOCs combustion. Especially, zeolite-supported noble metal catalysts combined with the advantages of the zeolites (particular porous structure, large adsorption capacity and controllable acid sites)1–4 and the noble metals (high low-temperature reactivity and stability) were extensively investigated for its selective adsorptive properties, low-temperature activity, high-temperature stability and accessible active sites. Wang et al. found that Ru/hierarchical HZSM-5 catalyst could act as both adsorbent and catalyst for aromatic VOCs elimination under low concentration levels.5 Besides, Yang et al. reported that the hierarchical zeolite support could well improve the metal dispersion, the ratio of metal active sites and the toluene adsorption, and then the high catalytic performance during the toluene catalytic combustion.6 However, the catalytic property of conventional supported catalysts is still insufficient for the industrial applications, because the supported metals remain on the surface of zeolites as bulky particles and tend to sinter, or agglomerate under reaction temperatures and pressures.In order to make these metal catalysts more stable, zeolite-encapsulated metal structure has been proposed by confining metals inside the regular porous structure of zeolites. Recently, various strategies for synthesizing these encapsulated materials have been investigated, mainly including a ligand-stabilized method,7–12 a mercaptosilane-assisted method,13,14 an interzeolite transformations and fluoride media method,15 and a precursor-stabilization method.16,17 These preparation methods usually lead to a narrow particle size distribution with an average diameter around 1 nm and lager, which are greater than most zeolites micropores. Moreover, these prepared catalysts have demonstrated excellent catalytic properties for catalytic combustion of small organic volatiles. However, some kinds of large organic volatiles such as aromatics with dimensions larger than zeolite micropores typically can not enter the microchannels and thus deteriorate the accessibility to the internal active sites in catalytic reactions. Therefore, it is also a challenge to exploit methods for the synthesis of zeolite-confined metal catalysts with improved mass transfer from reactants and catalysts while inhibiting sintering/agglomeration of metals.
Recently, Iglesia et al. encapsulated metal clusters in MFI micropores by exchanging metal precursors within zeolite precursor through hydrothermal treatment first.14,15 Corma et al. reported a novel method to encapsulate subnanometric metal species into zeolites channels with the assistant of dimethylformamide.18–21 This method provides a possibility for the synthesis of thermal stable subnanometric metal catalysts for the hydrogenation of alkenes and dehydrogenation of propane to propylene. de Jong et al. reported the restriction of Pt clusters through adding premade metal clusters to zeolitic precursor to enhance their catalytic activity for dehydrogenation reactions.22 Zhang et al. confined Pd nanoparticles inside FER zeolite by using diethylenediamine palladium acetate as Pd precursor, and showed the catalyst had excellent activity.23 These cases show the practicability of producing subnanometric metal clusters confined in internal zeolite cavities by premade metal complex with organic ligands.
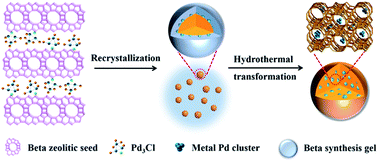
In this work, inspired by the above idea, we report a novel strategy to synthesize zeolite-confined subnanometric Pd catalysts (Pd3@Beta, as shown in Scheme 1), by assembling metal precursor clusters with protozeolitic seeds. As the staring material, zeolite Beta with 12-membered ring (MR) pore nearly 7.7 Å can promote the mass transfer of large VOCs (like toluene) and catalytic performance, and it can be used as a model.24,25 Pd precursor clusters could interact with the silanol groups (Si–OH) on the zeolitic units surface, and upon further wetness impregnation treatment, they assemble into zeolite-supported Pd cluster that function as zeolitic seeds. Because the Pd3@Beta structure evolves from the seeds by a solution mediated mechanism,26 Pd clusters were confined inside the zeolite crystals. The micropore-confined metal clusters will possess high dispersion and thermal stability, thus ensuring long catalyst lifetime and excellent catalytic cracking performance.
2. Experimental section
2.1 Catalyst preparation
Beta nanozeolites were prepared by hydrothermal synthesis with tetraethylammonium hydroxide (TEAOH) as the structure-director. Typically, fumed silica (SiO2) solution (nSiO2![[thin space (1/6-em)]](https://www.rsc.org/images/entities/char_2009.gif) :
:![[thin space (1/6-em)]](https://www.rsc.org/images/entities/char_2009.gif) nTEAOH = 5
nTEAOH = 5![[thin space (1/6-em)]](https://www.rsc.org/images/entities/char_2009.gif) :
:![[thin space (1/6-em)]](https://www.rsc.org/images/entities/char_2009.gif) 1) and aluminum in TEAOH solution (nAl
1) and aluminum in TEAOH solution (nAl![[thin space (1/6-em)]](https://www.rsc.org/images/entities/char_2009.gif) :
:![[thin space (1/6-em)]](https://www.rsc.org/images/entities/char_2009.gif) nTEAOH = 1
nTEAOH = 1![[thin space (1/6-em)]](https://www.rsc.org/images/entities/char_2009.gif) :
:![[thin space (1/6-em)]](https://www.rsc.org/images/entities/char_2009.gif) 3) were mixed on the scale of 35 to 1, according to our previous research.27,28 The synthesis solution was pre-crystallization in sealed autoclave at 115 °C for one day. The obtained intermediate was denoted as pro-zeolitic seeds. The conventional Beta zeolite was synthesized under similar conditions except for crystallization at 115 °C for 72 h.
3) were mixed on the scale of 35 to 1, according to our previous research.27,28 The synthesis solution was pre-crystallization in sealed autoclave at 115 °C for one day. The obtained intermediate was denoted as pro-zeolitic seeds. The conventional Beta zeolite was synthesized under similar conditions except for crystallization at 115 °C for 72 h.
Pd clusters fixed inside of zeolite crystals were synthesized by a two-step method. As a typical run for synthesis of the Pd3@Beta, the Beta zeolite seeds were impregnated with [Pd3Cl(PPh2)2(PPh3)3]+ (Pd3Cl, detailed synthesis steps were in ESI†)29 by adding organic auxiliary of ethanol (nsi![[thin space (1/6-em)]](https://www.rsc.org/images/entities/char_2009.gif) :
:![[thin space (1/6-em)]](https://www.rsc.org/images/entities/char_2009.gif) nEtOH = 7
nEtOH = 7![[thin space (1/6-em)]](https://www.rsc.org/images/entities/char_2009.gif) :
:![[thin space (1/6-em)]](https://www.rsc.org/images/entities/char_2009.gif) 5), followed by further crystallization for 48 h, drying at 100 °C overnight, treatment at 500 °C for 6 h under vacuum.
5), followed by further crystallization for 48 h, drying at 100 °C overnight, treatment at 500 °C for 6 h under vacuum.
Zeolite-supported Pd nanoparticles were obtained by incipient wetness impregnation process. The Beta zeolites were impregnated with Pd3Cl and PdCl2 solution under ultrasound for 0.5 h, followed by evaporation to remove water, dryness at 80 °C for 12 h, treatment at 400 °C for 4 h and reduction by hydrogen at 300 °C for 2 h. These prepared materials were coded as Pd3/Beta and Pd/Beta, respectively. Effects of Pd loading amount on the toluene conversion have been studied as shown in Table S1,† keeping other experimental parameters constant. By varying the amount of Pd from 0.1 to 0.9 wt% in Pd3@Beta catalyst, it is found that 0.5 wt% Pd loading is the optimum for the reaction, since there is a balance between more Pd active sites and stable toluene mass diffusion rate in zeolite support. Therefore, each catalyst has the same metal loading of 0.5% (w/w).
2.2 Characterizations
X-ray diffraction (XRD) patterns were determined on a Rigaku D/MAX 2500 diffractometer (Cu Kα, λ = 0.154 nm) in the region of 2θ = 5–50°. Transmission electron microscopy (TEM) images were investigated on a JOEL JEM-1230 microscope. The metal dispersion and particle size were distinguished through a scanning transmission electron microscopy (STEM, Titan cubed Themis G2 300, 300 kV). Textural properties of samples (e.g., including specific BET surface area (SBET), external surface area (Sext), mesopore volume (Vmeso), micropore volume (Vmic), etc.) were collected from N2 adsorption/desorption isothermals using an ASAP 2020 analyzer (Micromeritics) at −196 °C. All catalysts have to first degass at 300 °C for one day under high vacuum. Sext and Vmic were obtained by the t-plot method. SBET and Vmeso were calculated by the Brunauer–Emmett–Teller method and Barrett–Joyner–Halenda method, respectively. The coordination states of Si and Al species were studied by 29Si CP/MAS nuclear magnetic resonance (NMR, 59.6 MHz, 3.0 kHz) and 27Al MAS NMR (78.1 MHz, 8.0 kHz) spectroscopy, respectively. The chemical states of Pd species were recorded with X-ray photoelectron spectrometer (XPS, Thermo ESCALAB 250Xi, Al Kα). The overall Si/Al molar ratio and metal concentration were obtained on an inductively coupled plasma-atomic emission spectrometry (ICP-AES) analysis (ICPE9000). CO chemisorption measurements were performed using a pulse method on an Altamira AMI-300 chemisorption analyzer. Before the test, approximately 50 mg specimen was reduced under hydrogen atmosphere at 450 °C for 2 h. After the specimen was cooled to 35 °C under helium atmosphere, pulse chemisorption of CO was performed with 37.5% CO/62.5% He. The dispersion of Pd was calculated by assuming that CO was adsorbed on Pd surface at 1![[thin space (1/6-em)]](https://www.rsc.org/images/entities/char_2009.gif) :
:![[thin space (1/6-em)]](https://www.rsc.org/images/entities/char_2009.gif) 1 stoichiometry. Investigation on coke formation of these catalysts were analysed via thermogravimetric analysis (TGA-50).
1 stoichiometry. Investigation on coke formation of these catalysts were analysed via thermogravimetric analysis (TGA-50).
2.3 Catalytic test for toluene combustion
All toluene combustion reactions were conducted in a quartz fixed-bed flow reactor (8 mm inner diameter). In order to prevent the hot-spots phenomenon, 100 mg pressed catalyst sample (20–40 mesh) was mixed with 2.0 g silicon carbide (SiC, 20–40 mesh) on the scale of 1![[thin space (1/6-em)]](https://www.rsc.org/images/entities/char_2009.gif) :
:![[thin space (1/6-em)]](https://www.rsc.org/images/entities/char_2009.gif) 20, and then the mixture was placed in a quartz reactor tube. Before each catalytic test, the reactor was preheated to 100 °C at heating rate of 2 °C min−1 for 1 h to reduce the absorbed residues and over-calculation of toluene conversion. The inlet gas (79% N2 + 21% O2) with 1000 ppm of toluene was fed at a flow rate of 100 mL min−1, i.e., a space velocity (SV) at 60
20, and then the mixture was placed in a quartz reactor tube. Before each catalytic test, the reactor was preheated to 100 °C at heating rate of 2 °C min−1 for 1 h to reduce the absorbed residues and over-calculation of toluene conversion. The inlet gas (79% N2 + 21% O2) with 1000 ppm of toluene was fed at a flow rate of 100 mL min−1, i.e., a space velocity (SV) at 60![[thin space (1/6-em)]](https://www.rsc.org/images/entities/char_2009.gif) 000 mL g−1 h−1. Both toluene and oxidative products in outlet gas were obtained on a gas chromatograph (Bruker 456) equipped FID detector using a PONA capillary column (50 m × 0.25 mm × 0.50 μm) for toluene, and an infrared spectrum analyser (GXH-1050E) for CO2 and CO.
000 mL g−1 h−1. Both toluene and oxidative products in outlet gas were obtained on a gas chromatograph (Bruker 456) equipped FID detector using a PONA capillary column (50 m × 0.25 mm × 0.50 μm) for toluene, and an infrared spectrum analyser (GXH-1050E) for CO2 and CO.
The catalytic activities were estimated by the values of T5, T50 and T98, which were calculated with the temperature at 5%, 50% and 98% of toluene conversion, respectively. Toluene conversion can be computed from eqn (1):
| Toluene conversion (%) = 100(Cin,Tol − Cout,Tol)/Cin,Tol | (1) |
| CO2 selectivity (%) = 100 nCO2/(nCO2 + nCO) | (2) |
3. Results and discussion
3.1 Structural properties
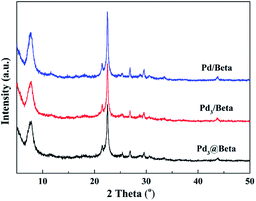
The preparation process of Pd3@Beta is illustrated in Scheme 1. To incorporate subnanometric Pd species into Beta crystals, zeolitic seeds and Pd clusters were first synthesized. The premade Pd3Cl clusters are introduced by the impregnation method to obtain Pd-containing zeolitic seeds, and the inception of Pd species is localized on the surface of zeolitic seeds. The above synthesized seeds are added into the Beta synthesis gel mixture with ethanol acting as solubilizer to enhance Pd3Cl stability in gel. Upon further hydrothermal time, the Pd complexes interact with negatively charged Si–O–Al species27 via electrostatic binding and the sol–gel reaction mixture crystallized around the crystal nucleus by a core–shell growth mechanism30 until the amorphous subunits completely converted into zeolite crystals. At this stage, most Pd species are encapsulated into the zeolite framework by self-assembly. Upon calcination under vacuum, the metallic subnanometric Pd clusters were finally formed and confined inside the Beta zeolite. The specific feature of Pd clusters within the Beta zeolite on the properties and catalytic performance will be discussed below.The structural properties for prepared Pd/Beta, Pd3/Beta and Pd3@Beta catalysts were analyzed through a series of characterization techniques. The XRD spectrums shown in Fig. 1 exhibit that all prepared zeolites have the characteristic diffraction peaks of the zeolite Beta structure, indicating that they are stable after encapsulating Pd clusters into the zeolite channel. In addition, no characteristic diffraction peaks are detected for Pd and PdO because of its low loading or weak crystallinity.
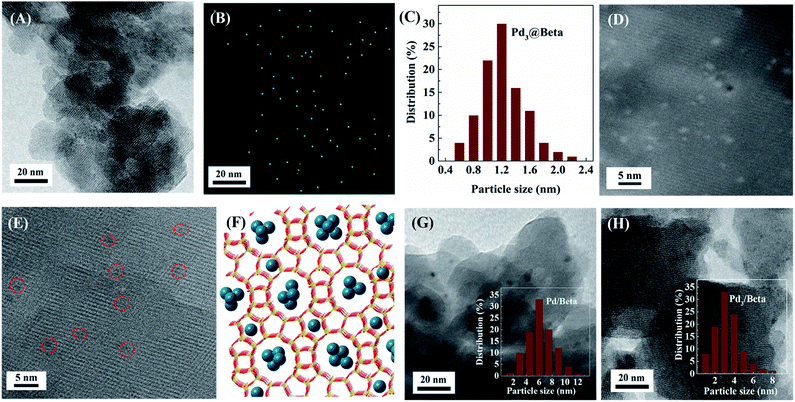
TEM images, Pd elemental maps, metal particle size distributions and HAADF-STEM images of the synthesized catalysts are shown in Fig. 2. All catalysts display regular crystalline structure with noticeable crystal lattices. Pd/Beta support possesses bipyramid morphology with particle size of 50 nm, whereas Pd3@Beta support is comprised of small zeolite units with particle size of 20 nm. As for Pd3@Beta catalyst, the interparticle voids between the nanosized zeolite may generate the intercrystalline mesopores. As shown in Fig. 2A, the Pd clusters located inside the zeolite are homogenously dispersed and distributed in the Pd3@Beta crystallites. The average particle size of Pd species was obtained by calculating more than 200 particles, as shown in Table 1. The existence and the uniform dispersion of Pd clusters or individual Pd atoms can be distinguished in the selected-area element mapping images (Fig. 2B). It is can be seen that the mean sizes of Pd clusters of 1.2 nm (Fig. 2C) in seed-directed Pd3@Beta sample are obviously smaller than those of Pd3/Beta (3.5 nm, Fig. 2H) and the Pd/Beta (6 nm, Fig. 2G). It is worth mentioning that a majority of Pd clusters size between 0.3–0.8 nm can be seen here for Pd3@Beta (Fig. 2D). However, there are still few Pd clusters larger than 2 nm can be observed in the sample. Notably, the sizes of ultra-small Pd clusters in the Pd3@Beta catalyst appear smaller than those of Beta straight channels (0.77 × 0.67 nm) and tortuous channels (0.56 × 0.56 nm). Tomographic images clearly show the micropores in Pd3@Beta sample and Pd clusters can be found in it (Fig. 2E), suggesting the successful encapsulation of Pd clusters inside of zeolite crystals (as illustrated in Fig. 2F). Since the confinement of the Beta framework could limit the size of metal nanoparticles, the Pd cluster with less than 6 atoms can be contained.
| Sample | Si/Ala | mPdb (wt%) | SBET (m2 g−1) | Sext (m2 g−1) | Vmeso (cm3 g−1) | Dc (%) | dCOd (nm) | dTEMe (nm) |
|---|---|---|---|---|---|---|---|---|
| a Si-to-Al molar ratio measured by ICP-AES.b Pd content determined by ICP-AES analysis.c Metal dispersion obtained from CO chemisorption.d Pd particle size calculated from CO chemisorption.e Mean diameters by measuring at least 200 individual Pd particles from TEM images. | ||||||||
| Pd3@Beta | 36 | 0.46 | 718 | 336 | 0.53 | 57.3 | 1.7 | 1.2 |
| Pd3/Beta | 35 | 0.47 | 626 | 182 | 0.35 | 28.9 | 4.9 | 3.5 |
| Pd/Beta | 35 | 0.45 | 578 | 120 | 0.28 | 16.7 | 6.6 | 6.0 |
N2 adsorption–desorption isotherms and the pore size distribution curves for these prepared catalysts are presented in Fig. 3, and the corresponding textural properties are listed in Table 1. All samples exhibit typical isotherms of type-IV, indicating the presence of mesoporosity. Pd3/Beta and Pd/Beta present hysteresis loops at relative pressure from 0.6 to 1.0, suggesting the formation of secondary mesopores related with the spaces between zeolite crystal and particles. It is also shown that the hysteresis loops of the Pd3@Beta shift towards lower relative pressure, meaning the formation of smaller mesopore. As shown in Fig. 3B, the pore size distribution of Pd/Beta is extremely broad, from 4 to 20 nm. Among these catalysts, Pd3@Beta have the narrowest pore distribution around 3.0 nm, since the synthesis process make use of premade metal clusters with organic ligands. Owing to the introduction of more mesopores, Pd3@Beta and Pd3/Beta have much higher specific surface area and larger mesoporous volume than that of Pd/Beta. The presence of mesopores is believed to be the critical factor to improve total pore volume and Pd dispersion of the Pd3@Beta sample, which facilitates the diffusion of reactants to the catalyst sites and thus to enhance mass transfer and catalytic performance.
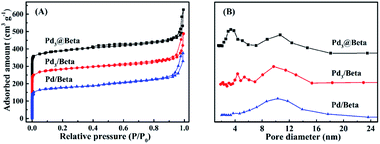 | ||
| Fig. 3 (A) Nitrogen physisorption isotherms at 77 K and (B) pore-size distribution using NLDFT model of the adsorption isotherm for Pd3@Beta, Pd3/Beta and Pd/Beta catalysts. | ||
The Pd content, dispersion of Pd and particle size of the as-prepared catalysts are listed in Table 1. The final Pd content (measured by ICP) in all as-prepared samples are close to the theoretical Pd (0.5 wt%). The increasing order of Pd dispersion is as this sequence: Pd3@Beta (57.3%) > Pd3/Beta (28.9%) > Pd/Beta (16.7%). There are three locations for Pd species: the microporous channels, intra/inter mesopores, and the zeolite surface. As for Pd clusters with size less than 0.8 nm (Fig. S2†), they are protected by the micropores from aggregating during the preparation process and thus avail the Pd dispersion in Pd3@Beta. Accordingly, the calculated Pd particle size for Pd/Beta sample is ca. 6.6 nm, which is in line with the results obtained from electron microscopy. On the other hand, the calculated size of Pd particles is ca. 1.7 nm for Pd3@Beta and 4.9 nm for Pd3/Beta, which are much larger than those calculated from the TEM results. This would be explained by that the Pd species is partially covered by Beta zeolite, and thus the Pd atoms cannot be completely detected by CO chemisorption.
3.2 Surface properties
The chemical states of Pd species in synthesized samples were determined by XPS spectrum (Fig. 4A). In the Pd 3d XPS spectrum of Pd/Beta, one can clearly distinguish the 3d3/2 and 3d5/2 peaks for Pd0 (metallic palladium) at 341.1 and 335.5 eV respectively and also the 3d5/2 peak for Pd2+ (palladium oxide) at 339.2 eV.31,32 The absence of Pd2+ signals of Pd3@Beta rather suggests that most of Pd species were reduced during the treatment of the calcined material under H2 flow. After deconvolution, the Pd0/Pd2+ ratio increases the order Pd3@Beta > Pd3/Beta > Pd/Beta, in accordance with the mesoporous volumes. And for Pd clusters confined in zeolites, a negative shift (0.4–0.6 eV) of the Pd 3d5/2 band shows that Pd species has a high degree of interaction with the zeolite framework. A rational explanation is that the electron transfer from Pd to the zeolite framework.33 It should be noted that the Pd XPS intensities in Pd3@Beta was much lower than that in Pd3/Beta and Pd/Beta. This implies that the Pd species are uniformly located inside zeolite crystals in Pd3@Beta, while they are located predominantly at near-to-surface area of zeolite supports in Pd3/Beta and Pd/Beta. Moreover, 29Si/27Al MAS NMR spectra (Fig. S2†) confirms that all Si or Al species in Pd3@Beta exist in zeolite skeleton format by Si–O–Al linkages.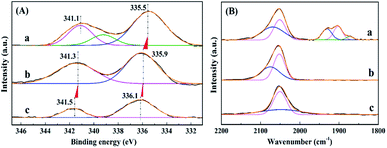 | ||
| Fig. 4 (A) Pd 3d XPS spectra and (B) FTIR spectra of CO adsorbed on (a) Pd/Beta, (b) Pd3/Beta and (c) Pd3@Beta catalysts. | ||
To further explore the local environment and exposed sites of Pd species, FTIR spectra of CO chemisorption on the prepared samples has been used. As shown in Fig. 4B, Pd/Beta exhibited peaks at 2100–2000, 1930 and 1900 cm−1 assigned to linear, 2-fold bridged and 3-fold bridged carbonyls, respectively, and a peak at 1860 cm−1 ascribed to adsorption of CO on large Pd metal particles with high coordination numbers.33,34 For Pd clusters confined in zeolites, only linear carbonyls (2100–2000 cm−1) were observed, while 2-fold bridged and 3-fold bridged carbonyls were absent. Generally, it is acknowledged that linear carbonyls indicate a high proportion of Pd sites with low coordination.35 It can be seen from Fig. 4B that the proportion of lineal carbonyls in total carbonyls follows the order Pd3@Beta > Pd3/Beta > Pd/Beta. Thus, it can be speculated that the Pd species would exist in the form of ultra-small clusters in Pd3@Beta, while in Pd/Beta the majority of Pd particles is characteristic of large grain and low dispersion.
3.3 Catalytic performance for toluene combustion
Fig. 5 shows the catalytic activities with reaction temperature for toluene combustion of various samples, and their related T5, T50, and T98 values are summerized in Table 2. From the results, Pd3@Beta shows the highest catalytic activity (T5 = 136 °C and T98 = 187 °C), and T98 over Pd3@Beta was 16 °C and 31 °C lower than over Pd3/Beta (203 °C) and Pd/Beta (218 °C), respectively. This phenomenon can be attributed to the following reasons: the dispersion of Pd, the proportion of Pd0 and the structure properties of support.19,36–41 He et al. reported that metallic Pd species (Pd0) is active for hydrocarbons combustion and can catalyze VOCs directly into CO2 and H2O, which benefits the catalytic activity.41,42 The high Pd dispersion would offer more catalytic active sites for toluene combustion and the mesoporous zeolite support can accelerate diffusion of reactants to active sites in Pd3@Beta, both of which can enhance toluene combustion rate. As shown in Fig. 4A and Table 1, it is found that activity ordering accords with the sequence of the dispersion of Pd, the proportion of Pd0 and the textural properties of support.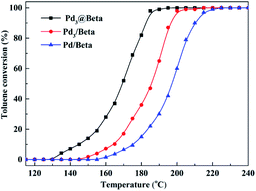 | ||
Fig. 5 Catalytic activity in combustion of toluene with reaction temperature at SV = 60![[thin space (1/6-em)]](https://www.rsc.org/images/entities/char_2009.gif) 000 mL g−1 over Pd3@Beta, Pd3/Beta and Pd/Beta catalysts. 000 mL g−1 over Pd3@Beta, Pd3/Beta and Pd/Beta catalysts. | ||
| Sample | T5 (°C) | T50 (°C) | T98 (°C) |
|---|---|---|---|
| Pd3@Beta | 136 | 169 | 187 |
| Pd3/Beta | 157 | 186 | 203 |
| Pd/Beta | 168 | 197 | 218 |
Meanwhile, Fig. 6 shows the catalytic performance and metal stability over time for toluene combustion of prepared catalysts under 230 °C. Under such conditions, all the conversions of toluene reach 100% at the initial stage. As time progresses, the Pd3@Beta catalyst exhibited much better stabilities, maintaining at about 100% conversion for more than 100 h. However, a decrease was observed at 61 h and 87 h for Pd/Beta and Pd3/Beta, respectively. Notably, during the reaction, there is no significant drop in selectivity to CO2 for Pd3@Beta catalyst (inset of Fig. 6). Fig. S3† presents the TEM images of these catalysts after used for the reaction at 230 °C for 100 h. For the Pd3/Beta and Pd/Beta catalysts, the Pd nanoparticles tend to aggregate into lager particles (7–10 nm) after the same reaction conditions (Fig. S3A and B†). The images further demonstrate that the Pd clusters are highly dispersed within zeolite micropores in size of 0.7 to 0.9 nm (Fig. S3C†) and very similar to that of the fresh catalyst, indicating the Pd clusters are stably confined inside of the zeolite micropores via seed-directed method. For further confirmation of thermal stability of Pd clusters, Pd3@Beta catalyst was tested under 600 °C for 1 h.12 It is found that the crystallinity, textural properties, catalyst morphology and the size of Pd nanoparticles are seldom changed, which reveals a good sintering-resistance during high temperature reaction process, as shown in Fig. S4.†
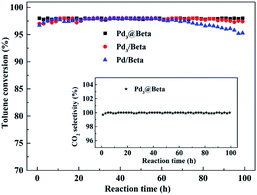 | ||
| Fig. 6 Toluene conversion and CO2 selectivity (inset) over reaction time for Pd3@Beta, Pd3/Beta and Pd/Beta catalysts. | ||
In addition, Fig. 7 presents TGA thermograms of used catalysts. All catalysts display two-step mass losses: stage I (below 300 °C), the weight reduction is mainly ascribed to the removal of absorbed water on zeolite surface, and stage II (300–800 °C), this step could be due to coke formation on the catalyst. Comparatively, Pd3@Beta catalyst present a much less weight loss with 1.15% than that on Pd3/Beta (1.53%) and Pd/Beta (2.24%), indicating that the latter two has higher coke formation than Pd3@Beta. The more mass reduction under temperature over 300 °C was due to further coke oxidation and thus to prove higher efficiency for toluene deep oxidation and lower final inactivation rate of Pd3@Beta. It is reasonably determined that the high activity of Pd3@Beta should could be due to the fact that the Pd cluster is located in the channel of the Beta zeolite and the channel of Beta has stereo-confinement.
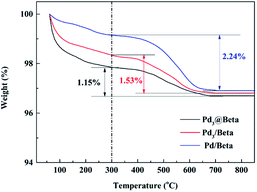 | ||
| Fig. 7 TGA curves of Pd3@Beta, Pd3/Beta and Pd/Beta catalysts after being used for toluene combustion at 230 °C for 100 h. | ||
3.4 Kinetics study
For the toluene combustion reaction, pioneering studies have shown that the reaction orders are first-order for toluene and zero-order for oxygen under excess oxygen presence in the system (O2/toluene molar ratio ≥ 200).43–46 So, there is reason to presume that the toluene combustion follows the first-order kinetic reaction and the activation energy was calculated from Arrhenius eqn (3):
r = −kc = [−A![[thin space (1/6-em)]](https://www.rsc.org/images/entities/char_2009.gif) exp(−Ea/RT)]c exp(−Ea/RT)]c
| (3) |
k = 1/t![[thin space (1/6-em)]](https://www.rsc.org/images/entities/char_2009.gif) ln[1/(1 − x)] ln[1/(1 − x)]
| (4) |
The Arrhenius plots of ln![[thin space (1/6-em)]](https://www.rsc.org/images/entities/char_2009.gif) k vs. 1000/T for toluene combustion within the temperature range of 135–175 °C (when the toluene conversion was less than 10%) are shown in Fig. 8A. Kinetic parameters such as pre-exponential factor, activation energy and correlation coefficients (R2) have been calculated from the intercept and slope of these plots, and the data are summarized in Table S3.† It can be seen that k values rise along with temperature increment, and Pd3@Beta catalyst shows the highest reaction rate among others suggesting the best catalytic performance. As shown in Table S3,† the Ea value obtained from the Pd3@Beta catalyst (70 kJ mol−1) was much lower than those over Pd3/Beta (94 kJ mol−1) and Pd/Beta (145 kJ mol−1). These data are consistent with those reported before45–47 and littler lower than Pt@PZN-2,48 which confirms that the Pd3@Beta has superior properties in toluene combustion at low temperatures.
k vs. 1000/T for toluene combustion within the temperature range of 135–175 °C (when the toluene conversion was less than 10%) are shown in Fig. 8A. Kinetic parameters such as pre-exponential factor, activation energy and correlation coefficients (R2) have been calculated from the intercept and slope of these plots, and the data are summarized in Table S3.† It can be seen that k values rise along with temperature increment, and Pd3@Beta catalyst shows the highest reaction rate among others suggesting the best catalytic performance. As shown in Table S3,† the Ea value obtained from the Pd3@Beta catalyst (70 kJ mol−1) was much lower than those over Pd3/Beta (94 kJ mol−1) and Pd/Beta (145 kJ mol−1). These data are consistent with those reported before45–47 and littler lower than Pt@PZN-2,48 which confirms that the Pd3@Beta has superior properties in toluene combustion at low temperatures.
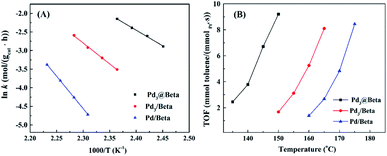 | ||
| Fig. 8 Arrhenius plots (A) and the temperature-dependence of turnover frequencies (B) for toluene combustion at conversion less than 10% over Pd3@Beta, Pd3/Beta and Pd/Beta catalysts. | ||
Fig. 8B shows the dependence of turnover frequencies (TOF) with increasing temperature in the toluene catalytic combustion with the conversion below 10% over Pd3@Beta, Pd3/Beta, and Pd/Beta catalysts. These plots display that TOF values tend to increase with rising temperature for each catalyst, which is in agreement with that of toluene conversion vs. reaction temperature. The corresponding data shown in Table S4† of the Pd3@Beta catalyst (2.48 mmoltoluene molPd0−1 s−1) at 135 °C was much higher than those over Pd3/Beta (1.68 mmoltoluene molPd0−1 s−1) at 150 °C and Pd/Beta (1.39 mmoltoluene molPd0−1 s−1) at 160 °C, suggesting the high catalytic cracking performance of the encapsulated-design structure. In addition, TOF values of Pd/Beta is lower than that of Pd3/Beta indicating the lowest catalytic efficiency for toluene combustion of Pd/Beta. In consistent with the catalytic performance, these results explain why the confined-design structure of Pd3@Beta catalyst has outstanding catalytic performance in catalytic combustion of toluene.
4. Conclusion
An applicable strategy was developed for the encapsulation of subnanometric Pd clusters within zeolite nanocrystals using Pd3Cl cluster as precursor under a seed-directed hydrothermal conditions. The key point of the route is the construction of Pd-containing zeolitic seed, followed by recrystallization in the zeolitic synthesis gel by hydrothermal treatment and formation of Pd clusters inside zeolite channels. The prepared Pd3@Beta material has high metal dispersion and textural properties as well as the strong Pd species–zeolite interaction, which exhibits high catalytic performance in toluene total oxidation. The activity results indicate that the Pd3@Beta sample is very active, giving a T98 value of 187 °C, which is about 16 °C and 31 °C lower than over Pd3/Beta (203 °C) and Pd/Beta (218 °C), respectively. Moreover, Pd3@Beta showed superior thermal stability, maintaining at about 100% toluene conversion for more than 100 h. Therefore, this work establishes a promising approach to encapsulate metal species inside zeolite micropores by using premade-metal cluster precursors for high-temperature catalytic reactions.Conflicts of interest
There are no conflicts of interest to declare.Acknowledgements
The authors gratefully acknowledge financial support from National Natural Science Foundation of China (Grant No. 21806070, 51908409, 51673090), Nature Science Foundation of Shandong Province (No. ZR2018PB017) and the Science and Technology Development Plan (No. J17KA006) of Shandong Provincial Education Department.References
- L. Zhang, Y. Peng, J. Zhang, L. Chen, X. Meng and F.-S. Xiao, Chin. J. Catal., 2016, 37, 800–809 CrossRef CAS.
- R. Zhao, Z. Zhao, S. Li, A.-N. Parvulescu, U. Müller and W. Zhang, ChemSusChem, 2018, 11, 3803–3811 CrossRef CAS PubMed.
- E. Yuan, C. Wu, G. Liu, G. Li and L. Wang, J. Ind. Eng. Chem., 2018, 66, 158–167 CrossRef CAS.
- Y. Xia, J. Ye, D. Cheng, F. Chen and X. Zhan, Catal. Sci. Technol., 2018, 8, 5137–5147 RSC.
- Y. Wang, D. Yang, S. Li, M. Chen, L. Guo and J. Zhou, Microporous Mesoporous Mater., 2018, 258, 17–25 CrossRef CAS.
- D. Yang, S. Fu, S. Huang, W. Deng, Y. Wang, L. Guo and T. Ishihara, Microporous Mesoporous Mater., 2020, 296, 109802 CrossRef.
- S. Goel, Z. Wu, S. I. Zones and E. Iglesia, J. Am. Chem. Soc., 2012, 134, 17688–17695 CrossRef CAS PubMed.
- Z. Wu, S. Goel, M. Choi and E. Iglesia, J. Catal., 2014, 311, 458–468 CrossRef CAS.
- N. Wang, Q. Sun, R. Bai, X. Li, G. Guo and J. Yu, J. Am. Chem. Soc., 2016, 138, 7484–7487 CrossRef CAS PubMed.
- R. Singh, D. Kunzru and S. Sivakumar, Appl. Catal., B, 2016, 185, 163–173 CrossRef CAS.
- J. Wu, L. Zeng, D. Cheng, F. Chen, X. Zhan and J. Gong, Chin. J. Catal., 2016, 37, 83–90 CrossRef CAS.
- X. Gao, Y. Zhou, L. Feng, F. Tian, X. Liu, J. Xu and Y. Li, Microporous Mesoporous Mater., 2019, 283, 82–87 CrossRef CAS.
- M. Choi, Z. Wu and E. Iglesia, J. Am. Chem. Soc., 2010, 132, 9129–9137 CrossRef CAS PubMed.
- T. Otto, S. I. Zones and E. Iglesia, J. Catal., 2016, 339, 195–208 CrossRef CAS.
- S. Goel, S. I. Zones and E. Iglesia, J. Am. Chem. Soc., 2014, 136, 15280–15290 CrossRef CAS PubMed.
- T. Cui, W. Ke, W. Zhang, H. Wang, X. Li and J. Chen, Angew. Chem., Int. Ed., 2016, 55, 9178–9182 CrossRef CAS PubMed.
- J. Zhang, L. Wang, Y. Shao, Y. Wang, B. C. Gates and F.-S. Xiao, Angew. Chem., Int. Ed., 2017, 129, 9879–9883 CrossRef.
- L. Liu, U. Díaz, R. Arenal, G. Agostini, P. Concepción and A. Corma, Nat. Mater., 2016, 16, 132 CrossRef PubMed.
- L. Liu and A. Corma, Chem. Rev., 2018, 118, 4981–5079 CrossRef CAS PubMed.
- L. Liu, D. Zakharov, R. Arenal, P. Concepcion, E. Stach and A. Corma, Nat. Commun., 2018, 9, 574 CrossRef PubMed.
- L. Liu, R. Arenal, D. Meira and A. Corma, Chem. Commun., 2019, 55, 1607–1610 RSC.
- K. de Jong and J. Zečević, Nat. Mater., 2017, 16, 7 CrossRef CAS PubMed.
- Z. Zhao, Y. Li, M. Feyen, R. McGuire, U. Müller and W. Zhang, ChemCatChem, 2018, 10, 2254–2259 CrossRef CAS.
- M. Cooper and J. Shepherd, Thermal and catalytic cracking of JP-10 for pulse detonation engine applications, Graduate Aeronautical Laboratories, California Institute of Technology, Pasadena, CA, 2002 Search PubMed.
- Y. Kamimura, S. Tanahashi, K. Itabashi, A. Sugawara, T. Wakihara, A. Shimojima and T. Okubo, J. Phys. Chem. C, 2011, 115, 744–750 CrossRef CAS.
- M. Do, T. Wang, D. Cheng, F. Chen, X. Zhan and J. Gong, J. Mater. Chem. A, 2014, 2, 14360–14370 RSC.
- W. Sun, L. Wang, X. Zhang and G. Liu, Microporous Mesoporous Mater., 2015, 201, 219–227 CrossRef CAS.
- W. Sun, G. Liu, L. Wang and X. Zhang, Fuel, 2015, 144, 96–102 CrossRef CAS.
- F. Fu, J. Xiang, H. Cheng, L. Cheng, H. Chong, S. Wang, P. Li, S. Wei, M. Zhu and Y. Li, ACS Catal., 2017, 7, 1860–1867 CrossRef CAS.
- B. Xie, H. Zhang, C. Yang, S. Liu, L. Ren, L. Zhang, X. Meng, B. Yilmaz, U. Müller and F.-S. Xiao, Chem. Commun., 2011, 47, 3945–3947 RSC.
- Y. Wang, J. Yao, H. Li, D. Su and M. Antonietti, J. Am. Chem. Soc., 2011, 133, 2362–2365 CrossRef CAS PubMed.
- W. Ding, M. Xia, Z. Wei, S. Chen, J. Hu, L. Wan, X. Qi, X. Hu and L. Li, Chem. Commun., 2014, 50, 6660–6663 RSC.
- Y. Chai, S. Liu, Z.-J. Zhao, J. Gong, W. Dai, G. Wu, N. Guan and L. Li, ACS Catal., 2018, 8, 8578–8589 CrossRef CAS.
- E. Yuan, C. Wu, G. Liu and L. Wang, Appl. Catal., A, 2016, 525, 119–127 CrossRef CAS.
- F. Di Gregorio, L. Bisson, T. Armaroli, C. Verdon, L. Lemaitre and C. Thomazeau, Appl. Catal., A, 2009, 352, 50–60 CrossRef CAS.
- C. He, P. Li, H. Wang, J. Cheng, X. Zhang, Y. Wang and Z. Hao, J. Hazard. Mater., 2010, 181, 996–1003 CrossRef CAS PubMed.
- C. He, X. Zhang, S. Gao, J. Chen and Z. Hao, J. Ind. Eng. Chem., 2012, 18, 1598–1605 CrossRef CAS.
- C. He, J. Li, X. Zhang, L. Yin, J. Chen and S. Gao, Chem. Eng. J., 2012, 180, 46–56 CrossRef CAS.
- K. Murata, Y. Mahara, J. Ohyama, Y. Yamamoto, S. Arai and A. Satsuma, Angew. Chem., Int. Ed. Engl., 2017, 56, 15993–15997 CrossRef CAS PubMed.
- J. Kumar, G. Deo and D. Kunzru, Int. J. Hydrogen Energy, 2016, 41, 18494–18501 CrossRef CAS.
- Y. Wang, C. Zhang and H. He, ChemCatChem, 2018, 10, 998–1004 CrossRef CAS.
- S. Huang, C. Zhang and H. He, Catal. Today, 2008, 139, 15–23 CrossRef CAS.
- M. Alifanti, M. Florea, S. Somacescu and V. Parvulescu, Appl. Catal., B, 2005, 60, 33–39 CrossRef CAS.
- S. Zhao, F. Hu and J. Li, ACS Catal., 2016, 6, 3433–3441 CrossRef CAS.
- Y. Liu, H. Dai, Y. Du, J. Deng, L. Zhang, Z. Zhao and C. Au, J. Catal., 2012, 287, 149–160 CrossRef CAS.
- C. Chen, J. Zhu, F. Chen, X. Meng, X. Zheng, X. Gao and F.-S. Xiao, Appl. Catal., B, 2013, 140–141, 199–205 CrossRef CAS.
- T. Masui, H. Imadzu, N. Matsuyama and N. Imanaka, J. Hazard. Mater., 2010, 176, 1106–1109 CrossRef CAS PubMed.
- G. Liu, Y. Tian, B. Zhang, L. Wang and X. Zhang, J. Hazard. Mater., 2019, 367, 568–576 CrossRef CAS PubMed.
Footnote |
| † Electronic supplementary information (ESI) available: Synthesis information and UV-Vis spectra of Pd3Cl; TEM micrographs of used catalyst; calculation of kinetics parameters of rate constants, pre-exponential factor, activation energy and turnover frequencies. See DOI: 10.1039/d0ra01576h |
| This journal is © The Royal Society of Chemistry 2020 |

