DOI:
10.1039/D0RA01542C
(Paper)
RSC Adv., 2020,
10, 18769-18775
Enhancing the thermoelectric power factor of nanostructured ZnCo2O4 by Bi substitution
Received
18th February 2020
, Accepted 11th May 2020
First published on 18th May 2020
Abstract
BixZnCo2−xO4 (0 ≤ x ≤ 0.2) nanoparticles with different x values have been prepared by the sol–gel method; the structural, morphological, thermal and thermoelectric properties of the prepared nanomaterials are investigated. XRD analysis confirms that Bi is completely dissolved in the ZnCo2O4 lattice till the x values of ≤0.1 and the secondary phase of Bi2O3 is formed at higher x value (x > 0.1). The synthesized nanomaterials are densified and the thermoelectric properties are studied as a function of temperature. The electrical resistivity of the BixZnCo2−xO4 decreased with x value and it fell to 4 × 10⁻² Ω m for the sample with x value ≤ 0.1. The Seebeck coefficient value increased with the increase of Bi substitution till the x value of 0.1 and decreased for the sample with higher Bi content (x ≤ 0.2) as the resistivity of the sample increased due to secondary phase formation. With the optimum Seebeck coefficient and electrical resistivity, Bi0.1ZnCo1.9O4 shows the high-power factor (α2σ550 K) of 2.3 μW K−2 m−1 and figure of merit of 9.5 × 10⁻⁴ at 668 K respectively, compared with other samples. The experimental results reveal that Bi substitution at the Co site is a promising approach to improve the thermoelectric properties of ZnCo2O4.
Introduction
Enormous amounts of waste heat are liberated from automobiles, industries, etc.; the liberated waste heat can be efficiently recycled into electric energy by thermoelectric technology. Thermoelectric is a greener form of energy conversion technology, as it can generate electricity directly from waste heat without moving parts.1–4 The power generation of a thermoelectric material is governed by the dimensionless figure of merit,  , where S is Seebeck coefficient, σ is electrical conductivity, k is thermal conductivity, and T is temperature. To obtain high thermoelectric performance the material should possess low thermal conductivity (k), high electrical conductivity (σ) and large thermopower (S); it can be achieved by nanostructuring, band engineering, and heavy element doping. At present available conventional thermoelectric materials are heavy metal-based intermetallic compounds.5 However, the use of the metallic materials is limited due to their low operating temperature, oxidation at atmosphere, environmental issue of heavy element, high toxicity and lower abundance of materials. Owing to many drawbacks in using intermetallic compounds, metal oxide-based thermoelectric materials have gained much attention in recent decades.6,7 Although the metal-oxide based thermoelectric materials possess lower efficiency than intermetallic compound, oxide thermoelectric material has been widely studied due to their attractive properties such as high durability at higher temperature, non-toxic, lower cost and environmentally friendly.8–12 The layered materials and single-crystal oxide materials such as NaCo2O4, CaCo4O9, CaCoO3 and BiSr2O4 with rock salt structures have been extensively studied.13–18 Recent reports on nanostructured cobalt oxide and mixed valence spinel oxide show promising results and opened the path for the current research. Bi substitution in Co3O4 paved a novel way for improving the thermoelectric properties of oxide thermoelectrics19 ZnCo2O4 is the mixed valent ternary metal oxide with cubic structure and it belongs to Fd
![[3 with combining macron]](https://www.rsc.org/images/entities/char_0033_0304.gif) m space group. ZnCo2O4 is a P-type material with the divalent Zn ions at the tetrahedral site and the trivalent Co ions at the octahedral site.20–24 The ZnCo2O4 has been extensively studied for supercapacitor and photocatalytic applications. However, the thermoelectric properties of nanostructured ZnCo2O4 are not reported so far. Therefore in the present work, pure and bismuth substituted ZnCo2O4 (BixZnCo2−xO4 (0 ≤ x ≤ 0.2)) were synthesized and the effect Bi substitution on structural, morphological and thermoelectric properties of ZnCo2O4 were investigated.
m space group. ZnCo2O4 is a P-type material with the divalent Zn ions at the tetrahedral site and the trivalent Co ions at the octahedral site.20–24 The ZnCo2O4 has been extensively studied for supercapacitor and photocatalytic applications. However, the thermoelectric properties of nanostructured ZnCo2O4 are not reported so far. Therefore in the present work, pure and bismuth substituted ZnCo2O4 (BixZnCo2−xO4 (0 ≤ x ≤ 0.2)) were synthesized and the effect Bi substitution on structural, morphological and thermoelectric properties of ZnCo2O4 were investigated.
Experimental
BixZnCo2−xO4 (0 ≤ x ≤ 0.2) nanomaterials with different x values (x = 0, 0.025, 0.05, 0.1, 0.2) are prepared by sol–gel technique. Cobalt acetate, bismuth acetate, zinc acetate, and ethanol were purchased from Sigma Aldrich, India and used as the precursors without further purification. The appropriate ratio of the precursors were taken and stirred in the oil bath at 90 °C for 3 h. The obtained gel was aged and dried in a hot air oven at 150 °C for 12 h. The obtained samples were and annealed in furnace at 400 °C for 2 h. The obtained powder was densified by applying pressure of 200 bar in circular and rectangular shaped dies. The pellets were sintered at 650 °C for 2 h. The prepared pellets are shown in Fig. 1a with the dimension of 1 mm thickness and 16 mm diameter was used for Hall measurements and the rectangular-shaped pellets shown in Fig. 1b with the dimension of 5 mm width, 4 mm thickness, and 16 mm length was used for Seebeck coefficient and thermal conductivity measurements. The silver paste was used as the metallic contact for Hall effect measurements.
 |
| | Fig. 1 Photograph of pellets used for measuring (a) electrical resistivity (b) Seebeck coefficient and the arrow indicate the pressing direction. | |
The structural analysis was carried out using Rigaku miniflex diffractometer, Japan in the 2θ range between 20–80° with Cu-Kα (λ = 1.5406 Å) source. The morphological and elemental mapping analysis was performed using SEM – Tescan Vega, Czech Republic and FE-SEM – Quanta-250FEG, USA, respectively. The temperature stability of the material was analyzed using TG & DTA (EXTAR-6300, Japan). The electrical transport properties of the sample were measured using the Hall effect measurement system, (MMR Technologies, USA) as a function of temperature from 330–550 K under vacuum condition. The Seebeck coefficient of the samples was measured using indigenously fabricated Seebeck measurement instrument as a function of temperature. The thermal conductivity of the samples are measured using thermal conductivity measurement system, (Marine India, India).
Result
Structural analysis of BixZnCo2−xO4 (0 ≤ x ≤ 0.2)
The XRD patterns of BixZnCo2−xO4 (0 ≤ x ≤ 0.2) nanomaterials with different x values are shown in Fig. 2a. The diffraction peaks of ZnCo2O4 nanomaterials are well matched with the JCPDS card no 23-1390 and confirm the formation of cubic structured ZnCo2O4 nanomaterials with Fd![[3 with combining macron]](https://www.rsc.org/images/entities/char_0033_0304.gif) m space group.25,26 The XRD results conforms the formation of pure phase of ZnCo2O4 nanomaterials without any impurity phase in the pure sample. Moreover, the XRD patterns of Bi substitution ZnCo2O4 nanomaterials show the pure phase of ZnCo2O4 until the bismuth substitution of 0.1. When the bismuth substitution increased above 0.1 of x value, secondary phase of Bi2O3 are formed along with ZnCo2O4. The mixed-phase formation of Bi2O3 and ZnCo2O4 at higher Bi substitution (x ≥ 0.2) is due to the low solid solubility limit of bismuth in cobalt oxide lattice. The lattice parameter of ZnCo2O4 is calculated using the formula,
m space group.25,26 The XRD results conforms the formation of pure phase of ZnCo2O4 nanomaterials without any impurity phase in the pure sample. Moreover, the XRD patterns of Bi substitution ZnCo2O4 nanomaterials show the pure phase of ZnCo2O4 until the bismuth substitution of 0.1. When the bismuth substitution increased above 0.1 of x value, secondary phase of Bi2O3 are formed along with ZnCo2O4. The mixed-phase formation of Bi2O3 and ZnCo2O4 at higher Bi substitution (x ≥ 0.2) is due to the low solid solubility limit of bismuth in cobalt oxide lattice. The lattice parameter of ZnCo2O4 is calculated using the formula,  and the variation of lattice parameter with Bi content is shown in Fig. 2c.27 The lattice parameter is calculated for the (311) diffraction plane and the lattice parameter increases gradually with the Bi content and indicates the solid solubility of Bi in ZnCo2O4 lattice as it follows Vegard's law. The inset shows the unit cell diagram of ZnCo2O4 which is drawn using the vesta software. The crystallite sizes of BixZnCo2−xO4 (0 ≤ x ≤ 0.2) samples were calculated using Debye Scherrer equation along (311) plane. Fig. 2d shows the variation of crystallite size of BixZnCo2−xO4 (0 ≤ x ≤ 0.2) samples as the function of Bi substitution. The crystallite size decrease with the Bi substitution as it promotes shape anisotropy and it induce variation in oxygen stoichiometry.27
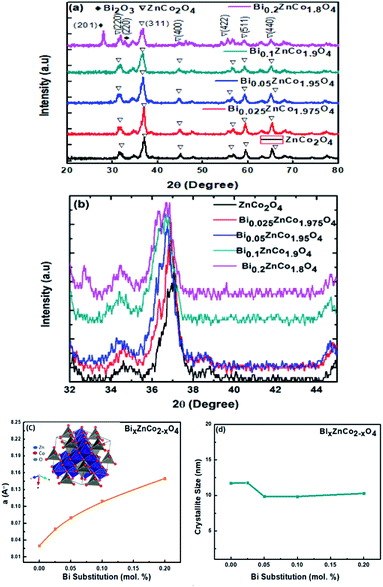 |
| | Fig. 2 (a) XRD patterns of BixZnCo2−xO4 (0 ≤ x ≤ 0.2) nanomaterials with different x values, (b) shifting of XRD peaks at 36.8 degree towards lower angle side, (c) the variation of lattice parameter of BixZnCo2−xO4 (0 ≤ x ≤ 0.2) as a function of Bi content and the inset show unit cell diagram of ZnCo2O4, (d) the crystallite size of BixZnCo2−xO4 (0 ≤ x ≤ 0.2) as a function of Bi substitution. | |
Morphological analysis of BixZnCo2−xO4 (0 ≤ x ≤ 0.2) nanomaterials
FE-SEM images of BixZnCo2−xO4 (0 ≤ x ≤ 0.2) with different x values are shown in Fig. 3. The pure ZnCo2O4 sample exhibits the spherical morphology with a particle size 50 nm. As the Bi substitution increases the morphology of the nanomaterials changes from spherical to flake structures. The sample with high Bi content shows the flake-like morphology. The particles are highly agglomerated due to the heat treatment at the calcination temperature of 400 °C.
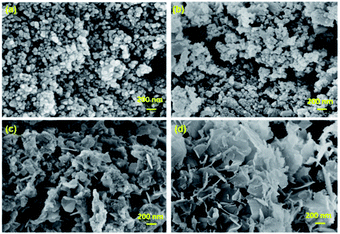 |
| | Fig. 3 FE-SEM images of (a) ZnCo2O4 (b) Bi0.025ZnCo1.975O4 (c) Bi0.1ZnCo1.9O4 (d) Bi0.2ZnCo1.8O4. | |
Fig. 4 shows the morphological analysis of pelletized BixZnCo2−xO4 (0 ≤ x ≤ 0.2) samples. The SEM reveals that the morphology of the particles is not affected by the high-temperature treatment as it exhibits the same morphology of as-synthesized samples, however, the size of the particles is relatively larger due to high-temperature treatment of the pellets.
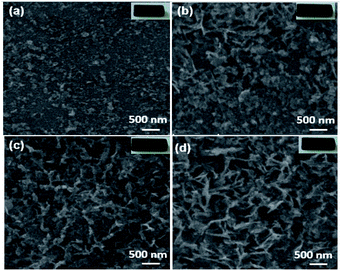 |
| | Fig. 4 SEM images of (a) ZnCo2O4 (b) Bi0.025ZnCo1.975O4 (c) Bi0.1ZnCo1.9O4 (d) Bi0.2ZnCo1.8O4 pellets and the insets show the respective pellets used for the morphological analysis. | |
Elemental analysis of BixZnCo2−xO4 (0 ≤ x ≤ 0.2) nanomaterials
SEM images and the respective elemental mappings of ZnCo2O4, Bi0.1ZnCo1.9O4 and Bi0.2ZnCo1.8O4 pellets are shown in Fig. 5–7 and the measured composition of the samples are shown in Table 1. Homogeneous distribution of Zn, Co, Bi, O are observed in all the samples. The substitution of Bi is clearly observed from Fig. 6 and 7 and the homogeneous distribution of Bi is also clearly evident from the figures. Table 1 clearly indicates that the Bi substitution in the Co site resulted the variation in the Bi and Co content as the Bi composition increased and the Co composition decreased with x values.
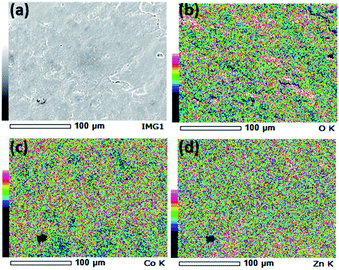 |
| | Fig. 5 (a) SEM image and (b–d) elemental mapping of O, Co, and Zn of ZnCo2O4 nanomaterials. | |
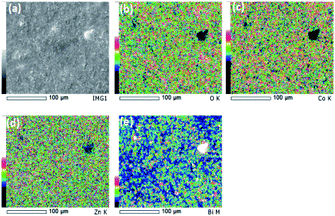 |
| | Fig. 6 (a) SEM image and (b–e) elemental mapping of O, Co, Zn and Bi of Bi0.1ZnCo1.9O4 nanomaterials. | |
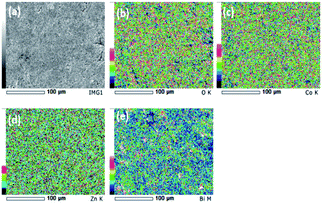 |
| | Fig. 7 (a) SEM image and (b–e) elemental mapping of O, Co, Zn and Bi of Bi0.2ZnCo1.8O4 nanomaterials. | |
Table 1 Composition of Zn, Co, Bi and O of BixZn1−xO4 samples
| Composition of elements (atomic%) |
| Samples |
Zinc |
Cobalt |
Bismuth |
Oxygen |
| ZnCo2O4 |
41.53% |
38.09% |
— |
20.36% |
| Bi0.1ZnCo1.9O4 |
40.07% |
32.52% |
9.04% |
18.30% |
| Bi0.2ZnCo1.8O4 |
39.31% |
26.98% |
18.91% |
14.78% |
Thermal stability analysis of ZnCo2O4 and Bi0.2ZnCo1.8O4
The thermal stability of ZnCo2O4 and Bi0.2ZnCo1.8O4 nanomaterials was studied using TG & DTA analysis and Fig. 8 shows the TG curves of the samples. The pure ZnCo2O4 nanomaterials show relatively low weight loss of 3.6%. The weight of ZnCo2O4 sample decreases gradually till 400 °C which is attributed to dehydration of water and removal of unreacted residuals from the sample. The pure sample is stable till 700 °C as there is no further weight loss. The Bi0.2ZnCo1.8O4 nanomaterials show a higher weight loss of 10% which is more than three times compared to the pure sample. The higher amount of weight loss in Bi0.2ZnCo1.8O4 nanomaterials is observed due to the presence of lattice strain and secondary phase formation. The Bi0.2ZnCo1.8O4 nanomaterials show three stage of weight loss and the first stage of weight loss of 2% was observed till 230 °C weight loss of 2% till 230 °C is attributed to the dehydration of water. The second stage of weight loss of 2% is observed between 230 °C to 350 °C which are due to removal of unreacted residuals. The Bi0.2ZnCo1.8O4 nanomaterials are stable till 600 °C as no weight loss is observed between 350 °C to 600 °C. The major weight loss of 5.5% is observed above 600 °C as the sample loses its stability due to the phase transformation of secondary phases. The ZnCo2O4 and Bi0.2ZnCo1.8O4 nanomaterials were stable till 600 °C (ref. 28) and they can be used for thermoelectric application in the intermediate temperature range.
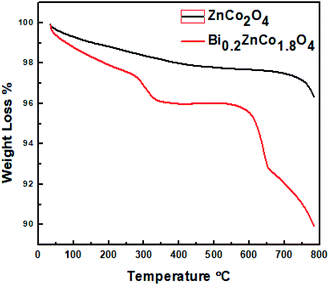 |
| | Fig. 8 Thermal analysis of ZnCo2O4 and Bi0.2ZnCo1.8O4. | |
Electrical transport properties of BixZnCo2−xO4 (0 ≤ x ≤ 0.2) nanomaterials
The variation of electrical resistivity the BixZnCo2−xO4 (0 ≤ x ≤ 0.2) nanomaterials as a function of temperature is shown in Fig. 9. All the samples exhibit semiconducting behavior as the resistivity decreases with increase in temperature. The Bi-free ZnCo2O4 sample exhibit the high resistivity of ρ308 K 2.9 × 10² Ω m at low temperature which is comparable with the report values and decreased (ρ668 K 1.5 × 10⁻¹ Ω m) at high temperature.29 The Bi-free ZnCo2O4 nanomaterials exhibit the high resistivity at all the measured range of temperatures compared to Bi substituted samples. As the Bi content increases the resistivity of the nanomaterials decreased until the x values of ≤0.1. The Bi0.1ZnCo1.9O4 nanomaterials exhibit the low resistivity in all range of temperature compared with the other samples. Bi0.1ZnCo1.9O4 exhibits low-temperature resistivity of 3.1 × 101 Ω m at 308 K and high-temperature resistivity of 4.5 × 10⁻² Ω m at 668 K which is three orders lower than that of Bi-free sample. As the Bi content increases beyond 0.1 of x value the resistivity increased. For example, Bi0.2ZnCo1.8O4 nanomaterials exhibit the low-temperature resistivity of 9.3 Ω m at 308 K and high-temperature resistivity of 7.9 × 10⁻² Ω m at 668 K. The higher resistivity of the sample with high Bi content (x = 0.2) is possibly due to the formation of secondary phase of Bi2O3 as evident from XRD (Fig. 2a). Fig. 10 shows the carrier concentration of the samples as a function of Bi content at 330 K. The pure sample shows the carrier concentration of 8.6 × 1015 cm−3 and the carrier concentration of the samples increased till the x = 0.1 (1.2 × 1016 cm−3) and slightly decreased (1.1 × 1016 cm−3) for the sample with x = 0.2. The substitution of heterovalent Bi3+ at the Co site increases the carrier concentration due to charge compensation and the slight drop in the carrier density is possibly due to localization of charge carriers in the nanostructured samples.30
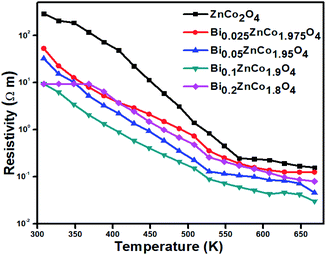 |
| | Fig. 9 Electrical resistivity of BixZnCo2−xO4 (0 ≤ x ≤ 0.2) as a function of temperature. | |
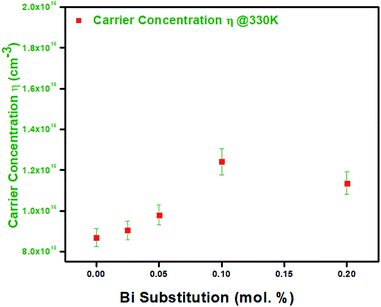 |
| | Fig. 10 Carrier concentration of BixZnCo2−xO4 (0 ≤ x ≤ 0.2) at 330 K as a function of Bi content. | |
Seebeck coefficient of BixZnCo2−xO4 (0 ≤ x ≤ 0.2) nanomaterials
The Seebeck coefficient value of BixZnCo2−xO4 (0 ≤ x ≤ 0.2) nanomaterials with the function of temperature is shown in Fig. 11. The positive values of measured Seebeck coefficient indicate the P-type nature of the prepared materials. The Bi-free ZnCo2O4 sample shows the high Seebeck coefficient compared with the Bi substituted samples. The pure sample shows the low-temperature Seebeck coefficient of (α328 K) 50 μV K−1 and the high-temperature Seebeck coefficient of (α668 K) 392 μV K−1. The Seebeck coefficient value of BixZnCo2−xO4 (0 ≤ x ≤ 0.2) gradually decreases with the Bi substitution until the x value of 0.1. Typically Bi0.1ZnCo1.9O4 sample shows the high-temperature Seebeck coefficient of (α668 K) 221 μV K−1 and it exhibits the Seebeck coefficient (α328 K) of 94 μV K−1 at low temperature. The Seebeck coefficient of Bi0.2ZnCo1.8O4 slightly increased for all the temperatures compared to Bi0.1ZnCo1.9O4 due to the high resistivity resulted from secondary phase formation.
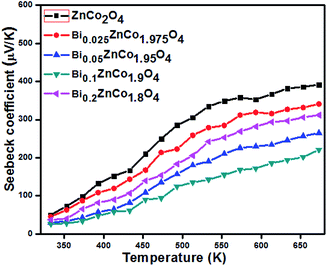 |
| | Fig. 11 Seebeck coefficients of BixZnCo2−xO4 (0 ≤ x ≤ 0.2) samples as a function of temperature. | |
Power factor of BixZnCo2−xO4 (0 ≤ x ≤ 0.2) nanomaterials
The power factors of the samples are calculated from the Seebeck coefficient and electrical resistivity. The variations of the power factor of the samples with temperature are shown in Fig. 12a. As shown in Fig. 11a, the power factor of the samples increased with temperature. The power factor (α2σ668 K) of pure sample is relatively low (0.9 × 10⁻⁵ μW K−2 m−1) and increased with increasing Bi content until the x value of 0.1. For instance, at 668 K, the Bi0.1ZnCo1.9O4 sample exhibits the power factor of 2.3 μW K−2 m−1 which is relatively higher than that of other samples. At the same temperature, the power factor is slightly decreased to 1 μW K−2 m−1 for the sample with higher Bi content (Bi0.2ZnCo1.8O4). The monotonic linear increase in power factor is due to decrease in resistivity (ρ). However, the power factor decreased for Bi0.2ZnCo1.8O4 due to the secondary phase formation of Bi2O3. The obtained power factor (2.3 μW K−2 m−1) of Bi0.1ZnCo1.9O4 is relatively higher than that of Bi substituted Co3O4 and other reported values.19,31,32
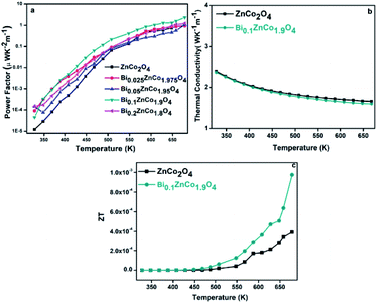 |
| | Fig. 12 (a) Power factor of BixZnCo2−xO4 (0 ≤ x ≤ 0.2) samples (b) thermal conductivity of pure and Bi0.1ZnCo1.9O4 samples and (c) ZT of pure and Bi0.1ZnCo1.9O4 samples as a function of temperature. | |
The temperature dependent thermal conductivity of pure and Bi0.1ZnCo1.9O4 are shown in Fig. 11b. As can be seen from Fig. 12b, the thermal conductivity of Bi0.1ZnCo1.9O4 is relatively low especially at high temperatures possibly due to sheet like structures as observed in the FE-SEM images (Fig. 3) which may enhanced the phonon scattering. The pure ZnCo2O4 and Bi0.1ZnCo1.9O4 shows the total thermal conductivity of 2.42 and 2.39 W K−1 m−1 at 308 K and the thermal conductivity of the sample decreases to 1.67 and 1.59 W K−1 m−1 respectively, at 668 K. The figure of merit, ZT was calculated from the obtained resistivity, Seebeck coefficient and thermal conductivity. The ZT of pure ZnCo2O4 and Bi0.1ZnCo1.9O4 samples as a function of temperature is shown in Fig. 12c. The Bi0.1ZnCo1.9O4 sample shows the high ZT of 9.5 × 10⁻⁴ at 668 K. The experimental results demonstrate that substitution of Bi up to 0.1 value of x is beneficial for the improving the thermoelectric properties of ZnCo2O4 nanomaterials.
Discussion
As shown in XRD (Fig. 2a) pure phase of ZnCo2O4 was formed till the x value of 0.1 and the mixed phase of ZnCo2O4 and Bi2O3 were formed in the samples with higher Bi content (x = 0.2). The excess phase of Bi2O3 was formed due to the high Bi content which exceeds the solid solubility limit of Bi in ZnCo2O4 lattice. The Bi rich precipitates were clearly observed in the EDX mapping of the samples with higher Bi content (Fig. 6). The electrical resistivity of the samples decreased with Bi content up to the x values of 0.1 and the resistivity of the samples with high Bi content (x = 0.2) increased. The decrease in resistivity of BixZnCo2−xO4 is mainly attributed due to the mixed valence state of Bi and Co. The increase in resistivity at the higher Bi substitution are probably due to the formation of secondary phase of Bi2O3. The secondary phase creates the interfaces between two different materials, probably the carriers may trap at the interfaces, which in turn increases the resistivity. The low Seebeck coefficient values of BixZnCo2−xO4 (x < 0.2) were mainly due to low electrical resistivity of the samples. The relatively high Seebeck coefficient of sample with high Bi content (x = 0.2) is attributed due to high electrical resistivity of the sample. Furthermore, it is noteworthy that the high Seebeck coefficient of Bi0.2ZnCo1.8O4 is originated from the energy filtering effect, as the Seebeck coefficient increased by the presence of potential barrier of secondary phase which eradicates low energy carriers.33,34 The variation in thermal conductivity of the samples is very narrow and the Bi substituted sample shows the relatively low thermal conductivity due to variation in the morphology from spherical to flake like structures. The Bi0.2ZnCo1.8O4 may have the lower thermal conductivity compared with the other samples due to scattering of phonons at the interfaces of different phases of materials.35–38 The ZT of Bi0.1ZnCo1.9O4 samples are relatively higher than that of Bi free sample and the high ZT is mainly due to high power factor. The experimental results revealed that the Bi substitution in ZnCo2O4 has the beneficial effect and it is further expected to increase by optimizing the composition and nanostructuring.
Conclusion
BixZnCo2−xO4 (0 ≤ x ≤ 0.2) nanomaterials have been synthesized by the sol–gel method. XRD analysis confirms that Bi is completely dissolved in the ZnCo2O4 till the x value of ≤0.1 and the secondary phase of Bi2O3 is formed at higher x value (x ≤ 0.2). The thermal analysis reveals that the synthesized nanomaterials are stable between 400–600 °C and it can be used for intermediate temperature applications. The electrical resistivity of the nanomaterials increased till the x value of 0.1 and then the electrical resistivity decreased in the sample with higher Bi content (x = 0.2) due to secondary phase formation. The Seebeck coefficient of the sample decreased monotonically with the electrical resistivity till the Bi substitution of x = 0.1. The Bi0.1ZnCo1.9O4 shows high power factor of α2σ668 K – 2.3 μW K−2 m−1 due to low resistivity of (ρ668 K) 3 × 10⁻² Ω m, and it shows the high figure of merit of 9.5 × 10⁻⁴ which is relatively higher than the reported values for similar oxide materials. The experimental results show significant improvement in the thermoelectric power factor of BixZnCo2−xO4 (0 ≤ x ≤ 0.2) nanomaterials and it can be effectively used for intermediate waste heat harvesting.
Conflicts of interest
There is no conflict of interest to declare.
Acknowledgements
The work was financially supported by Department of Science and Technology (DST)-SERB, India under Early Career Research (ECR) award (ECR/2015/000575) and Extra Mural Research (EMR) funding (EMR/2016/007203). The author (A. S. Alagar Nedunchezhian) thanks DST-SERB for Junior Research Fellowship (2016–2019). The work is partially supported by Tohoku University, Japan under GIMRT collaborative project (19K0512).
References
- G. J. Snyder and E. S. Toberer, Nat. Mater., 2008, 7, 105–114 CrossRef CAS PubMed.
- I. Terasaki, Y. Sasago and K. Uchinokura, Phys. Rev. B: Condens. Matter Mater. Phys., 1997, 56, R12685–R12687 CrossRef CAS.
- T. M. Tritt and M. Subramanian, MRS Bull., 2006, 31, 188–198 CrossRef.
- Fitriani, R. Ovik, B. D. Long, M. C. Barma, M. Riaz, M. F. M. Sabri, S. M. Said and R. Saidur, Renewable Sustainable Energy Rev., 2016, 64, 635–659 CrossRef CAS.
- D. Sidharth, A. S. Alagar Nedunchezhia, R. Rajkumar, N. Yalini Devi, P. Rajasekaran, M. Arivanandhan, K. Fujiwara, G. Anbalagan and R. Jayavel, Phys. Chem. Chem. Phys., 2019, 21, 15725–15733 RSC.
- K. Koumoto, Y. Wang, R. Zhang, A. Kosuga and R. Funahashi, Annu. Rev. Mater. Res., 2010, 40, 363–394 CrossRef CAS.
- J. W. Fergus, J. Eur. Ceram. Soc., 2012, 32, 525–540 CrossRef CAS.
- M. Ohtaki, J. Ceram. Soc. Jpn., 2011, 119, 770–775 CrossRef CAS.
- J. F. Li, W. S. Liu, L. D. Zhao and M. Zhou, NPG Asia Mater., 2010, 2, 152–158 CrossRef.
- D. J. Hagen, T. S. Tripathi and M. Karppinen, Dalton Trans., 2017, 46, 4796–4805 RSC.
- H. Alam and S. Ramakrishna, Nano Energy, 2013, 2, 190–212 CrossRef CAS.
- J. He, Y. Liu and R. Funahashi, J. Mater. Res., 2011, 26, 1762–1772 CrossRef CAS.
- M. Saxena and T. Maiti, Dalton Trans., 2017, 46, 5872–5879 RSC.
- W. Koshibae, K. Tsutsui and S. Maekawa, Phys. Rev. B: Condens. Matter Mater. Phys., 2000, 62, 6869–6872 CrossRef CAS.
- M. Karppinen, H. Fjellvag, T. Konno, Y. Morita, T. Motohashi and H. Yamauchi, Chem. Mater., 2004, 16, 2790–2793 CrossRef CAS.
- I. Terasaki, M. Iwakawa, T. Nakano, A. Tsukudaa and W. KobayashiLu, Dalton Trans., 2010, 39, 1005–1011 RSC.
- M. Ito and D. Furumoto, J. Alloys Compd., 2008, 450, 517–520 CrossRef CAS.
- S. R. Hostlera, Y. Qiao Qu, M. T. Demkoa, A. R. Abramsona, X. Qiub and C. Burdab, Superlattices Microstruct., 2008, 43, 195–207 CrossRef.
- A. S. Alagar Nedunchezhian, D. Sidharth, N. Yalini Devi, R. Rajkumar, P. Rajasekaran, M. Arivanandhan, G. Anbalagan and R. Jayavel, Ceram. Int., 2019, 45, 6782–6787 CrossRef CAS.
- S. Ratha, R. T. Khare, A. M. Mahendra, R. Tapa, J. L. Dattatray and C. Sekhar Rout, RSC Adv., 2015, 5, 5372–5378 RSC.
- L. Hu, A. Harley-Trochimczyk, S. Cheng, H. Hu, S. C. Won, A. Rao, C. Carroro, T. Shi, Z. Tang and R. Maboudian, ACS Appl. Mater. Interfaces, 2016, 8, 31764–31771 CrossRef PubMed.
- M. Priya, V. K. Premkumar, P. Vasantharani and G. Sivakumar, Vacuum, 2019, 167, 307–312 CrossRef CAS.
- M. Peiteado, C. C. Amador and D. Makovec, J. Ceram. Soc. Jpn., 2010, 118, 337–340 CrossRef CAS.
- X. Han, L. Fan, Y. Zhang, X. Han, C. Xu and H. Chen, J. Alloys Compd., 2019, 781, 425–432 CrossRef CAS.
- Y. Gai, Y. Shang, L. Gong, L. Su, H. Long, F. Dong and J. Li, RSC Adv., 2017, 7, 1038–1044 RSC.
- Y. Pan, W. Zeng, L. Lin, Y. Zhang, Y. Dong, D. Cao, G. Wang, L. L. Brett, K. Ye and K. Cheng, Nano-Micro Lett., 2017, 9, 1–9 CrossRef CAS PubMed.
- A. V. G. Chizmeshya, M. R. Bauer and J. Kouvetakis, Chem. Mater., 2003, 15, 2511–2519 CrossRef CAS.
- J. Li, J. Wang, D. Wexler, D. Shi, J. Liang, H. Liu, S. Xiong and Y. Qian, J. Mater. Chem. A, 2013, 1, 15292–15299 RSC.
- S. H. Kim, J. A. Cianfrone, P. Sadik, K. W. Kim and M. Ivill, J. Appl. Phys., 2010, 107, 10353 Search PubMed.
- D. Narducci, E. Selezneva, G. Cerofolini, S. Frabboni and G. Ottaviani, J. Solid State Chem., 2012, 193, 19–25 CrossRef CAS.
- E. M. Jakubczyk, A. Mapp, C. C. Chung, C. L. Sansom, J. Jones and R. A. Dorey, J. Alloys Compd., 2019, 788, 91–101 CrossRef CAS.
- Y. Fujishiro, K. Hamamoto, O. Shiono, S. Katayama and M. Awano, J. Mater. Sci.: Mater. Electron., 2004, 15, 769–773 CrossRef CAS.
- Y. Kinemuchi, M. Mikami, K. Kobayashi, K. Watari and Y. Hotta, J. Electron. Mater., 2009, 39, 2059 CrossRef.
- T. Ishibe, A. Tomeda, K. Watanabe, Y. Kamakura, N. Mori, N. Naruse, Y. Mera, Y. Yamashita and Y. Nakamura, ACS Appl. Mater. Interfaces, 2018, 10, 37709 CrossRef CAS PubMed.
- W.-Y. Lee, J.-H. Lee, J.-Y. Ahn, T.-H. Park, N.-W. Park, G.-S. Kim, J.-S. Park and S.-K. Lee, Nanotechnology, 2017, 28, 105401 CrossRef PubMed.
- Y. Nakamura, M. Isogawa, T. Ueda, S. Yamasaka, H. Matsui, J. Kikkawa, S. Ikeuchi, T. Oyake, T. Hori, J. Shiomi and A. Sakai, Nano Energy, 2015, 12, 845–851 CrossRef CAS.
- D. Cederkrantz, N. Farahi, K. A. Borup, B. B. Iversen, M. Nygren and A. E. C. Palmqvist, J. Appl. Phys., 2012, 111, 023701 CrossRef.
- M. Ohtaki, K. Araki and K. Yamamoto, J. Electron. Mater., 2009, 38, 1234–1238 CrossRef CAS.
|
| This journal is © The Royal Society of Chemistry 2020 |
Click here to see how this site uses Cookies. View our privacy policy here.  Open Access Article
 *a,
K. Fujiwarac,
G. Anbalaganb and
R. Jayavel
 a
a
 , where S is Seebeck coefficient, σ is electrical conductivity, k is thermal conductivity, and T is temperature. To obtain high thermoelectric performance the material should possess low thermal conductivity (k), high electrical conductivity (σ) and large thermopower (S); it can be achieved by nanostructuring, band engineering, and heavy element doping. At present available conventional thermoelectric materials are heavy metal-based intermetallic compounds.5 However, the use of the metallic materials is limited due to their low operating temperature, oxidation at atmosphere, environmental issue of heavy element, high toxicity and lower abundance of materials. Owing to many drawbacks in using intermetallic compounds, metal oxide-based thermoelectric materials have gained much attention in recent decades.6,7 Although the metal-oxide based thermoelectric materials possess lower efficiency than intermetallic compound, oxide thermoelectric material has been widely studied due to their attractive properties such as high durability at higher temperature, non-toxic, lower cost and environmentally friendly.8–12 The layered materials and single-crystal oxide materials such as NaCo2O4, CaCo4O9, CaCoO3 and BiSr2O4 with rock salt structures have been extensively studied.13–18 Recent reports on nanostructured cobalt oxide and mixed valence spinel oxide show promising results and opened the path for the current research. Bi substitution in Co3O4 paved a novel way for improving the thermoelectric properties of oxide thermoelectrics19 ZnCo2O4 is the mixed valent ternary metal oxide with cubic structure and it belongs to Fd
![[3 with combining macron]](https://www.rsc.org/images/entities/char_0033_0304.gif) m space group. ZnCo2O4 is a P-type material with the divalent Zn ions at the tetrahedral site and the trivalent Co ions at the octahedral site.20–24 The ZnCo2O4 has been extensively studied for supercapacitor and photocatalytic applications. However, the thermoelectric properties of nanostructured ZnCo2O4 are not reported so far. Therefore in the present work, pure and bismuth substituted ZnCo2O4 (BixZnCo2−xO4 (0 ≤ x ≤ 0.2)) were synthesized and the effect Bi substitution on structural, morphological and thermoelectric properties of ZnCo2O4 were investigated.
m space group. ZnCo2O4 is a P-type material with the divalent Zn ions at the tetrahedral site and the trivalent Co ions at the octahedral site.20–24 The ZnCo2O4 has been extensively studied for supercapacitor and photocatalytic applications. However, the thermoelectric properties of nanostructured ZnCo2O4 are not reported so far. Therefore in the present work, pure and bismuth substituted ZnCo2O4 (BixZnCo2−xO4 (0 ≤ x ≤ 0.2)) were synthesized and the effect Bi substitution on structural, morphological and thermoelectric properties of ZnCo2O4 were investigated.

![[3 with combining macron]](https://www.rsc.org/images/entities/char_0033_0304.gif) m space group.25,26 The XRD results conforms the formation of pure phase of ZnCo2O4 nanomaterials without any impurity phase in the pure sample. Moreover, the XRD patterns of Bi substitution ZnCo2O4 nanomaterials show the pure phase of ZnCo2O4 until the bismuth substitution of 0.1. When the bismuth substitution increased above 0.1 of x value, secondary phase of Bi2O3 are formed along with ZnCo2O4. The mixed-phase formation of Bi2O3 and ZnCo2O4 at higher Bi substitution (x ≥ 0.2) is due to the low solid solubility limit of bismuth in cobalt oxide lattice. The lattice parameter of ZnCo2O4 is calculated using the formula,
m space group.25,26 The XRD results conforms the formation of pure phase of ZnCo2O4 nanomaterials without any impurity phase in the pure sample. Moreover, the XRD patterns of Bi substitution ZnCo2O4 nanomaterials show the pure phase of ZnCo2O4 until the bismuth substitution of 0.1. When the bismuth substitution increased above 0.1 of x value, secondary phase of Bi2O3 are formed along with ZnCo2O4. The mixed-phase formation of Bi2O3 and ZnCo2O4 at higher Bi substitution (x ≥ 0.2) is due to the low solid solubility limit of bismuth in cobalt oxide lattice. The lattice parameter of ZnCo2O4 is calculated using the formula,  and the variation of lattice parameter with Bi content is shown in Fig. 2c.27 The lattice parameter is calculated for the (311) diffraction plane and the lattice parameter increases gradually with the Bi content and indicates the solid solubility of Bi in ZnCo2O4 lattice as it follows Vegard's law. The inset shows the unit cell diagram of ZnCo2O4 which is drawn using the vesta software. The crystallite sizes of BixZnCo2−xO4 (0 ≤ x ≤ 0.2) samples were calculated using Debye Scherrer equation along (311) plane. Fig. 2d shows the variation of crystallite size of BixZnCo2−xO4 (0 ≤ x ≤ 0.2) samples as the function of Bi substitution. The crystallite size decrease with the Bi substitution as it promotes shape anisotropy and it induce variation in oxygen stoichiometry.27


