 Open Access Article
Synthesis of polyacrylonitrile nanoflowers and their controlled pH-sensitive drug release behavior†
Qi Liana,
Han Liua,
Xuefang Zheng *ab,
Dandan Jiaa,
Chun Liua and
Dongjun Wangac
aCollege of Chemical Engineering, Hebei Normal University of Science and Technology, No. 360, West Section of Hebei Street, Qinhuangdao 066004, P. R. China. E-mail: xuefang-zheng@163.com; Tel: +86-1507609704
bSchool of Chemical Engineering and Technology, Hebei University of Technology, Tianjin 300130, P. R. China
cAnalysis and Testing Center, Hebei Normal University of Science and Technology, No. 360, West Section of Hebei Street, Qinhuangdao 066004, P. R. China
First published on 21st April 2020
Abstract
A novel controlled drug release system based on pH sensitive polyacrylonitrile (PAN) nanoflowers in different kinds of solvents was successfully prepared with azobisisobutyronitrile (AIBN) as the initiator and without any emulsifier or stabilizer by a one step static polymerization method. The composition and structure of the PAN nanoflowers were analyzed by FTIR, XRD, SEM, TEM, and laser particle size analysis. The polymer particles consisted of a number of lamellae, with a sheet thickness of about 10 nm, and were similar to the shape of flowers with a particle diameter of about 350 nm. The mechanism of the polymerization reaction and the formation were studied. Moreover, the effects of monomer ratio, initiator concentration, reaction time, dispersion medium and co-monomer on the morphology and particle size of the nanoflowers were also discussed. A relatively large specific surface area was formed during the formation of the nanoflowers, which favored drug adsorption. The results of the in vitro experiments revealed that PAN(TBP) nanoflowers, containing BSA in buffer solution of pH 7.4, demonstrated good sustained-release and the cumulative release rate was about 83% after 260 h. The results also showed that the sustained-release from the PAN(TBP) nanoflowers best fitted the Riger-Peppas model. This study indicated that PAN(TBP) nanoflowers provided a theoretical base for the development of carriers for sustainable drug-release.
1. Introduction
Ulcerative colitis (UC) is due to inflammation caused by chronic recurrent disease. The lesion is mainly located in the colon mucosa, characterized by ulcers.1–5 In the treatment of UC, when administered orally, the drug may be absorbed by the blood in advance and reduce the concentration of the drug in the colon, which will weaken the therapeutic effect and cause side effects.6–8Responsive drug delivery systems have become topical in today's drug delivery technology. In the variety of response release systems, pH response systems have attracted a lot of attention.9–13 Recently, more and more attention has been paid to the oral colon-specific drug delivery system (OCDDS), which can improve bioavailability and reduce the side effects of drugs. Drugs can be sent to the lesion site, in order to increase the drug targeted therapy. So far, pH-sensitive systems have many different dosage forms, such as sustained release tablets,14 micelles,15 microparticles16,17 and nanoparticles.18–20 Because of the large surface area and the high drug loading rate, the nanoparticles are one of the prospective dosage forms.
Nanoparticles have many advantages, including oral convenience, predictable and reproducible transport times in gastrointestinal tract (GIT), less food effects, less local irritation and side effects, stable drug absorption and so on.21–24 Previous studies have shown that nanoparticles with a particle size of 10–300 μm exhibit good targeting properties in oral administration of GIT inflammation sites. Thus, nanoparticles have been demonstrated to be a promising targeted drug delivery system for the treatment of UC.
However, the larger the particle sizes of the nanoparticles, the smaller the specific surface area, which resulted in a decrease in the drug loading rate. When the size of the nanoparticles is too small, the nanoparticles are easy to aggregate and affected the normal transport in GIT. Therefore, it has become important to develop drug carriers with large drug loading and does not aggregate.
In this work, a new kind of carrier with polyacrylonitrile (PAN) nanoflowers in different kinds of solvents was successfully prepared with azobisisobutyronitrile (AIBN) as the initiator and without any emulsifier or stabilizer with static polymerization by one step method. PAN nanoflowers, with the size of 300–500 nm, are dispersed uniformly and not reunion. The specific surface area and the drug loading rate are larger than that of nanoparticles. This phenomenon can be explained by that between the petals of the PAN nanoflowers can load more drug molecules, resulting in the increase of the drug loading amount. What is more, the size of the PAN nanoflowers is smaller than that of nanoparticles with a particle size of 10–300 μm, which makes the PAN nanoflowers easier to transport in the gastrointestinal tract. Thus, the PAN nanoflowers are expected to be the carrier material for drug release.
Based on the above study, PAN nanoflowers combine pH-sensitivity for targeting the inflamed tissue in colon could be promising method for UC treatment. A novel controlled drug release system based on pH sensitive is developed with the PAN nanoflowers as drug carrier and bovine serum albumin (BSA) as model drug. PAN nanoflowers loaded with BSA can transport the drug to release at targeting site of colon, which was because that there are a lot of hydrogen bonds between pH sensitive nanoflowers and drug molecules. When administered orally, pH sensitive nanoflowers can protect against premature release of the drug in the stomach payload. After the drug is transferred to the colonic site, the pH sensitive nanoflowers will expand in a higher pH environment, and the pores and petals will become larger, leading to rapid drug release (Scheme 1). Thus, pH-sensitive nanoflowers can be used as drug carrier for the treatment of UC to prevent premature absorption of the drug and to reduce systemic toxicity.
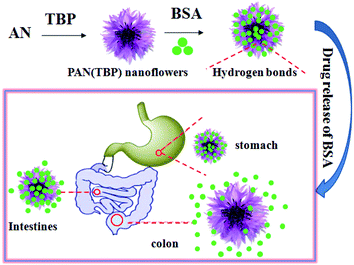 | ||
| Scheme 1 The schematic preparation of new kind of pH-sensitive PAN nanoflowers and its potential application for UC therapy. | ||
2. Materials and methods
2.1. Materials
Acrylonitrile (AN), azobis(isobutyronitrile) (AIBN), and tributyl phosphate (TBP), styrene (St) were purchased from Beijing Chemical Co. in reagent grade. BSA was provided by Shanghai Guoyao Chemical Reagent Co. Ltd. (Shanghai, China). All other reagents were of analytic reagent grade. All chemicals and solvents were used as received without further purification. Double distilled water was used throughout the experiments.2.2. Preparation of PAN nanoflowers
The PAN nanoflowers were prepared using a novel method, which was under static condition by one step. 2 ml acrylonitrile (AN), 0.002 g initiator azobis(isobutyronitrile) (AIBN), 6 ml tributyl phosphate (TBP) were mixed in the test tube. After shaking 5 minutes thoroughly, the mixed solution was continuously sonicated in the water bath for 30 min at 40 °C to get a homogeneous solution. Then, the mixed solution was left standing in the water bath for 2 hours at 70 degrees statically (without stirring), and white emulsion was obtained with the PAN nanoflowers homogeneously dispersed in TBP. Finally, the PAN nanoflowers were collected by centrifugation at 14![[thin space (1/6-em)]](https://www.rsc.org/images/entities/char_2009.gif) 000 rpm for 25 min and the residual TBP was removed by three consecutive washing/centrifugation cycles with ethanol and water.
000 rpm for 25 min and the residual TBP was removed by three consecutive washing/centrifugation cycles with ethanol and water.
2.3. Mathematical model fitting of drug release nanoparticles
According to the dug release ratio of drug-loaded nano-flowers, the following mathematical models were used to fit the drug release behavior of drug-loaded nano-flowers: (1) zero-order release model: Q = a + bt; (2) fist-order release model: ln(1 − Q) = a + bt; (3) Higuchi model: Q = a + bt1/2; (4) Riger-Peppas model: ln![[thin space (1/6-em)]](https://www.rsc.org/images/entities/char_2009.gif) Q = a + b
Q = a + b![[thin space (1/6-em)]](https://www.rsc.org/images/entities/char_2009.gif) ln
ln![[thin space (1/6-em)]](https://www.rsc.org/images/entities/char_2009.gif) t. where Q is the drug release (%), t is the time of drug release. All the experiments were conducted in triplicate.
t. where Q is the drug release (%), t is the time of drug release. All the experiments were conducted in triplicate.
3. Results and discussion
3.1. Structural characterization and morphology analysis of polymers
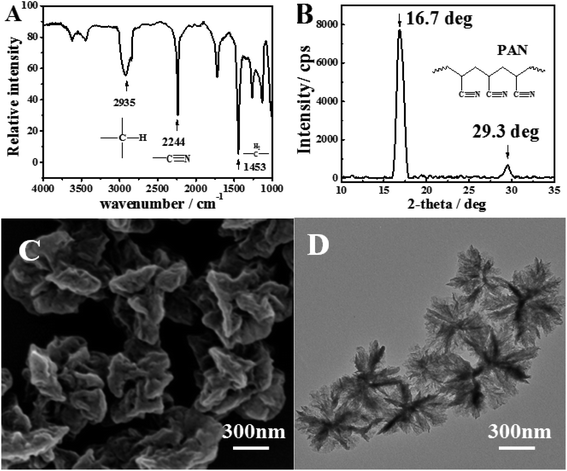
Fig. 1A shows the FTIR spectra of PAN. The strong peak at 2935 cm−1 was attributed to the symmetric and asymmetric vibration peaks of –C–H in methyl and methylene groups. The sharp absorption peaks of PAN at 2244 cm−1 was assigned to the stretching vibration peak of –C![[triple bond, length as m-dash]](https://www.rsc.org/images/entities/char_e002.gif) N in saturated aliphatic nitrile, which is the characteristic absorption peak of PAN. The peak at 1453 cm−1 was attributed to the plane scissors vibration peak of –CH2–.
N in saturated aliphatic nitrile, which is the characteristic absorption peak of PAN. The peak at 1453 cm−1 was attributed to the plane scissors vibration peak of –CH2–.
To confirm the crystallinity of PAN, the sample was characterized by XRD measurement. Fig. 1B showed the spectra of PAN nanoflowers (XRD). The crystalline peaks (2θ) at 16.7° and 29.3° were attributed to PAN, which are typical fingerprint for PAN and very similar to the work of Han, Tang, and Lior.25 The crystallinity of the PAN nanoflowers was calculated to be 45% by the integration of XRD peak shapes, which was higher than that obtained by other methods.26
Scanning electron microscope (SEM) and transmission electron microscope (TEM) were employed to characterize the morphology of as-prepared sample under the static condition (Fig. 1C and D). It is clearly revealed that all the PAN nanoflowers are fairly uniform in size and shape. The surface of the prepared polymer particles was irregular and like peony flowers, which consisted of a number of lamellar structures. The thickness of lamellae is about 10 nm. This phenomenon can be explained from the microstructure model of PAN. The cyano group and the alpha-hydrogen atom in the PAN molecular chains could form hydrogen bonds which could attract each other. Due to the hydrogen bonds, the PAN molecular chains could be arranged in a neat sheet structure. After reached the critical chain length, the molecular chains would be precipitated out of the dispersion medium in the form of lamellar crystals, which would be gathered to form the polymer particles. Then polymer particles were grown in main two ways. Firstly, the lamellar crystals which were precipitated from a dispersion medium were deposited on the surface of polymer particles and grown slowly, resulting in an increasing number of layered crystals. As can be seen from Fig. 1D, the color of the polymer particles in the middle is dark than the outer, which could be explained by that the concentration of the lamellae was bigger than that of outer. And the outer color is lighter which indicated that the new precipitated lamellae were deposited in the gap between the lamellae, leading to the low layered crystals concentration and the lighter color of the edge. Secondly, oligomers and monomers in the dispersion medium were continued to precipitate onto the lamellar crystals, increasing the size of the crystallites and the polymer particles.
3.2. Effect of reaction conditions on PAN nanoflowers morphology
![[thin space (1/6-em)]](https://www.rsc.org/images/entities/char_2009.gif) :
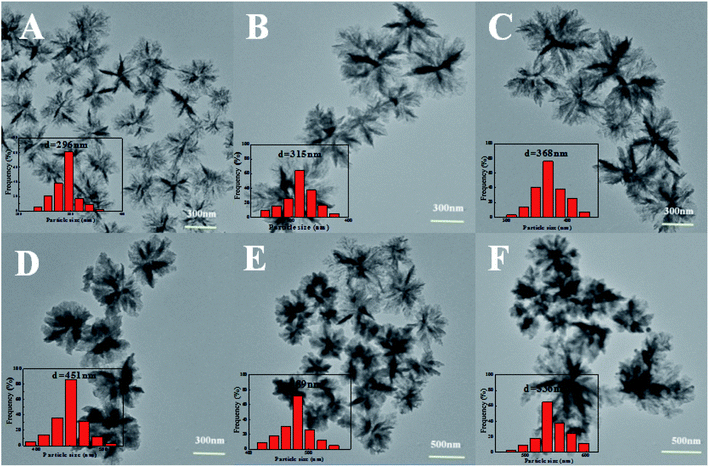
:![[thin space (1/6-em)]](https://www.rsc.org/images/entities/char_2009.gif) 6, the average particle size was about 296 nm (Fig. 2A). When the volume ratio of AN/TBP was increased from 1
6, the average particle size was about 296 nm (Fig. 2A). When the volume ratio of AN/TBP was increased from 1![[thin space (1/6-em)]](https://www.rsc.org/images/entities/char_2009.gif) :
:![[thin space (1/6-em)]](https://www.rsc.org/images/entities/char_2009.gif) 5 to 1
5 to 1![[thin space (1/6-em)]](https://www.rsc.org/images/entities/char_2009.gif) :
:![[thin space (1/6-em)]](https://www.rsc.org/images/entities/char_2009.gif) 4, the average particle size was further increased from 315 nm to 368 nm (Fig. 2B and C). When a small amount of AN was fed together with TBP (AN/TBP = 1
4, the average particle size was further increased from 315 nm to 368 nm (Fig. 2B and C). When a small amount of AN was fed together with TBP (AN/TBP = 1![[thin space (1/6-em)]](https://www.rsc.org/images/entities/char_2009.gif) :
:![[thin space (1/6-em)]](https://www.rsc.org/images/entities/char_2009.gif) 3), the average particle size became 451 nm, which the particle size was relatively regular with good dispersion (Fig. 2D). Further increasing the volume ratio of AN/TBP to 1
3), the average particle size became 451 nm, which the particle size was relatively regular with good dispersion (Fig. 2D). Further increasing the volume ratio of AN/TBP to 1![[thin space (1/6-em)]](https://www.rsc.org/images/entities/char_2009.gif) :
:![[thin space (1/6-em)]](https://www.rsc.org/images/entities/char_2009.gif) 2 or 1
2 or 1![[thin space (1/6-em)]](https://www.rsc.org/images/entities/char_2009.gif) :
:![[thin space (1/6-em)]](https://www.rsc.org/images/entities/char_2009.gif) 1, the average particle size was increased to 482 nm or 536 nm with single dispersion. This phenomenon could be explained as follows: with the increase of the concentration of AN, the oligomers and lamellae were increased, which were accumulated together to form polymer primary particles and continue to precipitate on the primary particles, which increased the numbers of layers. Therefore, the central part of the nanoparticles is darker than the edge in Fig. 2.
1, the average particle size was increased to 482 nm or 536 nm with single dispersion. This phenomenon could be explained as follows: with the increase of the concentration of AN, the oligomers and lamellae were increased, which were accumulated together to form polymer primary particles and continue to precipitate on the primary particles, which increased the numbers of layers. Therefore, the central part of the nanoparticles is darker than the edge in Fig. 2.
![[thin space (1/6-em)]](https://www.rsc.org/images/entities/char_2009.gif) :
:![[thin space (1/6-em)]](https://www.rsc.org/images/entities/char_2009.gif) 3. The concentration of AN was 1 mg ml−1 (1 ml AN containing 1 mg AIBN), and reaction temperature was 70 °C. The size and distribution of the nanoflowers were measured at regular intervals (0.5 h, 1 h, 2 h, 4 h, 6 h, 8 h, 10 h, 12 h, 14 h) in Table 1.
3. The concentration of AN was 1 mg ml−1 (1 ml AN containing 1 mg AIBN), and reaction temperature was 70 °C. The size and distribution of the nanoflowers were measured at regular intervals (0.5 h, 1 h, 2 h, 4 h, 6 h, 8 h, 10 h, 12 h, 14 h) in Table 1.
| No. | Reaction time (h) | d(−) (nm) | Polydispersity index (%) |
|---|---|---|---|
| 1 | 0.5 | 232.3 | 0.24 |
| 2 | 1 | 295.5 | 0.23 |
| 3 | 2 | 328.6 | 0.25 |
| 4 | 4 | 430.3 | 0.26 |
| 5 | 6 | 498.6 | 0.29 |
| 6 | 8 | 513.2 | 0.31 |
| 7 | 10 | 560.3 | 0.34 |
| 8 | 12 | 590.8 | 0.35 |
| 9 | 14 | 612.7 | 0.40 |
As can be seen from Table 1, with the time increasing, the size of the PAN nanoflowers increased gradually. It can be seen from the polydispersity index (PDI) that the PDI value of the PAN nanoflowers was smaller (which was monodisperse, PDI: 0.23–0.24). And with the time continues to increase, the PDI value was increased even if the ultrasonic dispersion time was prolonged before the test, which would not be reduced, that was, after 2 h, the monodispersity of the polymer particles was getting worse (PDI: 0.26–0.40).
TEM was used to track the morphology of the nanoflowers at different reaction stage (Fig. 3). The results were consistent with those of the laser particle size analyzer. With time increasing, the size of the nanoflowers increased and the dispersity was getting worse. In the initial stage of the reaction (the reaction time was less than 2 h), the nanoflowers were dispersed evenly and the morphology was showed as flower-shaped (Fig. 3A–C). However, when the reaction time was 4 h, several different morphological particles began to appear in the system. This phenomenon can be explained by that as time increased, different types of seed crystals were formed in the system. When the reaction time is 4 h, there were two different morphologies in the system (Fig. 3D). Moreover, with the increase of reaction time, there are three kinds of morphologies at 6–8 h (Fig. 3E and F), and the morphology was more irregular from 10 h to 14 h (Fig. 3G–I), and the crystals formed changes obviously (300–600 nm).
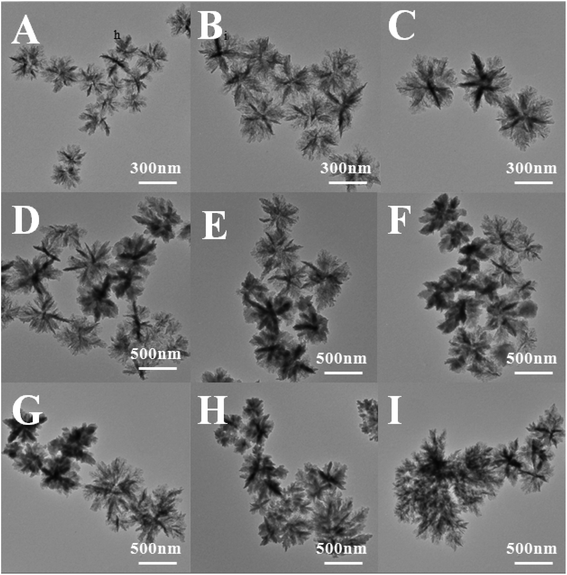 | ||
| Fig. 3 TEM images of samples prepared by varying the reaction time of PAN: (A) 0.5 h, (B) 1 h, (C) 2 h, (D) 4 h, (E) 6 h, (F) 8 h, (G) 10 h, (H) 12 h, (I) 14 h. | ||
It can be seen from Fig. S1,† in the initial stage (less than 2 h), the system followed the mechanism of dispersion polymerization and the shape and sizes of the nanoflowers were uniform and monodisperse. After 2 h, the polymerization rate was not reduced significantly. On the one hand, as time grown, the PAN nanoflowers continued to grow; on the other hand, the morphology of the nanoflowers was changed by the internal rearrangement of PAN nanoparticles.
As can be seen from Table 2, when the initiator AIBN: AN (mg ml−1) is between 1![[thin space (1/6-em)]](https://www.rsc.org/images/entities/char_2009.gif) :
:![[thin space (1/6-em)]](https://www.rsc.org/images/entities/char_2009.gif) 2 and 2
2 and 2![[thin space (1/6-em)]](https://www.rsc.org/images/entities/char_2009.gif) :
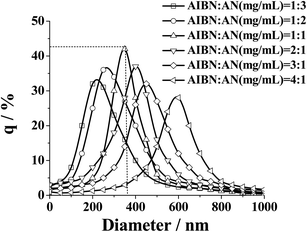
:![[thin space (1/6-em)]](https://www.rsc.org/images/entities/char_2009.gif) 1, the nanoflowers exhibited good dispersity, which was confirmed by particle size distribution (Fig. 4) measured by the laser particle size analyzer (particle size distribution was a single peak). With the increase of the initiator concentration, the size of the nanoflowers increased. When the concentration of AIBN: AN (mg ml−1) was less than 1
1, the nanoflowers exhibited good dispersity, which was confirmed by particle size distribution (Fig. 4) measured by the laser particle size analyzer (particle size distribution was a single peak). With the increase of the initiator concentration, the size of the nanoflowers increased. When the concentration of AIBN: AN (mg ml−1) was less than 1![[thin space (1/6-em)]](https://www.rsc.org/images/entities/char_2009.gif) :
:![[thin space (1/6-em)]](https://www.rsc.org/images/entities/char_2009.gif) 2, or more than 2
2, or more than 2![[thin space (1/6-em)]](https://www.rsc.org/images/entities/char_2009.gif) :
:![[thin space (1/6-em)]](https://www.rsc.org/images/entities/char_2009.gif) 1, the monodispersity of the nanoflowers was remarkably reduced and the polydispersity index value was increased significantly.
1, the monodispersity of the nanoflowers was remarkably reduced and the polydispersity index value was increased significantly.
| Samples | AIBN![[thin space (1/6-em)]](https://www.rsc.org/images/entities/char_2009.gif) : :![[thin space (1/6-em)]](https://www.rsc.org/images/entities/char_2009.gif) AN (mg ml−1) AN (mg ml−1) |
d(−) (nm) | Polydispersity index (%) |
|---|---|---|---|
| 1 | 1![[thin space (1/6-em)]](https://www.rsc.org/images/entities/char_2009.gif) : :![[thin space (1/6-em)]](https://www.rsc.org/images/entities/char_2009.gif) 3 3 |
185.4 | 0.36 |
| 2 | 1![[thin space (1/6-em)]](https://www.rsc.org/images/entities/char_2009.gif) : :![[thin space (1/6-em)]](https://www.rsc.org/images/entities/char_2009.gif) 2 2 |
246.4 | 0.27 |
| 3 | 1![[thin space (1/6-em)]](https://www.rsc.org/images/entities/char_2009.gif) : :![[thin space (1/6-em)]](https://www.rsc.org/images/entities/char_2009.gif) 1 1 |
326.4 | 0.25 |
| 4 | 2![[thin space (1/6-em)]](https://www.rsc.org/images/entities/char_2009.gif) : :![[thin space (1/6-em)]](https://www.rsc.org/images/entities/char_2009.gif) 1 1 |
387.0 | 0.28 |
| 5 | 3![[thin space (1/6-em)]](https://www.rsc.org/images/entities/char_2009.gif) : :![[thin space (1/6-em)]](https://www.rsc.org/images/entities/char_2009.gif) 1 1 |
452.4 | 0.30 |
| 6 | 4![[thin space (1/6-em)]](https://www.rsc.org/images/entities/char_2009.gif) : :![[thin space (1/6-em)]](https://www.rsc.org/images/entities/char_2009.gif) 1 1 |
586.2 | 0.33 |
Initiator AIBN played a key role in the formation of polymers, which was contributed to form the free radicals. When the AIBN concentration increased, the production rate of free radicals and the concentration of the oligomer free radicals increased, which would increase the number of PAN molecular chains and cores. As a result, more and more oligomers were precipitated on the core particles to form larger particles, so that the particle size distribution was widened. However, when the initiator concentration was too low, precipitation rate of the polymer chain was also reduced, which would greatly extend the nucleation period, leading to wide particle size distribution of the polymer.
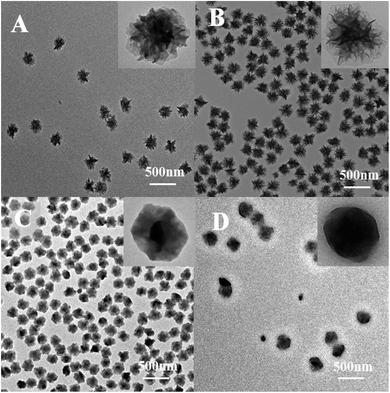 | ||
| Fig. 5 TEM photomicrographs of PAN nanoparticles in different reaction medium. (A) Methyl acetate, (B) ethyl acetate, (C) butyl acetate, (D) isoamyl acetate. | ||
Fig. 5 showed that the lamellae of the polymer surface were becoming increasingly blurred, with the increase in the boiling point of the dispersion medium. The lamellae of the nanoflowers (obtained in methyl acetate, in Fig. 5A) were very clear, like a chrysanthemum. When the butyl acetate was used as the dispersion medium (Fig. 5C), the nanoflowers had no obvious stratification. Finally, with isoamyl acetate (Fig. 5D) as the dispersion medium, the nanoflowers had become more regular black balls, the edge was blurred.
This phenomenon could be explained by that the boiling point of butyl acetate and isoamyl acetate was higher than the glass transition temperature of the PAN. The glass transition temperature was the lowest temperature of the motion of the polymer segments. When the reaction temperature was above the glass transition temperature, the molecules in the polymer were rearranged. And the ordered regions induced the crystallization of the amorphous region, and then the ordered regions themselves were further growth and improvement, the molecular arrangement was more regular, resulting in the size of nanoflowers reduced.
The XRD results (Fig. S2†) showed that, with the increase of the boiling point of the dispersion medium, the characteristic peak intensity of PAN nanoflowers increased (a: 2000, b: 6500, c: 10![[thin space (1/6-em)]](https://www.rsc.org/images/entities/char_2009.gif) 000, d: 10
000, d: 10![[thin space (1/6-em)]](https://www.rsc.org/images/entities/char_2009.gif) 500). More precisely, the crystallinity of the nanoflowers increased, confirming the above speculation.
500). More precisely, the crystallinity of the nanoflowers increased, confirming the above speculation.
| No. | Styrene (wt%) | d(−) (nm) | Polydispersity index (%) |
|---|---|---|---|
a Conditions: the volume of AN was 10 ml (containing AIBN 10 mg), the volume of TBP was 30 ml, AN: TBP = 1![[thin space (1/6-em)]](https://www.rsc.org/images/entities/char_2009.gif) : :![[thin space (1/6-em)]](https://www.rsc.org/images/entities/char_2009.gif) 3. 3. |
|||
| 1 | 0.25 | 200.4 | 0.24 |
| 2 | 1.0 | 327.5 | 0.21 |
| 3 | 1.5 | 387.6 | 0.20 |
| 4 | 2.0 | 463.9 | 0.23 |
| 5 | 2.5 | 493.6 | 0.24 |
With increasing the amount of styrene, the length of critical chain of polymer increased, resulting in the decrease in the rate of precipitation of polymer chains. Therefore, the number of cores in the system was reduced, and the size of the nanoflowers was relatively large, which made the size distribution of nanoflowers narrow, as demonstrated in the PDI values shown in Table 3.
The degree of crystallinity depended on the amount of styrene (Fig. S3†). The diffraction peaks at 16.7° and 29.3° were the characteristic peaks of PAN. With increasing the concentration of styrene, the position of the diffraction peaks was not changed, indicating that styrene did not change the crystal form of the polymer PAN. However, with increasing amount of styrene, the degree of crystallinity decreased (intensity of PAN was reduced from 40![[thin space (1/6-em)]](https://www.rsc.org/images/entities/char_2009.gif) 000 to 10
000 to 10![[thin space (1/6-em)]](https://www.rsc.org/images/entities/char_2009.gif) 000). It was due to that, after addition of styrene, the ordering degree of the cyano groups was reduced and the length of the continuous AN sequence unit was destroyed, resulting in a decrease in the crystallinity of PAN.
000). It was due to that, after addition of styrene, the ordering degree of the cyano groups was reduced and the length of the continuous AN sequence unit was destroyed, resulting in a decrease in the crystallinity of PAN.
Interestingly, it was found that the morphology of the particle was easily tuned by adding different concentration of styrene. Fig. 6 showed the TEM images and the corresponding particle size distribution histogram of the samples prepared by changing the concentration of styrene. When adding a small amount of styrene (0.25 wt%), the particles surface of the layers had been less obvious (only slightly protruding) with the average size of 210 nm (Fig. 6A and D). However, the distribution of the particles was very good, which was consistent with the results of laser particle size analyzer analysis. As the amount of styrene increases, the surface of the particles became smoother and became a regular spherical structure, which was similar to that of the study by Katharina Landfester.26 However, in the study of Katharina Landfester, addition of styrene did not have such a significant effect on the morphology of PAN particles, and a regular spherical structure was formed, until the styrene content reached 50 wt%. In this work, the addition of a very small amount of styrene polymer particles could change greatly. When the concentration of styrene was 1.0 wt%, the particles showed the perfect smooth spheres with the average size of 320 nm (Fig. 6B and E). But the content of styrene increased to a certain extent (2.0 wt%), and the final formed polymer particles would adhere to each other, and the average particle size was increased to 412 nm with well-defined smooth particle surface (Fig. 6C and F).
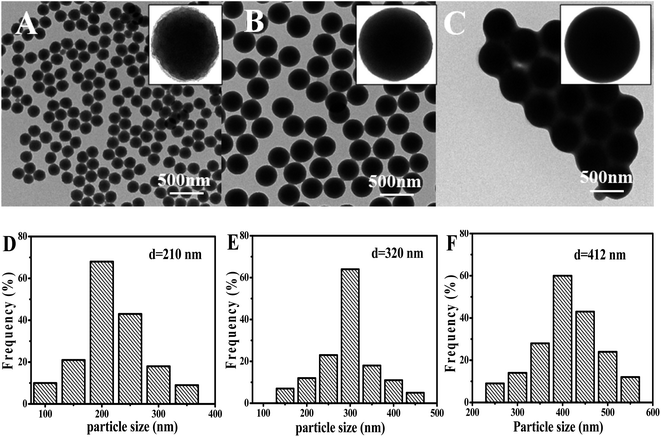 | ||
| Fig. 6 TEM photomicrographs of PAN nanoparticles at different styrene concentrations. (A) 0.25 wt%, (B) 1.0 wt%, (C) 2.0 wt%, ((D)–(F) the particle size of the (A)–(C)). | ||
The FTIR spectra of PAN and P(AN-St) samples were shown in Fig. S4.† A strong peak at 2234 cm−1 corresponded to the –C![[triple bond, length as m-dash]](https://www.rsc.org/images/entities/char_e002.gif) N bending. It should be also noted that the peak at 2234 cm−1 became weaken gradually and new peaks at around 1453 cm−1, 1494 cm−1 and 1602 cm−1 for P(AN-St) were recorded, revealing the change of the benzene ring in styrene. The peaks at 699 cm−1 (Out-of-plane bending absorption peak of Ar–H) and 760 cm−1 (C–H outside bending absorption peak) were observed, indicating the copolymerization between AN and St.
N bending. It should be also noted that the peak at 2234 cm−1 became weaken gradually and new peaks at around 1453 cm−1, 1494 cm−1 and 1602 cm−1 for P(AN-St) were recorded, revealing the change of the benzene ring in styrene. The peaks at 699 cm−1 (Out-of-plane bending absorption peak of Ar–H) and 760 cm−1 (C–H outside bending absorption peak) were observed, indicating the copolymerization between AN and St.
3.3. Swelling behavior and pH-sensitivity of drug release of the PAN nanoflowers
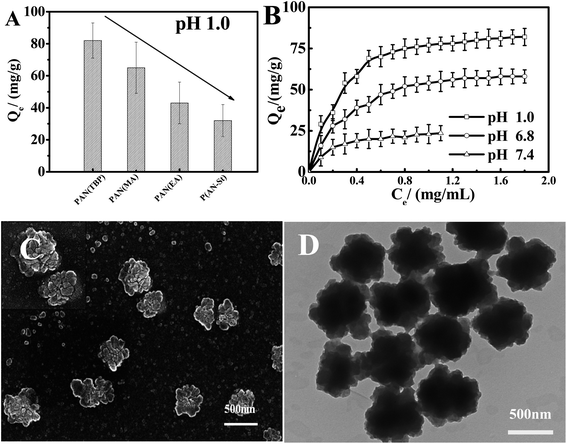
Nanoparticles PAN prepared in different solvents (TBP, methyl acetate, ethyl acetate, TBP adding styrene (1.0 wt%)) were marked PAN(TBP), PAN(MA), PAN(EA), P(AN-St), respectively. The swelling ratio (formula (1), ESI†) of PAN(TBP), PAN(MA), PAN(EA), and P(AN-St) immersed in pH 1.0 solution for 25 h was plotted in Fig. 7. It can be seen from the Fig. 7A that all nanoparticles absorbed water rapidly in the initial swelling stage. With time went by, the swelling ratio increased gradually, and reached equilibrium in about 14 h. Besides, the swelling ratio of PAN(TBP) was reached the maximum value (450%) in pH 1.0 solution, which was higher than that of PAN(EA), and P(AN-St). It can be seen from Fig. 7B, the swelling ratio of PAN(TBP) exhibited higher value at acidic pH (pH 1.0) than at pH 6.8 and pH 7.4, which was due to the –C![[triple bond, length as m-dash]](https://www.rsc.org/images/entities/char_e002.gif) N on the surface of PAN bearing positive charges. In acidic solution, the petals of PAN could be better to open and allowed more acid solution to enter the interior. The results showed that PAN nanoflowers had good pH sensitivity.
N on the surface of PAN bearing positive charges. In acidic solution, the petals of PAN could be better to open and allowed more acid solution to enter the interior. The results showed that PAN nanoflowers had good pH sensitivity.
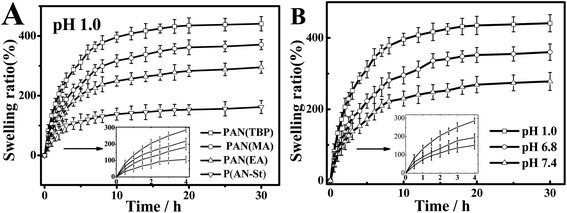 | ||
| Fig. 7 (A) Swelling behavior of nanoflowers PAN(TBP), PAN(MA), PAN(EA), P(AN-St). (B) Swelling behavior of PAN(TBP) in different pH conditions at 37 °C (mean ± SD, n = 3). | ||
Fig. 8A showed the effect of drug molecules on the drug loading (formula (2), ESI†) of PAN(TBP), PAN(MA), PAN(EA), and P(AN-St). As can be seen from Fig. 8A, the adsorption capacity of nanoparticles PAN(TBP), PAN(MA), PAN(EA), and P(AN-St) for BSA was 82 mg g−1, 64 mg g−1, 43 mg g−1, and 32 mg g−1, respectively. The adsorption capacity of PAN(TBP) for BSA was much higher than that of PAN(MA), PAN(EA), and P(AN-St). It was because that PAN(TBP) with a lot of lamellae was easily to absorb BSA molecules, and BSA could enter the interior of PAN(TBP), resulting in increasing of the drug loading amount. However, the surface structure of the P(AN-St) was smooth, resulting in the reducing of the drug loading amount greatly (32 mg g−1).
Fig. 8B displayed the effect of different pH values (1.0, 6.8, 7.4) on BSA loading of nanoparticles. The drug loading amount for BSA of PAN(TBP) (in pH 1.0, 6.8, 7.4) was 82 mg g−1, 58 mg g−1, and 24 mg g−1, respectively. The drug loading amount increased rapidly with the decreasing of the pH values, and the drug loading amount reached maximum (about 82 mg g−1) in pH 1.0. This phenomenon can be explained by that the electrostatic force was very strong between the –C![[triple bond, length as m-dash]](https://www.rsc.org/images/entities/char_e002.gif) N of PAN(TBP) and the BSA with a lot of –NH2 and –COOH. In pH 1.0 medium, there formed plenty of hydrogen bonds, because of the highly protonated amine of BSA in acidic medium, resulting in high binding capacity of BSA to PAN(TBP). However, in neutral or alkaline buffer solution, the electrostatic force was weak with the low degree of protonated of the amine BSA, so that the binding capacity was decreased with the increase of the pH value. Fig. 8C and D showed the SEM and TEM images of the PAN(TBP) drug loading of BSA.
N of PAN(TBP) and the BSA with a lot of –NH2 and –COOH. In pH 1.0 medium, there formed plenty of hydrogen bonds, because of the highly protonated amine of BSA in acidic medium, resulting in high binding capacity of BSA to PAN(TBP). However, in neutral or alkaline buffer solution, the electrostatic force was weak with the low degree of protonated of the amine BSA, so that the binding capacity was decreased with the increase of the pH value. Fig. 8C and D showed the SEM and TEM images of the PAN(TBP) drug loading of BSA.
The zeta potential of PAN nanoparticles was investigated. As can be seen from Fig. S5,† the green areas(±40 mV) represent the stable area for the PAN nanoparticles, and the red areas represent the unstable area. PAN(TBP) nanoparticles showed higher stability than other nanoparticles at pH 1–3 and pH 6–10.
Fig. S6† showed the destruction of BSA(formula (3), ESI†) by the protease in mimicking stomach acidic fluids. After release 2 hours, the drug release rate of PAN nanoparticles (PAN(TBP), PAN(MA), PAN(EA), PAN(AN-St)) was 5.5%, 7.6%, 10.2%, and 16.8%, respectively. The drug release rate of PAN(TBP) was lower than other PAN nanoparticles, this phenomenon could be explained that at pH 1.0, BSA became protonated, forming the hydrophilic –NH3+ groups. The electrostatic force was formed between –NH3+ groups in BSA and –C![[triple bond, length as m-dash]](https://www.rsc.org/images/entities/char_e002.gif) N of PAN(TBP), and BSA was tightly bound by the electrostatic forces in PAN(TBP), resulting in the low dug release. Because the amount of BSA loss in the mimicking stomach acidic fluids, the concentration of BSA broken by protease could be neglected in subsequent experiments.
N of PAN(TBP), and BSA was tightly bound by the electrostatic forces in PAN(TBP), resulting in the low dug release. Because the amount of BSA loss in the mimicking stomach acidic fluids, the concentration of BSA broken by protease could be neglected in subsequent experiments.
In order to investigate the effect of pH of the external medium on the drug release behavior (Fig. 9), cumulative release amount (formula (4), ESI†) of BSA in buffer solution with pH 1.0, 6.8, and 7.4 was measured.
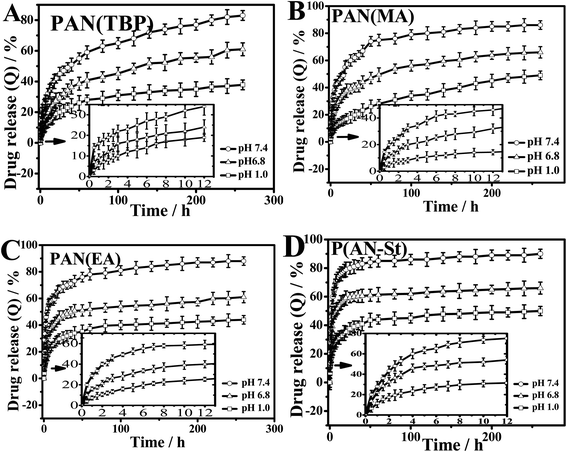 | ||
| Fig. 9 pH sensitive drug release behavior of (A) PAN(TBP), (B) PAN(MA), (C) PAN(EA), (D) P(AN-St) in different pH conditions at 37 °C. Data points represent mean ± SD (n = 3). | ||
Cumulative drug release for BSA was investigated in Fig. 9, which showed that, with the increasing the pH value from 1.0 to 7.4, the drug release of all PAN nanoparticles was increased obviously. It was indicated that the drug release profiles of PAN were pH-sensitive.
As can be seen from Fig. 9A, in pH 7.4 medium, the cumulative drug release of PAN(TBP) was 25% in the first five hours, and the total drug release was reached 83% in 260 hours. However, in the buffer solution (pH 6.8 and 1.0), the cumulative drug release were 61% and 38%, respectively. This phenomenon can be explained as follows: at pH 1.0, BSA became protonated, forming the hydrophilic –NH3+ groups. The electrostatic force was formed between –NH3+ groups in BSA and –C![[triple bond, length as m-dash]](https://www.rsc.org/images/entities/char_e002.gif) N of PAN(TBP), and BSA was tightly bound by the electrostatic forces in PAN(TBP), resulting in the low dug release (t9.6% = 5 h, t38% = 260 h). With the increase of pH value, the degree of amine protonated of BSA reduced gradually, resulting in the electrostatic force weakens between amine protonated of BSA and PAN nanoparticles. Then the plenty of BSA molecules could be released from the inside of the PAN(TBP) easily. The drug release ratio was increased obviously. The PAN(TBP) showed pH sensitivity with drug release in different buffer solution.
N of PAN(TBP), and BSA was tightly bound by the electrostatic forces in PAN(TBP), resulting in the low dug release (t9.6% = 5 h, t38% = 260 h). With the increase of pH value, the degree of amine protonated of BSA reduced gradually, resulting in the electrostatic force weakens between amine protonated of BSA and PAN nanoparticles. Then the plenty of BSA molecules could be released from the inside of the PAN(TBP) easily. The drug release ratio was increased obviously. The PAN(TBP) showed pH sensitivity with drug release in different buffer solution.
As for PAN(MA), PAN(EA), P(AN-St), as can be seen from Fig. 9B–D, in the first five hours (in the buffer solution with pH 7.4), the cumulative drug release ratio was t38.1% = 5 h, t52.2% = 5 h, and t63.4% = 5 h, respectively. The cumulative drug release ratio of PAN(MA), PAN(EA), and P(AN-St) was much larger than that of PAN(TBP). This phenomenon can be explained by that the three-dimensional structure of nanoparticles of PAN(TBP), PAN(MA), PAN(EA), and P(AN-St), were different obviously. The surface of nanoparticles P(AN-St) was relatively smooth, and the BSA molecule was absorbed to the surface of the P(AN-St). Therefore, the cumulative release ratio exhibited a significant drug burst in the initial stage (t63.4% = 5 h, in pH 7.4), and the total cumulative release ratio was 90%. As for PAN(MA) and PAN(EA), there was much lamellar on the surface, but which was less than that of PAN(TBP), resulting in that the drug release ratio (t38.1% = 5 h, t52.2% = 5 h, t63.4% = 5 h) in the first five hours which was larger than that of PAN(TBP) (t9.6% = 5 h). As for PAN(TBP), BSA was not only absorbed on the surface of the lamellar, but also absorbed inside of the petals, which may not get access to the long time diffusion of the aqueous medium. Thus, in the drug release stage, the release of BSA slowed down with the controlled release behavior. It was because that BSA was bundled in the deeper petals. Therefore, the release of BSA slowed down in the following time period. The craft copolymerization molecular imprinting polymer chitosan-g-poly (methylmethacrylate) (MIP-CS-g-PMMA) exhibited also time delay of release manner.24
The TEM image of PAN nanoflowers after release was investigated in Fig. S7.† As can be seen from Fig. S7,† the morphology of the PAN nanoflowers after release BSA was similar to that of blank PAN nanoflowers (Fig. 1D).
3.4. Mathematical model fitting analysis of release behavior of drug loaded nanoparticles
In order to explore the release behavior of the nanoparticles more deeply, the linear fitting curve was studied by four common drug release mathematical models ((a) zero-order release model, (b) first-order release model, (c) Higuchi model, and (d) Riger-Peppas model). Fig. 10 showed the model fitting of drug release behavior in PAN(TBP) nanoflowers in buffer solution of pH 1.0, 6.8 and 7.4.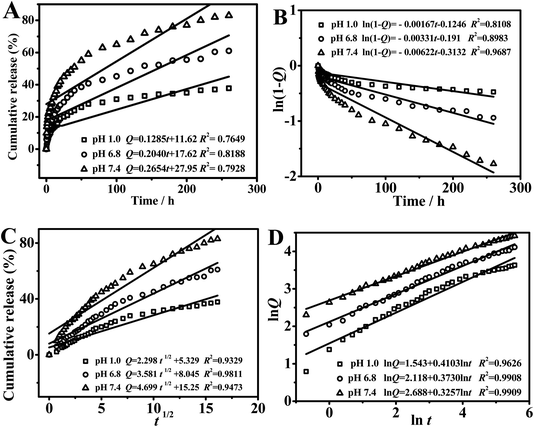 | ||
| Fig. 10 Model fitting of drug release behavior in PAN(TBP) nanoflowers: (A) zero-order release model, (B) first-order release model, (C) Higuchi model, and (D) Riger-Peppas model. | ||
As can be seen from Fig. 10A–C, the model fitting of (a), (b), and (c) was not fitted very well, which indicated the drug release behavior was not followed by the mathematical models of (a), (b), and (c). As can be seen from Fig. 10D (the model fitting of Riger-Peppas model (d)), the goodness of fit (R2) in pH 1.0, 6.8, 7.4 was 0.9626, 0.9908 and 0.9909, respectively. The goodness of fit was highest (R2 = 0.9909) in buffer solution of pH 7.4, which was based on the high degree of similarity between the PAN(TBP) nanoflowers and the framework-type drug carriers, the PAN(TBP) nanoflowers can be roughly determined to release the BSA in the Riger-Peppas model in pH 7.4. Therefore, the optimal linear fitting for drug release was Riger-Peppas model.
4. Conclusion
PAN nanoparticles with petaloid shape, high productivity and promising pH responsiveness were prepared through one step using azobisisobutyronitrile (AIBN) as the initiator and without any emulsifier or stabilizer with static polymerization method. Effect of preparation parameters, such as monomer concentration, reaction time, initiator concentration, reaction medium, and styrene concentration, on the morphology were investigated. Then BSA loaded PAN nanoflowers were prepared and the drug release behavior were studied. The BSA-loaded PAN nanoflowers with particle sizes of 400–500 nm exhibited obviously pH responsive release behavior. Riger-Peppas model was the most suitable model for describing BSA release kinetics from PAN nanoflowers and the diffusion through the swelling of PAN nanoflowers was the main factor in controlling BSA release. Further study on preparation nanoflowers with improved drug loading and drug release efficiency is under way.Conflicts of interest
There are no conflicts to declare.Acknowledgements
Authors are thankful to Hebei Normal University of Science and Technology, China for the research support to carry out this work and for providing the testing equipment facility. The authors acknowledge the financial support from the Natural Science Foundation of Hebei Province, China (B2015202082, B2016202027, B2017202056, and B2018407041), Hebei High level personnel of support program, China (A2016002027).References
- C. Kriegel and M. Amiji, J. Controlled Release, 2011, 150, 77–86 CrossRef CAS PubMed.
- B. Xiao and D. Merlin, Expert Opin. Drug Delivery, 2012, 9, 1393–1407 CrossRef CAS PubMed.
- A. Viscido, A. Capannolo, G. Latella, R. Caprilli and G. Frieri, J. Crohn's Colitis, 2014, 8, 903–918 CrossRef PubMed.
- B. Xiao, X. Y. Si, M. Z. Zhang and D. Merlin, Colloids Surf., B, 2015, 135(1), 379–385 CrossRef CAS PubMed.
- K. Maisel, L. Ensign, M. Reddy, R. Cone and J. Hanes, J. Controlled Release, 2015, 197, 48–57 CrossRef CAS PubMed.
- W. J. Sandborn, S. Danese, G. D'Haens, L. Moro, R. Jones, R. Bagin, M. Huang, E. David Ballard, J. Masure and S. Travis, Aliment. Pharmacol. Ther., 2015, 41, 409–418 CrossRef CAS PubMed.
- A. Beloqui, R. Coco, M. Alhouayek, M. A. Solinis, A. Rodriguez-Gascon, G. G. Muccioli and V. Preat, Int. J. Pharm., 2013, 454, 775–783 CrossRef CAS PubMed.
- L. Chen, W. Sun, L. Bo, J. Wang, C. Xiu, W. Tang, J. Shi, H. Zhou and X. Liu, Eur. J. Med. Chem., 2017, 138, 170–181 CrossRef CAS PubMed.
- B. Demirdirek and K. E. Uhrich, Int. J. Pharm., 2017, 528, 406–415 CrossRef CAS PubMed.
- J. Luan, K. Wu, C. Li, J. Liu, X. Ni, M. Xiao, Y. Xu, Y. Kuang and F. Jiang, Carbohydr. Polym., 2017, 171, 9–17 CrossRef CAS PubMed.
- S. Bazban-Shotorbani, M. Hasani-Sadrabadi, A. Karkhaneh, V. Serpooshan, K. Jacob, A. Moshaverina and M. Mahmoudi, J. Controlled Release, 2017, 253, 46–63 CrossRef CAS PubMed.
- X. Zou, X. Zhao, L. Ye, Q. Wang and H. Li, J. Ind. Eng. Chem., 2015, 21, 1389–1397 CrossRef CAS.
- J. Jia, C. Wang, K. Chen and Y. Yin, Chem. Eng. J., 2017, 327, 953–961 CrossRef CAS.
- E. I. Nep, M. H. Mahdi, A. O. Adebisi, C. Dawson, K. Walton, P. J. Bills, B. R. Conway, A. M. Smith and K. Asare-Addo, Int. J. Pharm., 2017, 532, 352–364 CrossRef CAS PubMed.
- Y. Li, X. Qiu, Y. Qian, W. Xiong and D. Yang, Chem. Eng. J., 2017, 327, 1176–1183 CrossRef CAS.
- F. Ungaro, O. Catanzano, I. d'Angelo, L. Diza-Gomez, A. Concheiro, A. Miro, C. Alvarez-Lorenzo and F. Quaglia, Carbohydr. Polym., 2017, 175, 645–653 CrossRef CAS PubMed.
- L. Agüero, D. Zaldivar-Silva, L. Peña and M. L. Dias, Carbohydr. Polym., 2017, 168, 32–43 CrossRef PubMed.
- S. R. Soni and A. Ghosh, Carbohydr. Polym., 2017, 174, 812–822 CrossRef CAS PubMed.
- K. Fuchs, R. Duran, A. Denys, P. E. Bize, G. Borchard and O. Jordan, J. Controlled Release, 2017, 262, 127–138 CrossRef CAS PubMed.
- N. Teekamp, F. V. Dijk, A. Broesder, M. Evers, J. Zuidema, R. Steendam, E. Post, J. L. Hillebrands, H. W. Frijlink, K. Poelstra, L. Beljaars, P. Olinga and W. L. J. Hinrichs, Int. J. Pharm., 2017, 534, 229–236 CrossRef CAS PubMed.
- F. Maestrelli, N. Zerrouk, M. Cirri and P. Mura, Int. J. Pharm., 2015, 485, 365–373 CrossRef CAS PubMed.
- P. Roy and A. Shahiwala, J. Controlled Release, 2009, 134, 74–80 CrossRef CAS PubMed.
- M. Naeem, W. Kim, J. Cao, Y. Jung and J. W. Yoo, Colloids Surf., B, 2014, 123, 271–278 CrossRef CAS PubMed.
- X. F. Zheng, Q. Lian, H. Yang and X. Wang, Sci. Rep-UK., 2016, 6, 21409 CrossRef CAS PubMed.
- B. Lior, B. Sigal and M. Shlomo, J. Colloid Interface Sci., 2005, 289, 71–85 CrossRef PubMed.
- L. Katharina and A. Markus, Rapid Commun., 2000, 21, 820–824 CrossRef.
Footnote |
| † Electronic supplementary information (ESI) available: Characterizations details, adsorption experiments, and in vitro controlled release of BSA, Fig. S1–S4. See DOI: 10.1039/d0ra01427c |
| This journal is © The Royal Society of Chemistry 2020 |

