
 Open Access Article
 This Open Access Article is licensed under a Creative Commons Attribution-Non Commercial 3.0 Unported Licence
Application of a clustered countercurrent-flow micro-channel reactor in the preparation of KMnF3 perovskite for asymmetric supercapacitors
Kun-Peng Chengab,
Ren-Jie Guab and
Li-Xiong Wen *ab
*ab
aResearch Center of the Ministry of Education for High Gravity Engineering and Technology, Beijing University of Chemical Technology, Beijing 100029, China. E-mail: wenlx@mail.buct.edu.cn
bCollege of Chemical Engineering, Beijing University of Chemical Technology, Beijing 100029, China
First published on 24th March 2020
Abstract
A clustered countercurrent-flow micro-channel reactor (C-CFMCR) with adjustable magnification times was constructed for the preparation of KMnF3 perovskite fluoride by a co-precipitation process, in which the concentrations and feed rates of reactants were precisely controlled. Benefitting from the enhanced micromixing efficiency of the microreactor, the KMnF3 particles prepared in C-CFMCR were smaller and less aggregated than those produced with traditional stirred reactors (STR). The prepared KMnF3 was applied as the electrode material in supercapacitors, and the electrochemical measurements showed that the KMnF3 obtained under optimal conditions had a discharge specific capacitance of ∼442 F g−1 at a current density of 1 A g−1, with a decline of ∼5.4% after 5000 charge–discharge cycles in an aqueous electrolyte of 2 M KOH. It was also found that the morphologies and electrochemical performances of the prepared KMnF3 particles changed accordingly with the micromixing efficiencies of C-CFMCR, which can be adjusted by the reactor structure and operating conditions. An asymmetric supercapacitor assembled with the KMnF3 and activated carbon exhibited an energy density of 13.1 W h kg−1 at a power density of 386.3 W kg−1, with eminent capacitance retention of ∼81.2% after 5000 cycles. In addition, only a slight amplification effect of C-CFMCR on the co-precipitation process was noticed, indicating that the C-CFMCR is a promising technology for the massive and controllable production of KMnF3 particles as well as other ultrafine particles.
1. Introduction
The increasing energy demand together with device miniaturization make it urgent to develop alternative and renewable energy storage resources with fast charge–discharge rate, high cycling stability and low cost. Supercapacitors, which fill the gap between conventional capacitors and batteries, have attracted significantly increasing attention in practical applications ranging from portable electronics and implantable medical devices to electric vehicles.1–5 There are two accepted mechanisms of charge storage for supercapacitors, i.e., electrical double layer capacitance (EDLC) and pseudo-capacitance.6 The former, which is developed generally with carbon materials, stores electric energy via the accumulation of ions at the electrode/electrolyte interface to generate enormous electric capacity; while for the latter, the energy storage is achieved by fast and reversible faradaic redox reactions taking place in the surface of electroactive materials and the reaction site can provide dozens of times higher energy density in comparison with the non-faradaic process,7,8 possessing much larger specific capacitance than EDLCs as a consequence.9–12It is well known that electrode materials play an extremely important role in the performance of supercapacitors. In pursuit of high-performance supercapacitors, suitable electrode materials with high redox activity, good conductivity and electrical stability must be developed. Various forms of carbonaceous materials, transition metal compounds and conducting polymers have been investigated and used extensively as electrode materials for supercapacitors.13–18 Perovskite-type materials with the nominal formula of ABC3, where A is a lanthanide or alkali earth element and B is a valence-variable metal cation, have been widely studied as electrodes for solid fuel cells and supercapacitors on account of their inherent 3D diffusion channels and robust structure with intersectant orthogonal cavity chains.19–23 Because of the considerable ionic essence of transition metal-fluoride bonds and inherent high rate of ion diffusion, perovskite fluorides have been considered as a promising candidate to replace perovskite oxides for electrochemical applications.24,25 It has been reported that KCoF3 demonstrates good electrochemical stability and energy storage capacity.26 KMnF3 is a manganese-containing fluoride with perovskite-type structure and improved conductivity. In addition, evidences show that there exist inherent cation vacancies in Mn-contained compounds in terms of ions intercalation in charge–discharge process,27,28 which can be exploited to improve charge storage through the insertion of electrolyte cations into Mn vacancies. However, little research on perovskite fluorides for electrode materials of supercapacitors has been conducted.
There are several methods for the synthesis of perovskite fluorides, such as hydrothermal,29 inverse micelle method,30 reaction precipitation31 and horizontal Bridgman method.32 Compared to reaction precipitation, other methods suffer several drawbacks, such as inflexible process, environmental unfriendly and large space occupation for peculiar devices. Besides, the low throughput could hardly satisfy the demands of commercialization.
Precipitation is a flexible process for the synthesis of particles with varying morphologies and other specified properties, in which uniform and high level of supersaturation is essential because of the highly nonlinear dependency of the nucleation rate on supersaturation.33 Since precipitation processes are generally accompanied by very fast reactions, rapid micromixing is desired to generate uniform level of supersaturation and promote the product quality consequently. However, high micromixing efficiency is hard to be achieved in conventional stirred reactor (STR) due to the inhomogeneous local distribution of concentration and flow rate, leading to uneven element distribution within the prepared material. To address above disadvantages, many microstructured devices for process intensification, such as confined impinging jet reactor,34 Y-type microchannel reactor,35 microporous tube-in-tube micro-channel reactor,36 rotor–stator mixer,37 etc., have been developed for performing chemical reaction and separation processes, in which fast micromixing is desired. All these precisely designed devices can remarkably strengthen micromixing performance and provide an even environment for energy dissipation and reactants distribution. Nevertheless, most of the micromixing-intensified instruments are either difficult to be manufactured and scaled up by reasons of their complex structures or vulnerable to severe blocking problem and low yield limitation when it comes to practical applications. In this regards, development of new micromixing-enhanced devices with advantages of simple configuration, ease to scale up and slight blocking remains an urgent challenge for chemical precipitation processes.
For this purpose, we built a clustered countercurrent-flow micro-channel reactor (C-CFMCR) by numbering-up its single counterpart, i.e., a single countercurrent-flow micro-channel reactor (S-CFMCR), and studied its micromixing performance (expressed as micromixing time, tm) experimentally.38 It was found that C-CFMCR had notable advantages of strengthening micromixing, easy to be fabricated, flexible operation in continuous manner and easy to be scaled up with controllable magnification times. Hence it was expected to be an efficient technology for the massive precipitation of nanoparticles or ultrafine particles. In this work, C-CFMCRs were applied to prepare ultrafine KMnF3 particles with varying feed rate and were compared to the same product synthesized in STR. The amplification effect of the as-developed reactor was explored by assembling C-CFMCRs with different number of S-CFMCR. In addition, the electrochemical properties of KMnF3 in a three-electrode system as well as a practical application as supercapacitor were assessed.
2. Experimental
2.1. Chemicals and reagents
Potassium fluoride dihydrate (KF·2H2O) and manganese chloride tetrahydrate (MnCl2·4H2O) were obtained from Guangfu Fine Chemical Factory (Tianjin, China). Acetylene black, polyvinylidene fluoride (PVDF), and n-methyl-2-pyrrolidinone (NMP) were provided by Sinopharm Chemical Reagent Co., Ltd. (China). Potassium hydroxide (KOH) was purchased from Tongguang Fine Chemical Ltd. (Beijing, China). Activated carbon (AC) (with a specific surface area of 1600 m2 g−1) was obtained from Kuraray China Co., Ltd. (Shanghai, China). All chemicals were of analytical grade and used without further purification.2.2. Construction of C-CFMCR
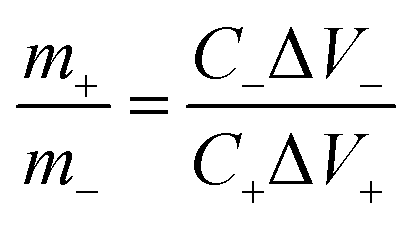
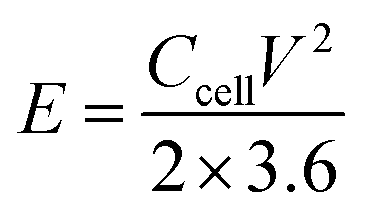
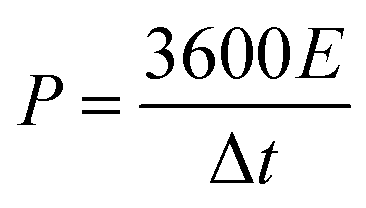
The C-CFMCR (Fig. 1b–d) was integrated by its counterpart S-CFMCR (Fig. 1a) as stated in our previous work,38 which possesses the advantages of easy to fabricate, flexible operation and variable magnification factors.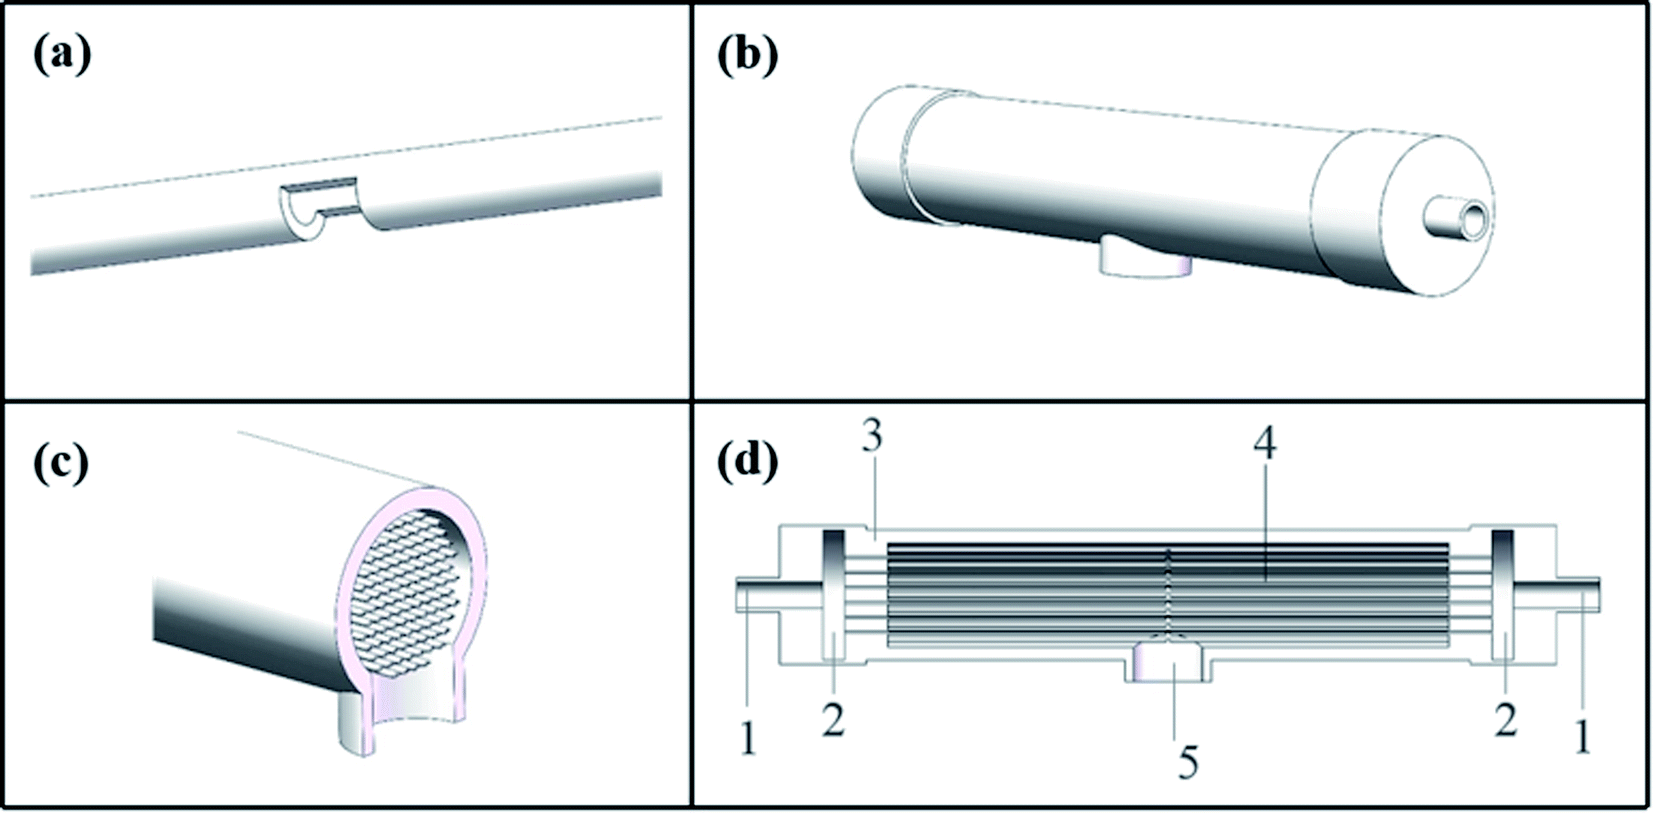 | ||
| Fig. 1 Structure of assembled C-CFMCR: (a) S-CFMCR, (b) outer appearance of C-CFMCR, (c) middle cross-section of C-CFMCR, (d) front cross-section of C-CFMCR: (1) main inlet; (2) buffer zone; (3) shell; (4) S-CFMCRs; (5) main outlet. | ||
2.3. Synthesis of KMnF3
The co-precipitation processes of KMnF3 were carried out at ambient temperature. A 0.6 M KF·2H2O solution and a 0.2 M MnCl2·4H2O solution were introduced into C-CFMCR simultaneously from the two main inlets by precise plunger pumps or directly mixed by vigorously stirring in STR, generating KMnF3 according to the following equation:| 3KF·2H2O + MnCl2·4H2O → KMnF3 + 2KCl + 6H2O | (1) |
The volumetric flow ratio of the two injecting streams was kept at 1 for coaxially balanced convection at the exit zone with varying volumetric flow rate ranging from 10 to 80 mL min−1 (corresponding to a Reynolds number varying from 394 to 3152 with an inlet diameter of 0.6 mm) in each individual S-CFMCR. The collected suspension was stirred at room temperature for 4 h and then washed with deionized water and ethanol for several times, and dried in a vacuum oven overnight at 60 °C to obtain white powders. The precipitation conditions are illustrated in Table 1, in which the micromixing time is determined by the liquid flow rate within the specific reactors.
2.4. Material characterization
The crystal structure of samples was analyzed using X-ray diffraction (XRD, Bucker D8, Germany), applying Cu Kα radiation (λ = 0.1542 nm) as the source from 10 to 80° with a scan rate of 10° min−1. The optical absorption measurement was carried out by using UV-VIS-NIR spectrophotometer (Shimadzu UV-3600, Japan) from 800 to 220 nm. Energy dispersive spectroscopy (EDS) and morphology analyses were conducted with a scanning electron microscopy (SEM, JEOL S-7800, Japan). The surface electronic states were captured by X-ray photoelectron spectra (XPS, ESCALAB-250, USA) with Al Kα radiation. N2 absorption desorption isotherm was recorded by an ASAP 2010 instrument (Micromeritics, USA) after pretreated in vacuum for 6 h.2.5. Electrode preparation and electrochemical characterization
The working electrode was prepared by mixing the active material KMnF3, acetylene black and polyvinylidene fluoride (PVDF) with a mass ratio of 8![[thin space (1/6-em)]](https://www.rsc.org/images/entities/char_2009.gif) :1:1, a proper amount of n-methyl-2-pyrrolidinone (NMP) was then added into the mixture. A nickel foam substrate (1 × 1 × 0.1 cm) was coated with the above-obtained slurry, dried at 80 °C for 12 h and pressed under 10 MPa into a thin wafer. The mass loading of active material was 1.5–2.5 mg cm−2.
:1:1, a proper amount of n-methyl-2-pyrrolidinone (NMP) was then added into the mixture. A nickel foam substrate (1 × 1 × 0.1 cm) was coated with the above-obtained slurry, dried at 80 °C for 12 h and pressed under 10 MPa into a thin wafer. The mass loading of active material was 1.5–2.5 mg cm−2.
Electrochemical tests were conducted in a three-electrode system by an electrochemical workstation (CHI660E, CH Instruments Inc., USA), with a platinum plate and an Hg/HgO electrode employed as the counter and reference electrode, respectively. 2 M KOH aqueous solution was used as the electrolyte. A few cyclic voltammetry (CV) cycles were carried out in advance to activate the electrode, followed by galvanostatic charge–discharge (GCD) and cyclic voltammetry (CV) tests. The electrochemical impedance spectroscopy (EIS) measurement was conducted in the frequency range from 100 kHz to 10 mHz at 0 V (vs. open circuit). The cycling performance were measured by a GCD equipment (LANHE CT2001A, Wuhan LAND, China). The specific capacitance (C, F g−1) was obtained from galvanostatic discharge measurement by the following equation:
 | (2) |
The coin-cell asymmetric supercapacitors (ASC) were assembled by using KMnF3 particles as positive electrode and activated carbon (AC) as negative electrode in 2 M KOH aqueous solution with nonwoven fabric as separator. The negative electrode was prepared using the same method as used for the positive electrode. The mass ratio between the positive and negative electrodes of ASC for achieving charge balance was expressed as the following equation:
 | (3) |
The energy density (E, W h kg−1) and power density (P, W kg−1) were calculated using the following formulas:40
 | (4) |
 | (5) |
3. Results and discussion
3.1. Characterization of structure and morphology
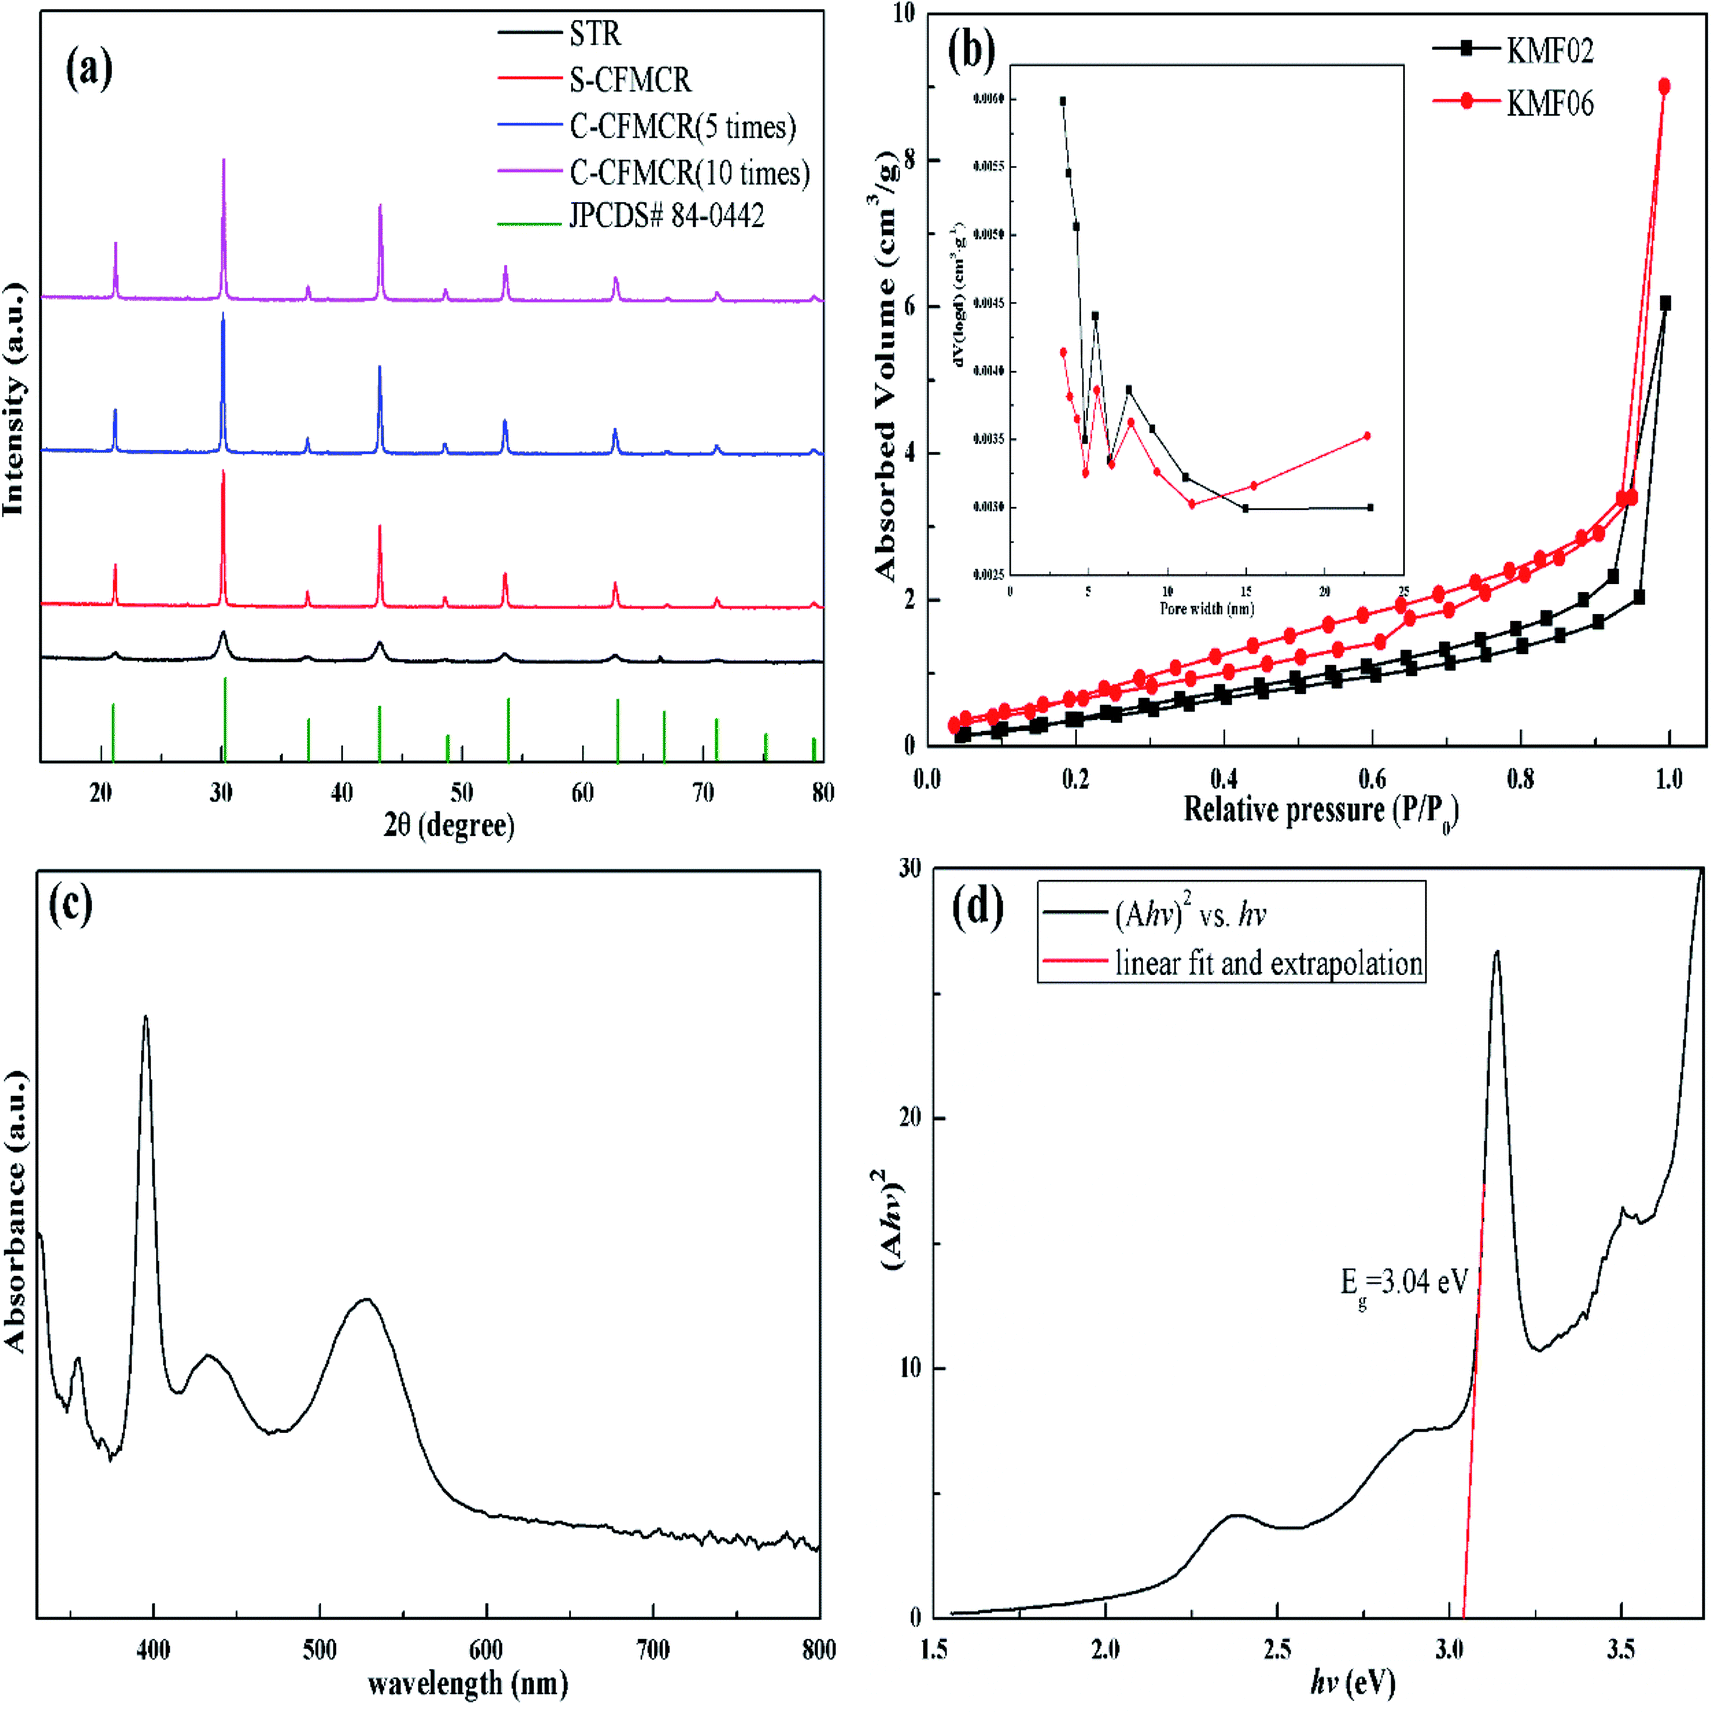
KMnF3 particles were synthesized in STR, one S-CFMCR and two C-CFMCRs with different magnification times (i.e., 5 and 10 times), respectively, under varying fluid flow rates, and their XRD patterns are demonstrated in Fig. 2a. All the diffraction peaks in each individual profile can be perfectly attributed to cubic pervoskite structure KMnF3 (JCPDS 84-0442) with space group of Pm![[3 with combining macron]](https://www.rsc.org/images/entities/char_0033_0304.gif) m. There was no significant distinction in XRD patterns for the KMnF3 samples prepared in S-CFMCR (labeled as KMF02, refer to Table 1) and in the integrated C-CFMCR with different magnification factors (KMF05 and KMF06), in which the highly crystalline nature of the materials were all confirmed. However, broadening and weaker peaks were observed for the sample prepared in STR in comparison to that prepared in microreactor-route, suggesting much poorer crystallinity for the STR sample. The textural properties and porosity of the KMF02 and KMF06 were evaluated by N2 absorption/desorption isotherms and pore size distributions. As illustrated in Fig. 2b, both samples showed typical type-IV isotherms with small hysteresis loop at relative pressure P/P0 = 0.2–1.0, revealing the existence of mesopores within them.41 Both precipitates exhibited narrow pore size distribution profiles with a maximum between 2 to 8 nm, which might be originated from the interspace among the aggregated particles (Fig. 3). The calculated BET surface area of KMF02 and KMF06 were 10.8 and 9.7 m2 g−1, respectively. Fig. 2c displays the UV-Vis absorption spectrum of KMnF3, indicating that KMnF3 absorbs light with wavelength shorter than 580 nm. The optical band gap of KMnF3 was estimated to be 3.04 eV by extrapolating the plot of (Ahv)2 versus photon energy (hv) (Fig. 2d) as proposed in pervious research.42,43
m. There was no significant distinction in XRD patterns for the KMnF3 samples prepared in S-CFMCR (labeled as KMF02, refer to Table 1) and in the integrated C-CFMCR with different magnification factors (KMF05 and KMF06), in which the highly crystalline nature of the materials were all confirmed. However, broadening and weaker peaks were observed for the sample prepared in STR in comparison to that prepared in microreactor-route, suggesting much poorer crystallinity for the STR sample. The textural properties and porosity of the KMF02 and KMF06 were evaluated by N2 absorption/desorption isotherms and pore size distributions. As illustrated in Fig. 2b, both samples showed typical type-IV isotherms with small hysteresis loop at relative pressure P/P0 = 0.2–1.0, revealing the existence of mesopores within them.41 Both precipitates exhibited narrow pore size distribution profiles with a maximum between 2 to 8 nm, which might be originated from the interspace among the aggregated particles (Fig. 3). The calculated BET surface area of KMF02 and KMF06 were 10.8 and 9.7 m2 g−1, respectively. Fig. 2c displays the UV-Vis absorption spectrum of KMnF3, indicating that KMnF3 absorbs light with wavelength shorter than 580 nm. The optical band gap of KMnF3 was estimated to be 3.04 eV by extrapolating the plot of (Ahv)2 versus photon energy (hv) (Fig. 2d) as proposed in pervious research.42,43
 | ||
| Fig. 2 Structure characterization: (a) XRD patterns, (b) N2 absorption/desorption (inset is pore size distributions) of different samples, (c) UV-Vis absorption spectrum and (d) corresponding (Ahv)2 vs. energy (hv) curve of a KMnF3 film. | ||
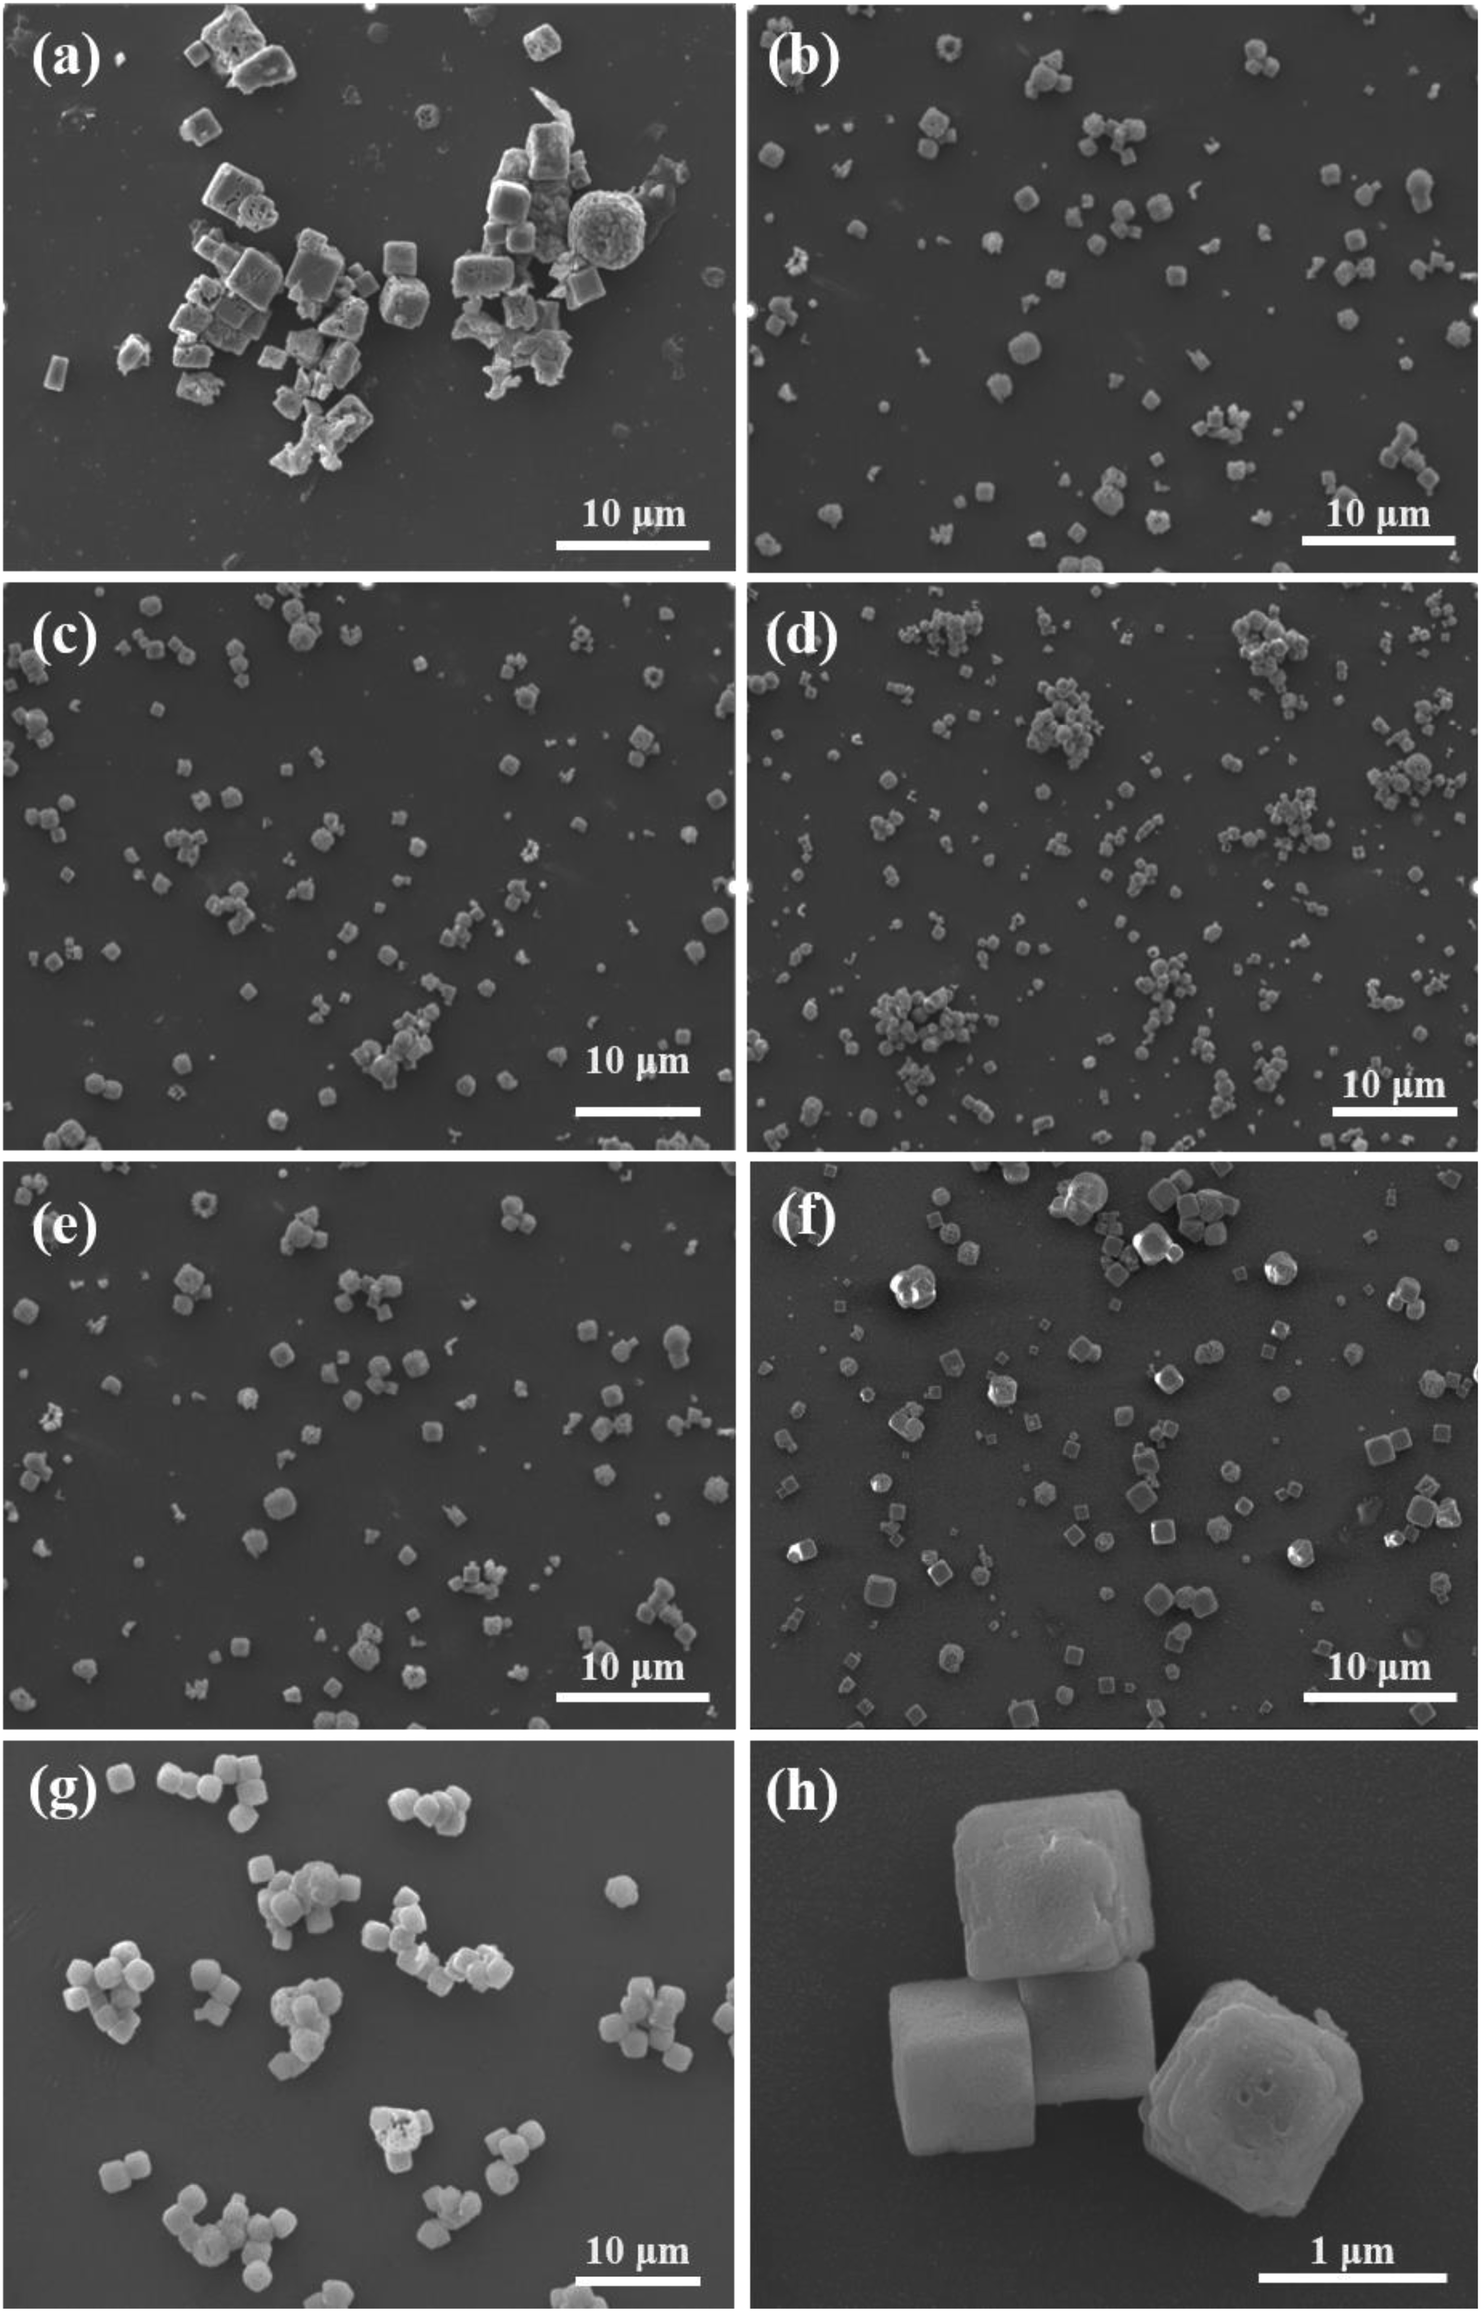 | ||
| Fig. 3 SEM images of KMnF3 particles prepared under different operating conditions: (a) KMF01, (b) KMF02, (c) KMF03, (d) KMF04, (e) KMF05, (f) KMF06, (g) KMF07 and (h) KMF02 under high resolution. | ||
The different reactors under varying operating conditions have different micromixing time tm (Table 1). Fig. 3 presents the SEM images of KMnF3 particles prepared under different conditions. The KMnF3 particles produced in S-CFMCR at a volumetric flow rate of 20 mL min−1 (Re = 788, Fig. 3a) had low crystallinity and incomplete growth of structure with relatively large size distribution. Along with the increasing volumetric flow rate (Fig. 3b–d), the obtained KMnF3 particles exhibited smaller and more uniform morphologies but different degree of agglomerations was observed at larger micromixing time scale (Fig. 3c and d). In accordance with the effect of operating parameters on the micromixing time of S-CFMCR (see Table 1), promoted morphology of precipitated KMnF3 particles was achieved under intensified micromixing performance (i.e., shorter micromixing time). The optimal volumetric flow rate for the precipitation of KMnF3 was found to be 40 mL min−1 in one single S-CFMCR, which showed the best micromixing efficiency at the same time. The strengthened micromixing performance would lead to higher level of supersaturation and more homogeneous distribution of dissipated energy, which would favor nucleation rather than growth process and consequently result in smaller and more uniform particles. The KMF02, KMF05 and KMF06 samples prepared in S-CFMCR, 5-times integrated C-CFMCR and 10-times integrated C-CFMCR, respectively, demonstrated similar morphology and insignificant agglomeration with uniform size of ∼1 μm (Fig. 3b, e and f), which were associated with their close micromixing time (Table 1) and also revealed the weak amplification effect from S-CFMCR to C-CFMCR. The precipitates prepared in STR (Fig. 3g) showed a slightly larger particle size and more severe aggregation in comparison with that prepared in S-CFMCR (Fig. 3b). That might be due to the different types of precipitation and micromixing behaviors between the two routes. During STR operations, the already generated precipitates remained in the stirred reactor throughout the whole process and kept contacting with the mother liquid, the freshly added reactants as well as newly formed particles. Therefore, the growth period of all particles in STR experienced a wide range of residence time, leading to the uneven size distribution as a consequence. By contrast, the residence time within the S-CFMCR was very short and the whole precipitation process was completed quickly under specified operating condition with desired micromixing performance. All the precipitates possessed almost the same residence time, local concentration, turbulent kinetic energy and same level of supersaturation, thus more uniform products were obtained in S-CFMCR and C-CFMCR. Fig. 3h displays clearly a cubic structure of the precipitates by SEM analysis with higher resolution, which agreed well with the XRD data. The EDX analysis with element distributions is illustrated in Fig. 4. There are no impurity peaks being observed, indicating high purity of the as-prepared samples.
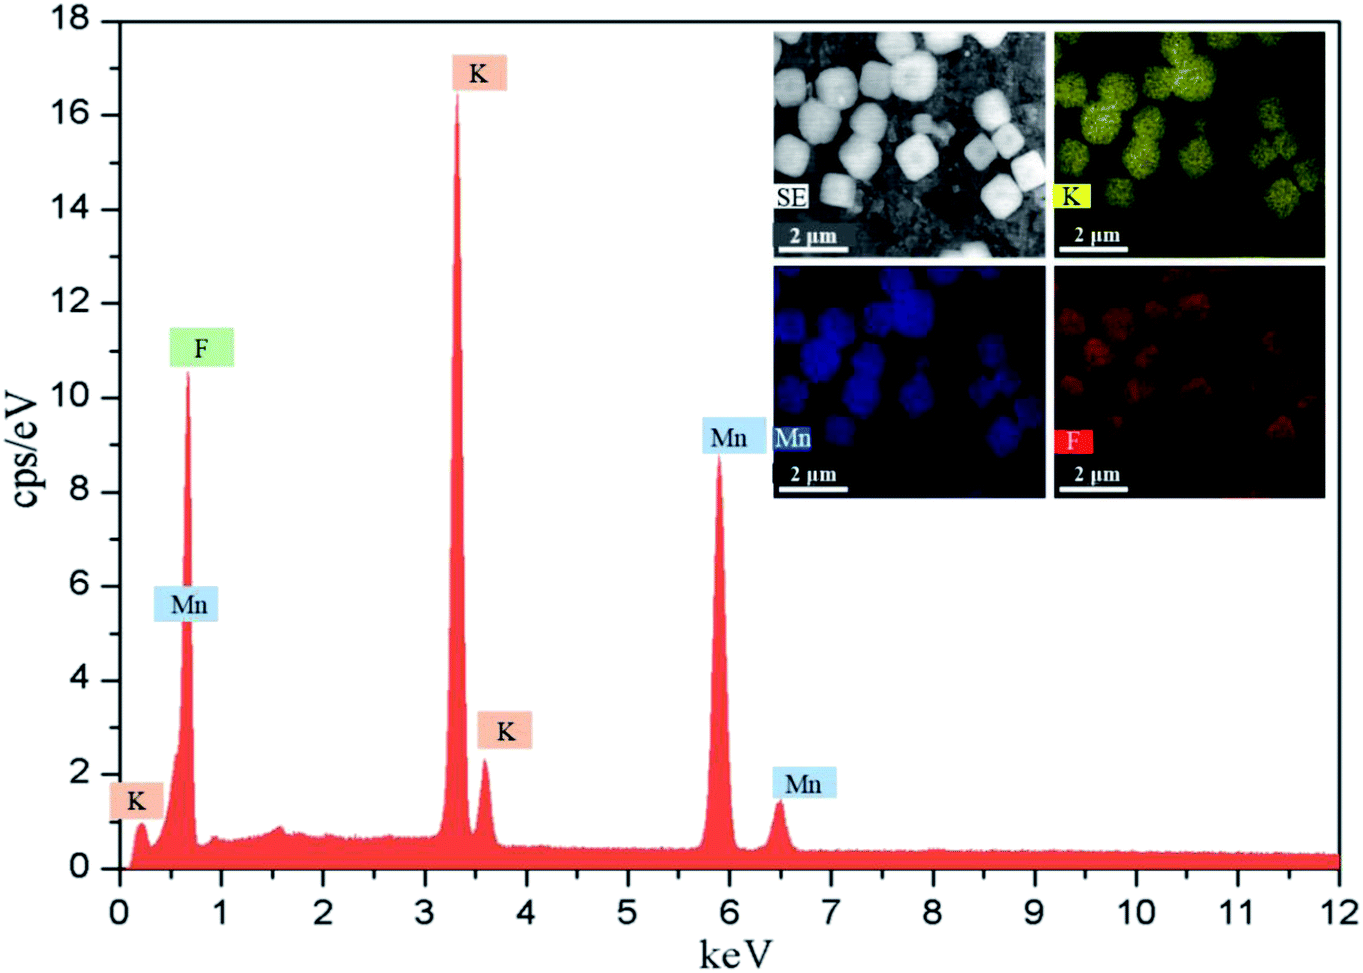 | ||
| Fig. 4 EDX spectrum with mapping of KMF02. | ||
3.2. Electrochemical characterization
The electrochemical behavior of KMF02 electrode material, which was prepared under the quickest micromixing in S-CFMCR and of improved morphology, was studied utilizing a typical three-electrode electrochemical system with 2 M KOH electrolyte. Fig. 5a gives the CV measurement curves over varying scanning rate (vs. Hg/HgO). As observed, the KMnF3 displayed a conspicuous characteristic of faradaic pseudocapacitor with a pair of distinct redox peaks. With the scanning rate increasing from 10 to 100 mV s−1 over a voltage of 0–0.6 V, the CV curves possessed similar shape, in which the positions of oxidation and reduction peaks shifted positively and negatively, respectively, revealing an excellent capacitive performance and quasi-reversibility of redox reactions on electrode.44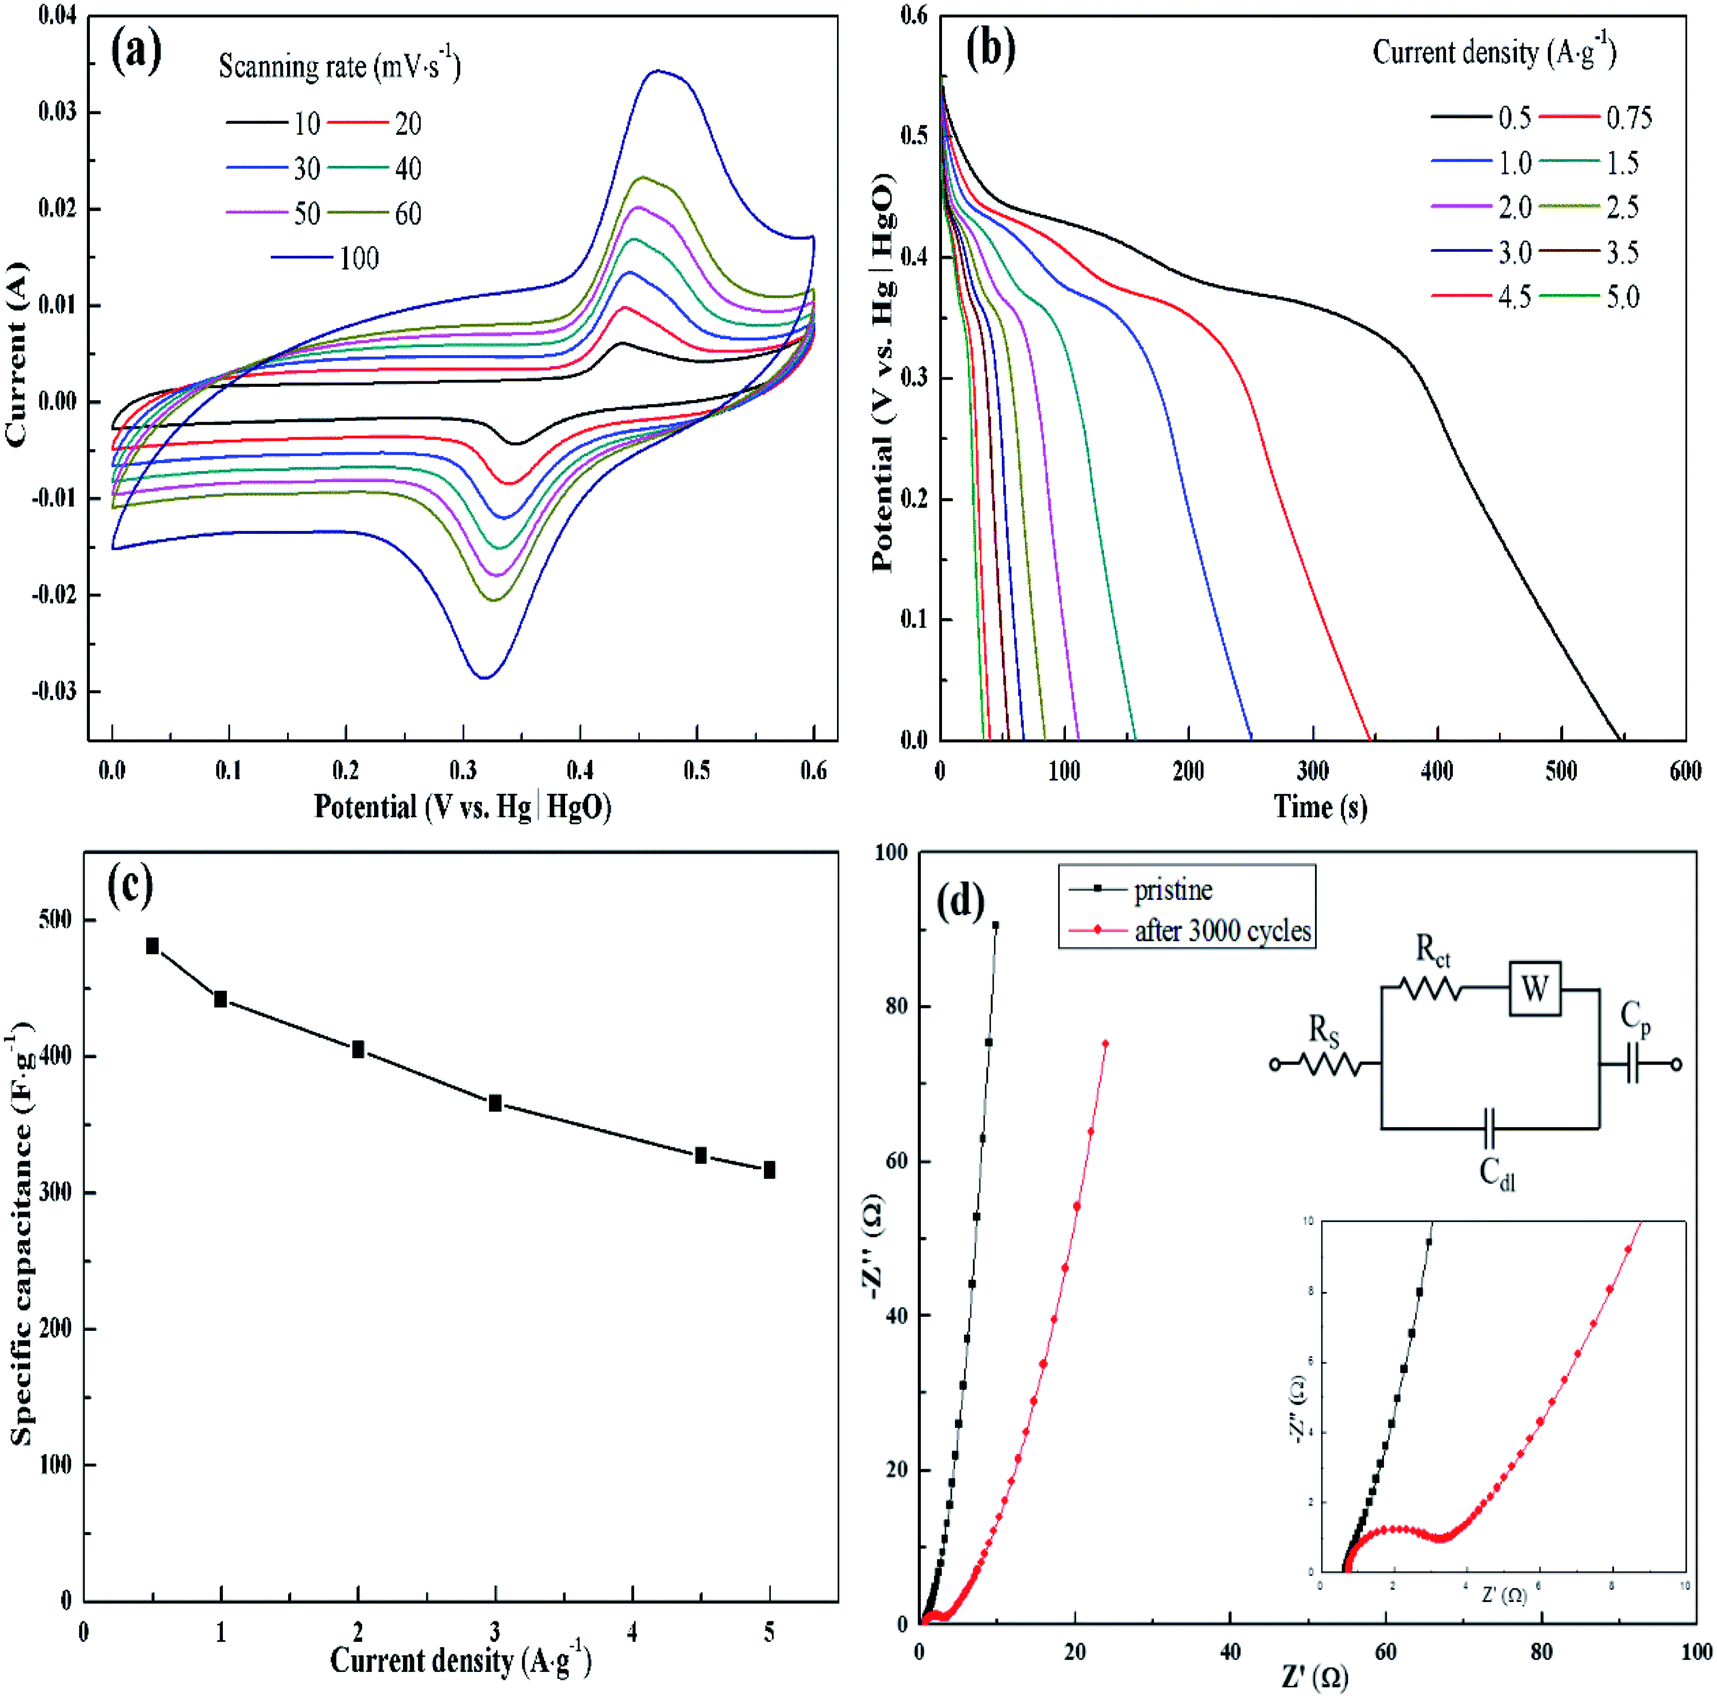 | ||
| Fig. 5 Electrochemical characterization of KMF02: (a) CV curves at different scan rates, (b) GCD curves at different current densities, (c) specific capacitances at different current densities, (d) Nyquist plots of EIS before and after 3000 cycles (inset is equivalent circuit diagram). | ||
Fig. 5b depicts the discharge curves of KMF02 recorded at different current densities, in which a distinct discharge voltage plateau around 0.3 V and a less dramatic discharge voltage plateau around 0.45 V can be observed. These voltage plateaus can be indexed to the cathodic peaks presented in Fig. 5a, which indicates that the charge–discharge processes of KMnF3 are primarily attributed to faradaic redox reactions and contribute to an outstanding capacitance nature as a result. The cathodic and anodic peaks in the CV curves can be attributed to faradaic redox reaction of Mn2+/Mn3+/Mn4+ in KOH solution. The corresponding specific capacitances calculated from eqn (2) are given in Fig. 5c, in which the KMnF3 electrode exhibited a specific capacitance of 481, 442, 405.1, 365.6, 327.3 and 316.5 F g−1 at a current density of 0.5, 1, 2, 3, 4.5 and 5 A g−1, respectively, indicating a high rate capability. The capacitance of KMnF3 outperforms most similar materials, such as SrMnO3,23 LaMnO3 (ref. 45) and BaMnF4.29
The EIS spectra corresponding to the as-prepared KMnF3 electrode and cycled electrode, for characterizing its impedance behavior, are shown in Fig. 5d. The high frequency intersection with X axis denotes the internal resistance (Rs), including the ionic resistance of electrolyte, inherent resistance of active material, and the contact resistance between active material and electrolyte.46 The Rs of the KMF02 electrode material as-prepared and after 3000 cycles were 0.67 and 0.75 Ω, respectively. The low Rs of KMnF3 electrode material indicates its excellent diffusion ability. The diameter of the semicircle showed in the higher frequency implies the charge transfer resistance (Rct) of the redox reaction at the electrode/electrolyte interface. It could be noticed that the simulated Rct of KMF02 electrode material increased significantly (from 0.27 to 2.23 Ω) after 3000 charge–discharge cycles, which might be ascribed to the partial exfoliation of active materials from the substrate during the long charge–discharge process.
The electrochemical properties of KMnF3 obtained under various operating parameters were also assessed by GCD measurement at a current density of 1 A g−1. The change of specific capacitance with micromixing time is illustrated in Fig. 6a. Overall, decreasing micromixing time would improve the specific capacitance. In accordance with the effects of micromixing time on the morphology of the prepared particles, KMF02, KMF05 and KMF06, which were synthesized with close micromixing time and the same volumetric flow rate in each individual channel (40 mL min−1), showed similar specific capacitances, indicating a negligible amplification effect from S-CFMCR to C-CFMCR. It is well known that the electrochemical performances of electrode material are greatly determined by its particle size and degree of agglomeration, which are strongly affected by the micromixing efficiency as well as the level of supersaturation during the preparation process. It was found that the specific capacitances of electrode materials precipitated either at low volumetric flow rate (KMF01) or at high volumetric flow rate (KMF03 and KMF04) were relatively low. Such phenomenon was caused by the mixing characteristics of S-CFMCR, in which the mixing behavior occurrs primarily in the convection zone of the two injected fluids. As the feed rate was too low, the flow of the two fluids was too weak to collide with each other and might flow out of the exit from their respective side, leading to poor micromixing and uneven distribution of energy dissipation. On the other hand, if the feed rate was too high, the injected streams would impact strongly and part of the reactants would sputter out without mixing with each other due to the unconfined exit of the reactor, which also resulted in a low micromixing performance as well as waste of energy. In addition, the poor performance of KMF01 in specific capacitance may also be ascribed to its anomalous morphology (Fig. 3a). Thus, an appropriate injecting volumetric flow rate must be selected to assure not only fast micromixing but also enough momentum acted on the buffer zone (Fig. 1d) to achieve uniform distribution of fluids into the assembled S-CFMCRs and weaken the magnification effect consequently. Therefore, a volumetric flow rate of 40 mL min−1 (correspond to Re = 1576 and a flow velocity of 2.36 m s−1) in each single channel was chosen as the optimal operating condition for S-CFMCR and C-CFMCR.
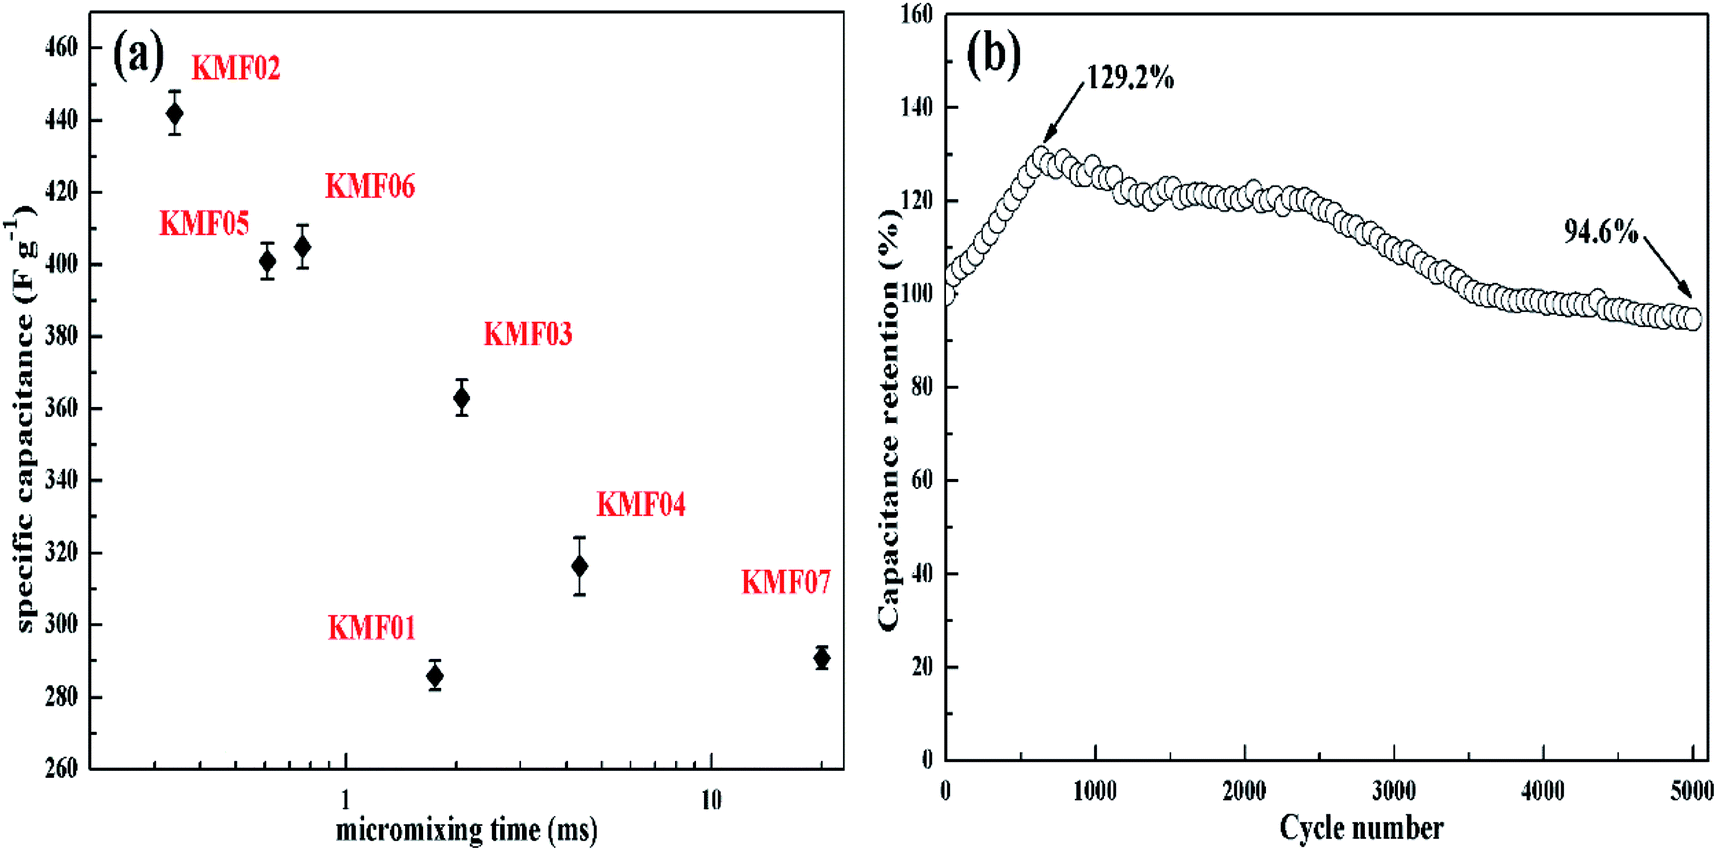 | ||
| Fig. 6 (a) The specific capacitances of KMnF3 prepared with different micromixing time as referred to Table 1, (b) the cycling lifetime of KMF02 at a discharge current density of 5 A g−1. | ||
The cycling performance of KMF02 was studied at a constant current density of 5 A g−1 (Fig. 6b). The specific capacitance of KMF02 electrode material was observed to be increasing continuously in the first 650 cycles and could reach ∼129.2% as compared with the starting cycle. It is due to the electro-activation or preconditioning of the electrodes by continuous intercalation and deintercalation of the active species on respective sites, as reported in other researchers' work.47–50 After that, the specific capacitance decreased gradually and still retained ∼94.6% of the initial specific capacitance after 5000 cycles. The dramatical decrease of specific capacitance around 2500–3500 cycles may be ascribed to the intensive increase of charge transfer resistance (Fig. 5d).
As to the charge storage of KMnF3 electrode material in alkaline solution during the reversible reactions of Mn2+/Mn3+/Mn4+ transition, a large amount of OH− from electrolyte would be absorbed on the surface of electrode along with the oxidation of Mn2+ to Mn3+. In the next step, the excessive OH− was intercalated at the crystal surface through the diffusion of Mn3+ and Mn3+ was oxidized into Mn4+ to generate H2O. The inferred mechanism of energy storage is described by the following equations (eqn (6) and (7))21,29 and illustrated in Fig. 7.
| KMn2+F3 + OH− ↔ K[Mn1.5δ2+;Mn1−δ3+](OH)F3 + e− | (6) |
| K[Mn1.5δ2+;Mn1−δ3+](OH)F3 + OH− ↔ K[Mnδ3+;Mn1−0.75δ4+]OF3 + H2O + e− | (7) |
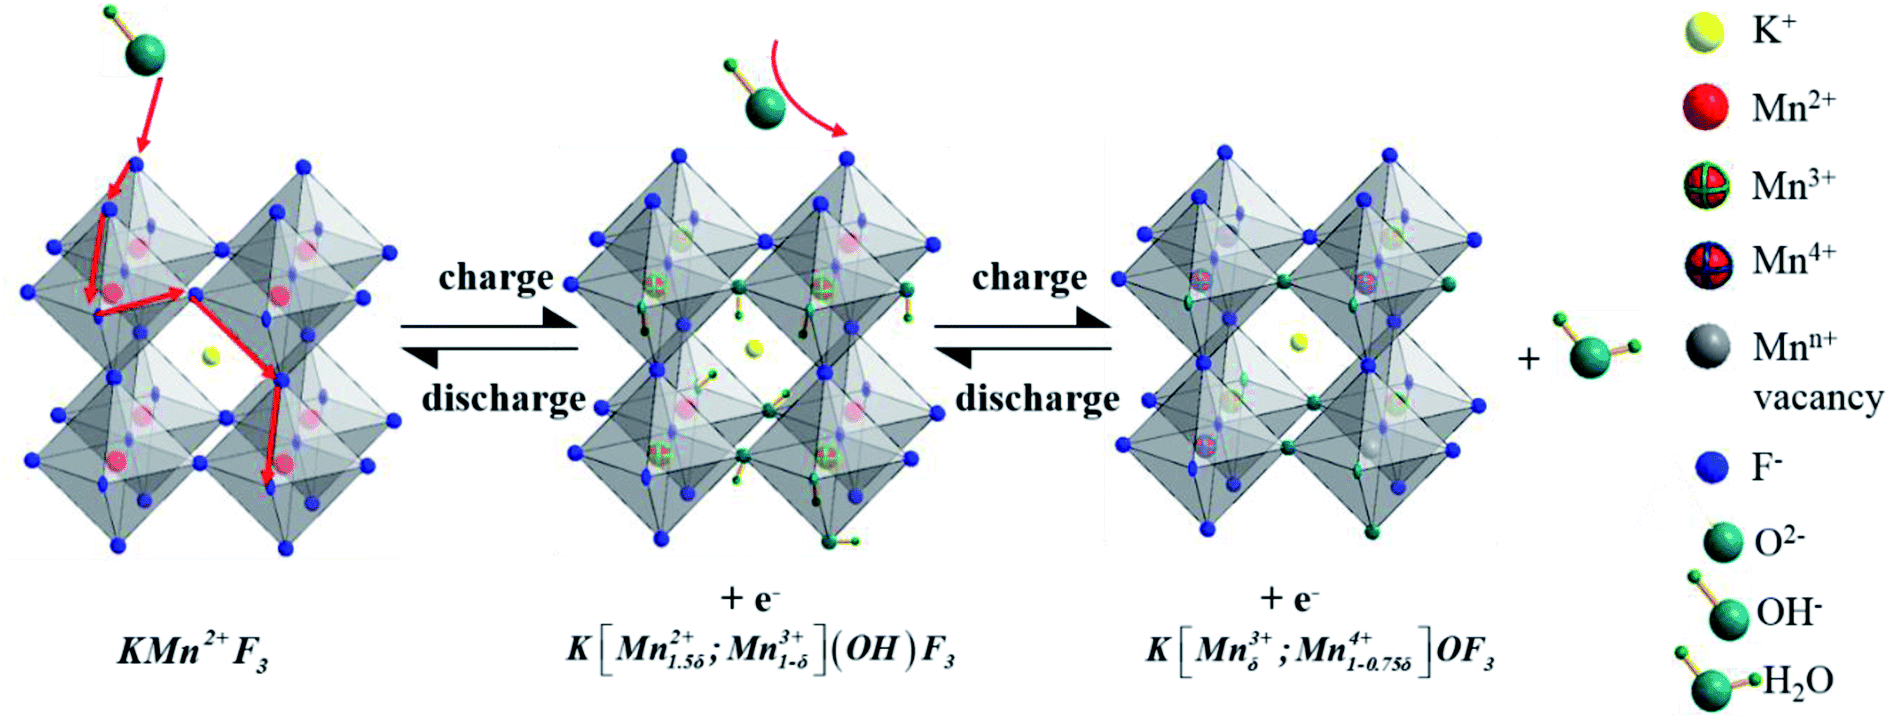 | ||
| Fig. 7 Charge storage mechanism diagram of KMnF3 samples. | ||
To explore the variation of the oxidation state of manganese in the charge storage process, XPS measurement was carried out on KMF02 electrodes after 100 and 3000 cycles, respectively, and the XPS results were compared with that of the as-prepared material. Fig. 8b presents the overall XPS spectrum of the KMF02 sample at a combined energy ranging from 0 to 1000 eV, which confirmed the presence of Mn, K, and F in the as-prepared sample. The Mn 2p XPS spectrum exhibited two prominent peaks at 642.1 and 653.5 eV (Fig. 8b), which are assigned to Mn 2p2/3 and Mn 2p1/2 spin state, respectively.45 For quantitative analysis, the peaks at 641.3 eV for Mn 2p2/3 and 652.7 eV for Mn 2p1/2 were assigned to Mn2+ state, the peaks at 642.7 eV and 654.4 eV were fitted to the Mn3+ state, and the peaks at 645.2 eV and 657.1 eV with an energy separation of 11.9 eV were typical Mn4+ state (Fig. 8a).51,52 Fig. 8c presents the relative content of different state of manganese in Mn 2p spectrum of KMF02 electrodes after 100 and 3000 cycles. Compared to the state of manganese after the discharge process of 100 cycles, the content of Mn2+ was reduced by 11.7% and Mn4+ content increased by 12.0% while Mn3+ content remained almost unchanged after 3000 cycles, which was due to the oxidation of lower binding energy components and corresponded to the variation of valence state of manganese in Fig. 7. The significant increase of Mn4+ content after 3000 cycles may be responsible for the dramatic reduction of specific capacitance by weakening the electron conductivity, as reported in other publications.53–55
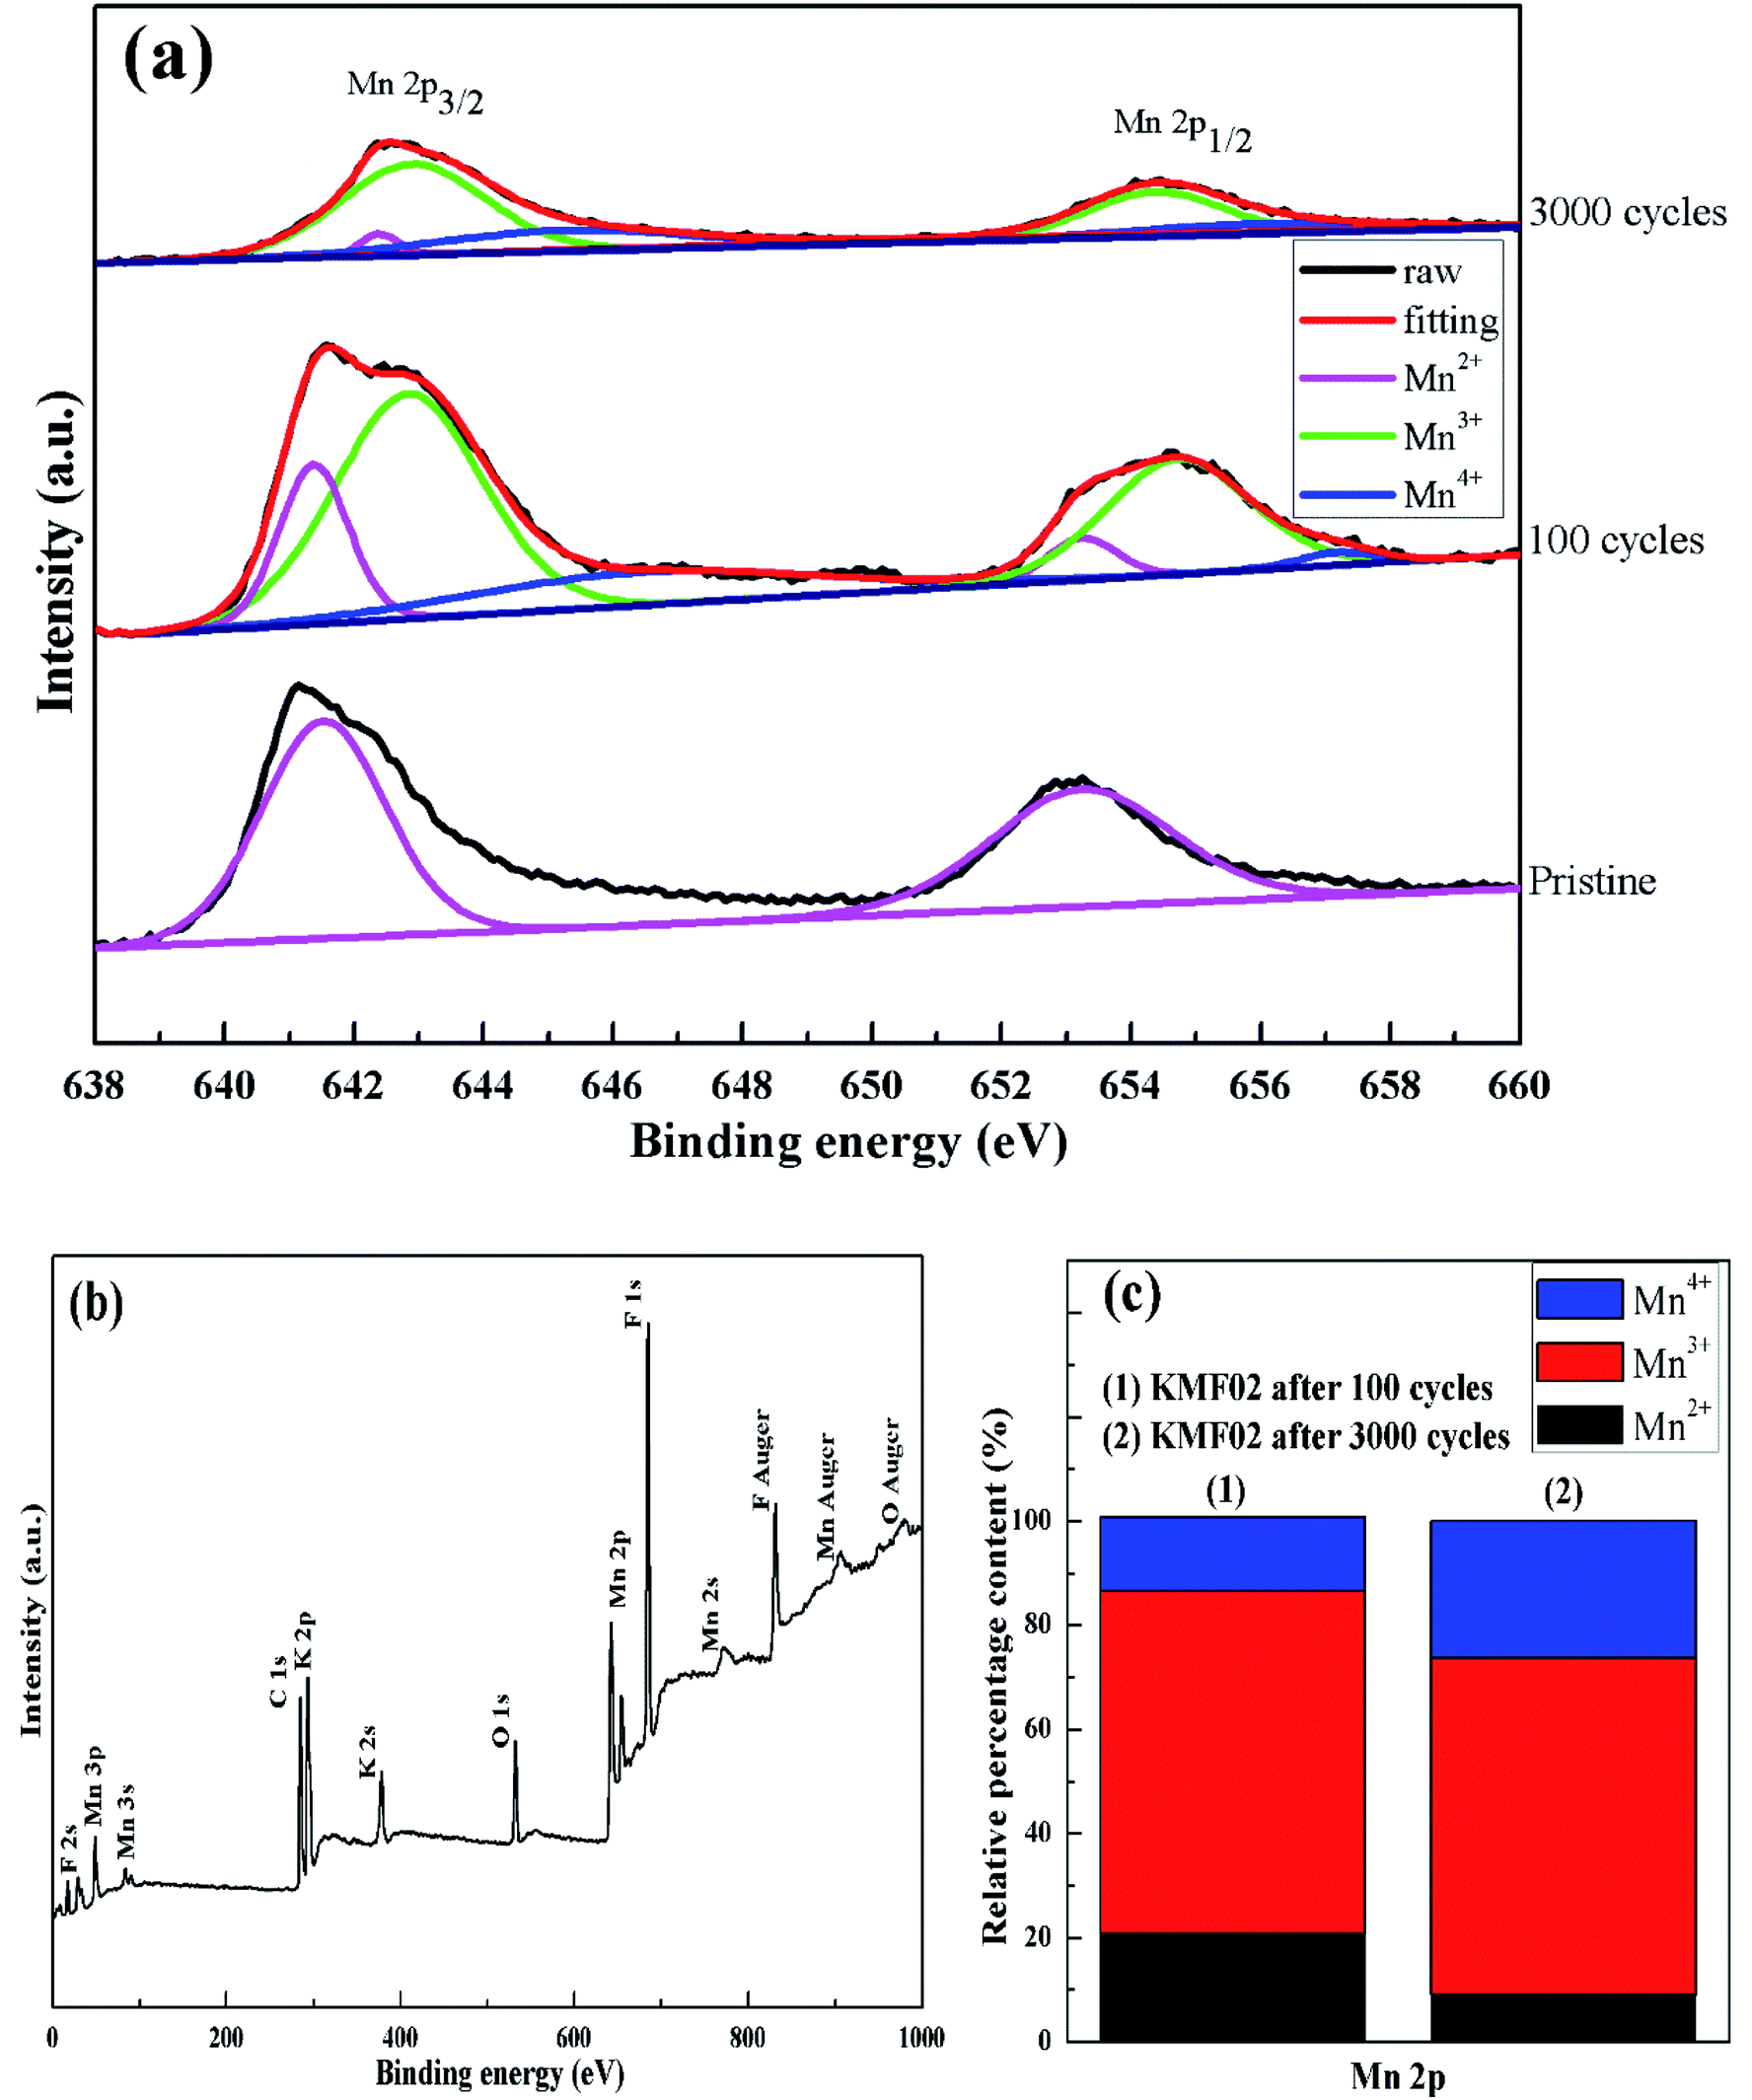 | ||
| Fig. 8 XPS studies of KMF02: (a) XPS survey spectrum, (b) Mn 2p XPS spectrum of KMF02 cycled from 0–3000 times, (c) relative content of Mn species calculated from XPS spectrum. | ||
To further evaluate the practical application of the as-synthesized materials for supercapacitor, a solid-state asymmetric supercapacitor (ASC) was assembled to test its electrochemical performances, using KMF02 as positive electrode and activated carbon (AC) as negative electrode, respectively. The construction of ASC is illustrated in Fig. 9a, where 2 M KOH and nonwoven slice were employed as electrolyte and separator, respectively. Fig. 9b presents CV analyses of the negative and positive electrodes separately, showing 164 F g−1 of the negative electrode (AC). Hence, the calculated mass ratio of the positive and negative electrodes was 0.67 according to eqn (3). Fig. 9c gives the CV curves of the optimized ASC at various scan rates. A pair of broad redox peaks and no evident change in shape was observed with increasing scan rate, revealing fast charge–discharge ability.56 GCD tests of the ASC at various current densities at a voltage window of 0–1.55 V are presented in Fig. 9d. Linear profile with nearly triangular symmetric shape indicated a pseudo-capacitance with good reversibility and stability. The specific capacitance of the assembled ASC was calculated through eqn (2) and found to be 39.2, 29.6, 27.2 26.5 and 22.6 F g−1 at the current densities of 0.5, 1, 1.5, 2 and 5 A g−1, respectively. Additionally, 81.2% of the initial specific capacitance was still retained after 5000 cycles (Fig. 9e), which suggested superior stability of KMnF3//AC asymmetric supercapacitors. Meanwhile, the ACS device could deliver an energy density of 13.1 W h kg−1 at a power density of 386.3 W kg−1. When the power density increased to 3881.0 W kg−1, the device delivered a decreased energy density to 8.8 W h kg−1. The performance of an ASC depends strongly on its negative electrode (activated carbon with a specific capacitance of 164 F g−1 was used in this work) and can be promoted with higher energy density and power density with improved negative electrodes. These results are compatible as compared to previously reported similar perovskite-like or manganese based supercapacitors.45,57–59
 | ||
| Fig. 9 ASC tests: (a) schematic of the assembled asymmetric supercapacitor, (b) CV curves of KMnF3 and AC at a scan rate of 10 mV s−1, (c) CV and (d) GCD curves of KMnF3//AC device at different scan rates and current densities, respectively, over a potential window of 0–1.55 V, (e) the cycling performance of KMnF3//AC device at a current density of 1 A g−1, (f) Ragone plot of the KMnF3//AC device. | ||
4. Conclusions
In this study, a clustered countercurrent-flow micro-channel reactor (C-CFMCR) with adjustable magnifications was assembled by numbering up its counterpart (S-CFMCR). C-CFMCRs were then employed to synthesize highly-crystallized KMnF3 under varying operating conditions with different micromixing time. The prepared KMnF3 was used as electrode material for supercapacitor. It was found that the micromixing time played a key role in the precipitation process and KMnF3 samples obtained under close micromixing time possessed similar morphologies and electrochemical properties, and decreasing micromixing time would lead to more even size distribution as well as element distribution of the precipitates and consequently higher specific capacitance. The KMnF3 particles prepared under optimal conditions displayed a specific capacitance of 442 F g−1 at the current densities of 1 A g−1 with excellent cycling stability. Moreover, the as-assembled KMnF3//AC asymmetric capacitor delivered an energy density of 13.1 W h kg−1 at a power density of 386.3 W kg−1 over a wide voltage window of 0–1.55 V, and also exhibited superior lifetime with 81.2% retention of the initial specific capacitance after 5000 cycles. Additionally, the KMnF3 samples prepared in S-CFMCR and C-CFMCR under optimal conditions presented superior morphology and electrochemical performance than that prepared in STR. Only a weak amplification effect of S-CFMCR to 5-times integrated C-CFMCR and 10-times assembled C-CFMCR on their application for the co-precipitation process of KMnF3 was observed. These results indicated that C-CFMCR is a promising technology for the controllable and massive precipitation of nano/ultrafine materials.Conflicts of interest
There are no conflicts of interest to declare.Acknowledgements
The authors gratefully acknowledge the financial support by the National Key R&D Program of China (no. 2017YFB0307202), the Major Project of National Science and Technology from China (no. 2018ZX09721002-002) and the National Natural Science Foundation of China (no. 21576012).References
- L. Zhang, X. Hu, Z. Wang, F. Sun and D. G. Dorrell, Renewable Sustainable Energy Rev., 2018, 81, 1868–1878 CrossRef.
- H. J. Sim, C. Choi, D. Y. Lee, H. Kim, J.-H. Yun, J. M. Kim, T. M. Kang, R. Ovalle, R. H. Baughman, C. W. Kee and S. J. Kim, Nano Energy, 2018, 47, 385–392 CrossRef CAS.
- Z. Fu, Z. Li, P. Si and F. Tao, Int. J. Hydrogen Energy, 2019, 44, 22146–22159 CrossRef CAS.
- Z. Bououchma, J. Sabor and H. Aitbouh, Mater. Today: Proc., 2019, 13, 688–697 Search PubMed.
- T. Tang, S. Cui, W. Chen, H. Hou and L. Mi, Nanoscale, 2019, 11, 1728–1736 RSC.
- B. E. Conway, Electrochemical Supercapacitors, Kluwer Academic/Plenum, New York, 1999, ch 2 Search PubMed.
- P. C. Banerjee, D. E. Lobo, R. Middag, W. K. Ng, M. E. Shaibani and M. Majumder, ACS Appl. Mater. Interfaces, 2015, 7, 3655–3664 CrossRef CAS PubMed.
- Y. Wang, Y. Lu, K. Chen, S. Cui, W. Chen and L. Mi, Electrochim. Acta, 2018, 283, 1087–1094 CrossRef CAS.
- X. Dong, H. Jin, R. Wang, J. Zhang and J. Lu, Adv. Energy Mater., 2018, 8, 1702695 CrossRef.
- Z. Tang, C. H. Tang and H. Gong, Adv. Funct. Mater., 2012, 22, 1272–1278 CrossRef CAS.
- Z. Kai, H. Xiaopeng, H. Zhe, Z. Xiaolong and T. Zhanliang, Chem. Soc. Rev., 2015, 46, 699–728 Search PubMed.
- Q. Bai, Q. Xiong, C. Li, Y. Shen and H. Uyama, Appl. Surf. Sci., 2018, 455, 795–807 CrossRef CAS.
- Y. Chen, C. Chen, R. Lv, W. Shen, F. Kang, N. Tai and Z. Huang, Chin. Chem. Lett., 2018, 29, 616–619 CrossRef CAS.
- Z. Algharaibeh, X. Liu and P. G. Pickup, J. Power Sources, 2009, 187, 640–643 CrossRef CAS.
- D. Ghosh and C. K. Das, ACS Appl. Mater. Interfaces, 2015, 7, 1122–1131 CrossRef CAS PubMed.
- V. Khomenko, E. Raymundo-Piñero and F. Béguin, J. Power Sources, 2006, 153, 183–190 CrossRef CAS.
- C. Zhu, P. Yang, D. Chao, X. Wang, X. Zhang, S. Chen, B. K. Tay, H. Huang, H. Zhang, W. Mai and H. J. Fan, Adv. Mater., 2015, 27, 4566–4571 CrossRef CAS PubMed.
- W. Wei, W. Ye, J. Wang, C. Huang, J. Xiong, H. Qiao, S. Cui, W. Chen, L. Mi and P. Yan, ACS Appl. Mater. Interfaces, 2019, 11, 32269–32281 CrossRef CAS PubMed.
- Y. Liu, J. Dinh, M. O. Tade and Z. Shao, ACS Appl. Mater. Interfaces, 2016, 8, 23774–23783 CrossRef CAS PubMed.
- K. Singh, R. Kannan and V. Thangadurai, Solid State Ionics, 2019, 339, 114951 CrossRef CAS.
- Z. A. Elsiddig, D. Wang, H. Xu, W. Zhang, T. Zhang, P. Zhang, W. Tian, Z. Sun and J. Chen, J. Alloys Compd., 2018, 740, 148–155 CrossRef CAS.
- H.-s. Nan, X.-y. Hu and H.-w. Tian, Mater. Sci. Semicond. Process., 2019, 94, 35–50 CrossRef CAS.
- G. George, S. L. Jackson, C. Q. Luo, D. Fang, D. Luo, D. Hu, J. Wen and Z. Luo, Ceram. Int., 2018, 44, 21982–21992 CrossRef CAS.
- N. Dimov, A. Nishimura, K. Chihara, A. Kitajou, I. D. Gocheva and S. Okada, Electrochim. Acta, 2013, 110, 214–220 CrossRef CAS.
- D. Cao, C. Yin, D. Shi, Z. Fu, J. Zhang and C. Li, Adv. Funct. Mater., 2017, 27, 1701130 CrossRef.
- M. Wei, C. Dai, Z. Shuang, J. Yang, L. Qi and Q. Xu, Mater. Lett., 2018, 27, 66–69 Search PubMed.
- B. P. Hahn, J. W. Long and D. R. Rolison, Acc. Chem. Res., 2013, 46, 1181–1191 CrossRef CAS PubMed.
- M. J Tyler, W. G. Hardin, D. Sheng, K. P. Johnston and K. J. Stevenson, Nat. Mater., 2014, 13, 726–732 CrossRef PubMed.
- Z. Shuang, H. Gao, Z. Cheng, Y. Jie and D. Shuai, J. Power Sources, 2017, 359, 585–591 CrossRef.
- Q. Tang, J. Shen, W. Zhou, J. Liu, Z. Liu and Y. Qian, Inorg. Chem. Commun., 2004, 7, 283–285 CrossRef CAS.
- S. L. Wang, W. L. Li, G. F. Wang, D. Y. Dong, J. J. Shi, X. Y. Li, P. G. Li and W. H. Tang, Powder Diffr., 2013, 28, S3–S6 CrossRef CAS.
- A. Oleaga, A. Salazar and D. Skrzypek, J. Alloys Compd., 2015, 629, 178–183 CrossRef CAS.
- H. C. Schwarzer and W. Peukert, AIChE J., 2010, 50, 3234–3247 CrossRef.
- B. K. Johnson and R. K. Prud'Homme, AIChE J., 2003, 49, 2264–2282 CrossRef CAS.
- X. Shi, Y. Xiang, L. X. Wen and J. F. Chen, Ind. Eng. Chem. Res., 2012, 51, 13944–13952 CrossRef CAS.
- O. Yi, X. Yang, H. Zou, G. Chu and J. Chen, Chem. Eng. J., 2017, 321, 533–545 CrossRef.
- R. Lafficher, M. Digne, F. Salvatori, M. Boualleg, D. Colson and F. Puel, Chem. Eng. Sci., 2018, 175, 343–353 CrossRef CAS.
- K.-P. Cheng, B. Wu, R.-J. Gu and L.-X. Wen, Micromachines, 2018, 9, 549 CrossRef PubMed.
- M. C. Fournier, L. Falk and J. Villermaux, Chem. Eng. Sci., 2014, 51, 5187–5192 CrossRef.
- M. Rajkumar, C.-T. Hsu, T.-H. Wu, M.-G. Chen and C.-C. Hu, Prog. Nat. Sci.: Mater. Int., 2015, 25, 527–544 CrossRef CAS.
- Y.-S. Lin and J.-G. Duh, J. Power Sources, 2011, 196, 10698–10703 CrossRef CAS.
- J. Liang, C. Wang, Y. Wang, Z. Xu, Z. Lu, Y. Ma, H. Zhu, Y. Hu, C. Xiao and X. Yi, J. Am. Chem. Soc., 2016, 138, 15829–15832 CrossRef CAS PubMed.
- I. Chung, B. Lee, J. He, R. P. H. Chang and M. G. Kanatzidis, Nature, 2012, 485, 486–489 CrossRef CAS PubMed.
- J. Xu, L. Gao, J. Cao, W. Wang and Z. Chen, Electrochim. Acta, 2010, 56, 732–736 CrossRef CAS.
- S. Nagamuthu, S. Vijayakumar and K. S. Ryu, Mater. Chem. Phys., 2017, 199, 543–551 CrossRef CAS.
- X. W. Wang, Q. Q. Zhu, X. E. Wang, H. C. Zhang, J. J. Zhang and L. F. Wang, J. Alloys Compd., 2016, 675, 195–200 CrossRef CAS.
- K. Y. Chen, G. J. Li, Y. J. Wang, W. H. Chen and L. W. Mi, Green Energy Environ., 2020, 5, 50–58 CrossRef.
- P. M. Shafi, R. Dhanabal, A. Chithambararaj, S. Velmathi and A. C. Bose, ACS Sustainable Chem. Eng., 2017, 5, 4757–4770 CrossRef CAS.
- M. A. Bissett, I. A. Kinloch and R. A. W. Dryfe, ACS Appl. Mater. Interfaces, 2015, 7, 17388–17398 CrossRef CAS PubMed.
- J. Yang, M. Ma, C. Sun, Y. Zhang, W. Huang and X. Dong, J. Mater. Chem. A, 2015, 3, 1258–1264 RSC.
- C. Zhang, C. Wang, W. Zhan, Y. Guo, Y. Guo, G. Lu, A. Baylet and A. Giroir-Fendler, Appl. Catal., B, 2013, 129, 509–516 CrossRef CAS.
- Y. Chai, Z. Li, J. Wang, Z. Mo and S. Yang, J. Alloys Compd., 2019, 775, 1206–1212 CrossRef CAS.
- T. Tabari, D. Singh, A. Calisan, M. Ebadi, H. Tavakkoli and B. Caglar, Ceram. Int., 2017, 17, 15970–15977 CrossRef.
- J. T. Mefford, W. G. Hardin, S. Dai, K. P. Johnston and K. J. Stevenson, Nat. Mater., 2014, 13, 726–732 CrossRef CAS PubMed.
- D. Srivastava, F. Azough, R. Freer, E. Combe, R. Funahashi, D. M. Kepaptsoglou, Q. M. Ramasse, M. Molinari, S. R. Yeandel, J. D. Baran and S. C. Parker, J. Mater. Chem. C, 2015, 3, 12245–12259 RSC.
- J. Zhang, F. Liu, J. P. Cheng and X. B. Zhang, ACS Appl. Mater. Interfaces, 2015, 7, 17630–17640 CrossRef CAS PubMed.
- H. Mo, H. Nan, X. Lang, S. Liu, L. Qiao, X. Hu and H. Tian, Ceram. Int., 2018, 44, 9733–9741 CrossRef CAS.
- S. Mothkuri, S. Chakrabarti, H. Gupta, B. Padya, T. N. Rao and P. K. Jain, Mater. Today: Proc., 2019 DOI:10.1016/j.matpr.2019.03.236.
- M. Huang, Y. Zhang, F. Li, L. Zhang, Z. Wen and Q. Liu, J. Power Sources, 2014, 252, 98–106 CrossRef CAS.
| This journal is © The Royal Society of Chemistry 2020 |