 Open Access Article
Structural studies of two capsaicinoids: dihydrocapsaicin and nonivamide. 13C and 15N MAS NMR supported by genetic algorithm and GIAO DFT calculations
Paweł Siudem *a,
Jarosław Bukowickia,
Iwona Wawerb and
Katarzyna Paradowskaa
aDepartment of Physical Chemistry, Faculty of Pharmacy, Medical University of Warsaw, Banacha 1, PL-02097 Warsaw, Poland. E-mail: pawel.siudem@wum.edu.pl; Fax: +48 22 5720 950; Tel: +48 22 5720 950
bThe State Higher Vocational School, Rynek 1, PL-38400 Krosno, Poland
First published on 11th May 2020
Abstract
Capsaicinoids are alkaloid type capsaicin analogs with prospective pharmacological activity. However their solid state conformations have not been studied yet. As part of the study, cross polarization (CP) magic angle spinning (MAS) solid state 13C and 15N NMR spectra of dihydrocapsaicin (DHCAP) and nonivamide (NVA) were recorded. Solid state chemical shifts differ from their solution counterparts; remarkable differences occur for carbons C2′, C6′ and C7′ linked to C1′ in DHCAP and with methylene carbons C4–C8 in NVA. The doubling of some resonances in the spectra of solid NVA indicates that there are two molecules in the crystallographic asymmetric unit. DFT GIAO calculations of shielding constants were performed for several geometric isomers, including molecules with different orientations of aliphatic chain with respect to aromatic ring. Low-energy conformers were found by genetic algorithm methodology. Comparison of experimental 13C chemical shifts with theoretical (GIAO DFT) shielding parameters was helpful in predicting the most reliable geometry in the solid state. Cross polarization time constants TCP and relaxation times in the rotating frame TH1ρ were obtained from variable-contact cross-polarization experiments. TH1ρ are longer in the order: NVA < CAP < DHCAP.
Introduction
Capsaicin (8-methyl-N-vanillyl-6-nonenamide) is a pungent alkaloid found in chili pepper fruit. Over the last decades, it has been described as a multipotent bioactive compound.1 According to these studies, many new capsaicin analogs with expected biological activity were sought. Nonivamide (NVA) and dihydrocapsaicin (DHCAP) (Fig. 1) are two derivatives of capsaicin (CAP)2,3 which can be found as a component of analgesic drugs or pepper spray;4 they are also used in pain-killer cream and patches.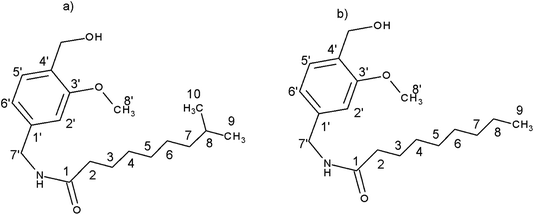 | ||
| Fig. 1 Structure of (a) dihydrocapsaicin (DHCAP) and (b) nonivamide (NVA) with numbering of carbon atoms. | ||
Pharmacological properties of potential drug substances, crucial for modern pharmaceutical sciences, are widely studied using spectroscopic and theoretical methods. The biological activity of a compound defined by the affinity of a small-molecule ligand towards the macromolecular receptor can be explored using in silico methods, like the molecular docking approach. The docking process involves prediction of multiple structural conformations in a binding pocket as a basic step. However, solid state conformation analysis is also very important, because the majority of dosage forms are solid dosage forms and solid state conformation is connected with pharmacokinetic properties of an API (Active Pharmaceutical Ingredient). Therefore, low energy conformations of capsaicinoids, as well as their solid-state structure are of interest and should be studied in detail.
Crystallographic data for nonivamide and dihydrocapsaicin do not exist. Since all our attempts to obtain single crystals of capsaicinoids suitable for XRD measurement have been unsuccessful, solid-state NMR is proposed as a method for structure determination for these substances. NMR spectroscopy supported by theoretical calculations was used as the main method of structural studies. This approach was previously applied by us in the study on capsaicin structure5 and the results were compared with PXRD data. To the best of our knowledge, this work is the first to focus on the solid-state structure of nonivamide and dihydrocapsaicin. Our results may be a step towards determination of the conformation – bioavailability relationship, because neither the conformations nor the crystal structures of these capsaicinoids have been described before.
Methods
Materials
NVA (nonivamide) and DHCAP (dihydrocapsaicin) were purchased from Sigma-Aldrich (Aldrich no. V9130 and M1022 respectively).13C CPMAS NMR spectroscopy
The 13C and 15N magic angle spinning (MAS) NMR spectra of solid samples were recorded on a Bruker DRX-400 Advance spectrometer using a Bruker PH MAS VTN 400WB BL4 probehead. Samples packed in a 4 mm ZrO2 rotor were spun at 10 kHz (13C) and 5 kHz (15N). Contact time of 2.5 ms, repetition time of 10 s and spectral width of 20 kHz were used for accumulation of 200 scans for standard 13C MAS experiments. For the acquisition of 15N MAS spectra these parameters were: 5 ms, 10 s and 12![[thin space (1/6-em)]](https://www.rsc.org/images/entities/char_2009.gif) 000 scans, respectively. 13C chemical shifts were calibrated indirectly through the glycine CO signal recorded at 176.0 ppm, relative to TMS. 15N chemical shifts were calibrated through the glycine NH signal δ 15N 10.0 ppm and referenced to nitromethane δ 15N = 380.2 ppm (liquid NH3 δ 15N = 0). Solid-state NMR cross-polarization (CP) 1H–13C experiments were performed with contact times in the range from 25 μs to 18 ms.
000 scans, respectively. 13C chemical shifts were calibrated indirectly through the glycine CO signal recorded at 176.0 ppm, relative to TMS. 15N chemical shifts were calibrated through the glycine NH signal δ 15N 10.0 ppm and referenced to nitromethane δ 15N = 380.2 ppm (liquid NH3 δ 15N = 0). Solid-state NMR cross-polarization (CP) 1H–13C experiments were performed with contact times in the range from 25 μs to 18 ms.
Genetic algorithm
A conformational search was carried for each molecule using genetic algorithm (GA) with multimodal optimization. Special software (ALJAR05) was developed for the calculations and used as described earlier.6 Each conformation was first optimized using molecular mechanics (MMFF94 force field) to classify the conformers found by the genetic algorithm methodology.GIAO DFT calculations
Further calculations of NMR shielding constants were performed using the DFT method with the B3LYP functional and the 6-311G(d,p) basis set (Gaussian 09 software7). Values of chemical shifts for each conformation were obtained in two ways: (i) by calculating TMS carbon atoms shielding constants and using the equation δiso = σTMS − σiso and (ii) by converting shielding constants with scaling factors.8 The model conformers were verified by comparing calculated shielding constants with experimental MAS NMR chemical shifts. For 15N NMR, the reference molecule nitromethane was also optimized and its isotropic NMR shielding constants were calculated.Results and discussion
13C CPMAS NMR
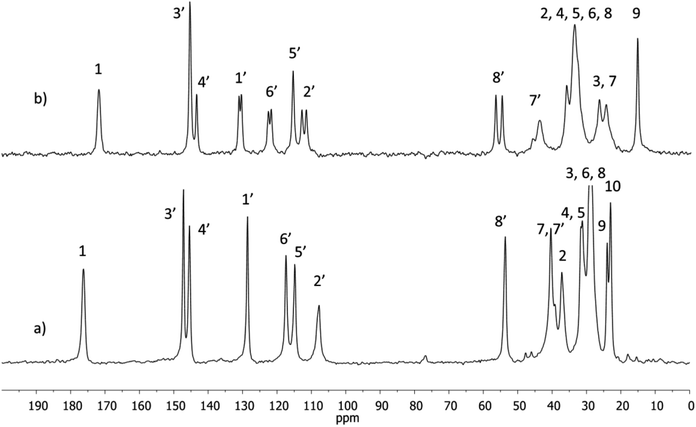
1H and 13C NMR spectra of NVA and DHCAP (in CDCl3 solutions) were measured and assigned. The chemical shifts were in agreement with those reported previously by Gómez-Calvario et al.9 13C CPMAS NMR spectra were recorded for both solids and are illustrated in Fig. 2.Resonances in the solid-state spectra were assigned by comparison with liquid-state chemical shifts and the results are collected in Table 1.
| DHCAP | NVA | ||||||
|---|---|---|---|---|---|---|---|
| C atom no. | δsol | δss | Δ | C atom no. | δsol | δss | Δ |
| 1′ | 130.82 | 128.59 | 2.23 | 1′ | 129.94 | 130.48/131.14 | |
| 2′ | 111.19 | 107.77 | 3.42 | 2′ | 110.74 | 111.66/112.92 | —/−2.18 |
| 3′ | 147.22 | 147.19 | 3′ | 146.70 | 145.41 | ||
| 4′ | 145.62 | 145.44 | 4′ | 145.19 | 143.46/145.41 | 1.73/— | |
| 5′ | 114.88 | 114.82 | 5′ | 114.37 | 115.48 | ||
| 6′ | 121.23 | 117.39 | 3.84 | 6′ | 120.86 | 121.85/122.65 | —/−1.79 |
| 7′ | 43.99 | 40.4 | 3.63 | 7′ | 43.76 | 43.9 | |
| 8′ | 56.39 | 53.6 | 2.76 | 8′ | 55.98 | 54.8/56.6 | |
| 1 | 173.38 | 176.3 | −2.9 | 1 | 173.53 | 171.9 | 1.5 |
| 2 | 37.32 | 37.3 | 2 | 36.55 | 36.08 | ||
| 3 | 26.30 | 28.7 | −2.3 | 3 | 25.88 | 26.58 | |
| 4 | 29.85 | 31.5 | −1.6 | 4 | 29.29 | 33.75 | −4.46 |
| 5 | 30.11 | 31.6 | −1.5 | 5 | 29.14 | 33.75 | −4.61 |
| 6 | 27.72 | 28.7 | 6 | 29.14 | 33.75 | −4.61 | |
| 7 | 39.43 | 40.4 | 7 | 22.63 | 24.58 | −1.95 | |
| 8 | 28.41 | 28.7 | 8 | 31.79 | 33.75 | −1.96 | |
| 9 | 23.10 | 24.0 | 9 | 14.08 | 15.46 | ||
| 10 | 23.10 | 23.0 | — | — | — | — | |
The 13C signals in the solid-state spectrum of DHCAP were assigned first on the basis of liquid-state chemical shifts and the results are collected in Table 1. The assignments were further confirmed by the calculation of shielding constants. The signals of carbons C1 and C7′ bound to nitrogen might be slightly broader due to the interaction with quadrupolar 14 N nuclei but the effect was not observed in the spectra recorded with spinning speed of 10 kHz. Significant differences between chemical shifts in solution and solid state (Δ = δsol − δss > 1.5 ppm) are observed for both compounds, but for different carbon atoms.
For DHCAP, the differences appear for aromatic carbons C1′, C2′, C6′ and also for C7′and C8′. Similar differences were noticed earlier for capsaicin.5 All three neighbors of C1′ exhibit an increase of shielding (3.4–3.8 ppm) in the solid state, suggesting the presence of steric hindrance. Molecular modeling shows that the rotation about C1′–C7′ bond is crucial and results in intramolecular interactions of C7′–H with either C2′–H or C6′–H. Significant values of Δ may be due to the locking of this fragment into a particular conformation, for example one of the C7′–H located closer to C6′–H and OCH3 group near aliphatic chain (Fig. 1).
Considering the NVA molecule, the most remarkable differences in chemical shifts (ca. −4.5 ppm) are observed for methylene carbons C4, C5 and C6 of the chain. The signals of four aromatic carbons (1′, 2′, 3′, 6′) and OCH3 (C8′) appear as doublets. The presence of split resonances indicates that two different molecules coexist in an asymmetric part of a unit cell of solid NVA. An attempt to assign the resonances to particular conformer was made. It is possible that one of them is similar to DHCAP, with OCH3 group near aliphatic chain as suggested by comparable values of Δ. But for the second conformer these differences are smaller suggesting that this molecule has aliphatic chain oriented far from aromatic ring and therefore may be less hindered.
On the basis of 13C CPMAS NMR and theoretical B3LYP/6-31G** calculations we could characterize the structure of conformers in solid phase. The chemical shifts for some conformers with different orientations of aliphatic chain, hydroxy and methoxy groups have been calculated by GIAO DFT. In solids, the rotation of hydroxy and methoxy groups is usually frozen, revealing specific environments with different chemical shifts, best seen for aromatic carbons ortho to the substituent. Better correlations between the measured and the calculated δii values confirmed the existence of conformers with “anticlockwise” orientation of OH and OCH3 groups, e.g. with OCH3 pointing to C2′ and OH towards OCH3 oxygen (Fig. 1).
Besides conformational effects, 13C CPMAS chemical shifts reflect intermolecular interactions in solids. The formation of H-bonds results in changes of the chemical shift (deshielding) of carbonyl carbons. In CDCl3 only weak interactions with the solvent occur, whereas in the solid state the C![[double bond, length as m-dash]](https://www.rsc.org/images/entities/char_e001.gif) O⋯HN and/or C
O⋯HN and/or C![[double bond, length as m-dash]](https://www.rsc.org/images/entities/char_e001.gif) O⋯HO bonds should affect the δss value. In DHCAP, chemical shift of C1
O⋯HO bonds should affect the δss value. In DHCAP, chemical shift of C1![[double bond, length as m-dash]](https://www.rsc.org/images/entities/char_e001.gif) O for solution is 173.38 ppm, and for solid state 176.28 ppm. The deshielding (Δ = 2.9 ppm) confirms the formation of intermolecular hydrogen bonds. For NVA, the difference of chemical shift between solution and solid state is +1.5 ppm and an increase of shielding suggest absence of hydrogen bond-type interaction involving C
O for solution is 173.38 ppm, and for solid state 176.28 ppm. The deshielding (Δ = 2.9 ppm) confirms the formation of intermolecular hydrogen bonds. For NVA, the difference of chemical shift between solution and solid state is +1.5 ppm and an increase of shielding suggest absence of hydrogen bond-type interaction involving C![[double bond, length as m-dash]](https://www.rsc.org/images/entities/char_e001.gif) O group.
O group.
15N MAS NMR
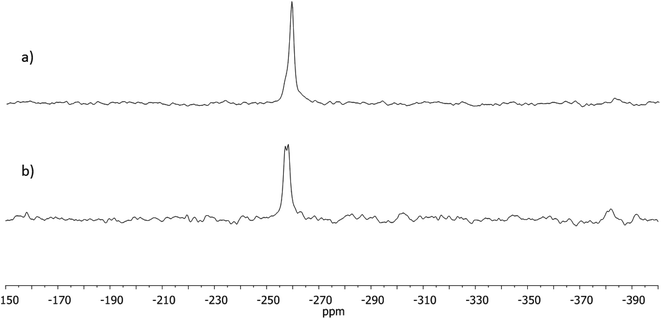
13C CPMAS spectra of solid NVA and DHCAP indicate that DHCAP has only one molecule in an asymmetric part of a unit cell, whereas NVA may have two. 15N MAS NMR spectra provide confirmation of these findings. In 15N MAS NMR spectrum of DHCAP a narrow singlet appears at −259.3 ppm, whereas in the spectrum of NVA a doublet is visible at −257.2/−258.2 ppm (Fig. 3).The value of 15N chemical shift for both compounds is typical for aliphatic and aromatic amides.10 In both solids, hydrogen bonds may be formed by the OH⋯O![[double bond, length as m-dash]](https://www.rsc.org/images/entities/char_e001.gif) C or NH⋯O
C or NH⋯O![[double bond, length as m-dash]](https://www.rsc.org/images/entities/char_e001.gif) C interaction. The NH⋯O
C interaction. The NH⋯O![[double bond, length as m-dash]](https://www.rsc.org/images/entities/char_e001.gif) C interaction should be reflected in 15N MAS chemical shift. If DHCAP is stabilized by NH⋯O
C interaction should be reflected in 15N MAS chemical shift. If DHCAP is stabilized by NH⋯O![[double bond, length as m-dash]](https://www.rsc.org/images/entities/char_e001.gif) C H-bonds, and NVA is not, their 15N chemical shifts would be significantly different. The relationship between 15N MAS chemical shift and hydrogen bond-type interactions via NH group has been previously described and the effect of H-bond formation is estimated as ca. 8 ppm.11 The 15N signals of DHCAP and NVA have almost the same chemical shift, values differ only by 1–2 ppm suggesting similar type of intermolecular interactions. Thus, one can assume that molecules of NVA and DHCAP are not linked by NH⋯O
C H-bonds, and NVA is not, their 15N chemical shifts would be significantly different. The relationship between 15N MAS chemical shift and hydrogen bond-type interactions via NH group has been previously described and the effect of H-bond formation is estimated as ca. 8 ppm.11 The 15N signals of DHCAP and NVA have almost the same chemical shift, values differ only by 1–2 ppm suggesting similar type of intermolecular interactions. Thus, one can assume that molecules of NVA and DHCAP are not linked by NH⋯O![[double bond, length as m-dash]](https://www.rsc.org/images/entities/char_e001.gif) C bonds. The deshielding of C
C bonds. The deshielding of C![[double bond, length as m-dash]](https://www.rsc.org/images/entities/char_e001.gif) O in 13C MAS spectrum of DHCAP can be explained rather by OH⋯O
O in 13C MAS spectrum of DHCAP can be explained rather by OH⋯O![[double bond, length as m-dash]](https://www.rsc.org/images/entities/char_e001.gif) C interactions.
C interactions.
GIAO DFT calculations were performed for an isolated molecule of DHCAP and NVA and the values of 15N NMR chemical shift (−256.0 and −254.6 ppm, respectively) are in agreement with experimental data.
Cross-polarization dynamics
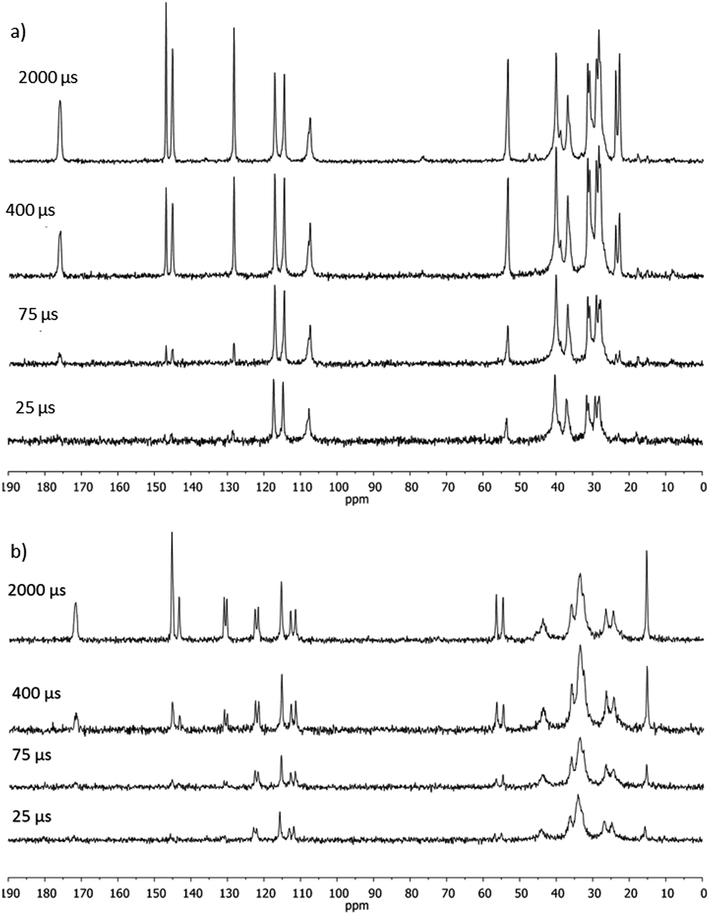
It seemed worth to check if DHCAP and NVA exhibit distinct cross-polarization dynamics. Therefore, a series of 13C CPMAS spectra with various contact times were recorded. According to the classic I-S model12 the signal intensity in CP spectra is a function of contact time t:| I(t) = A(1 − TCP/TH1ρ) − 1[exp(−t/TH1ρ) − exp(−t/TCP)] | (1) |
| Parameter | DHCAP | CAP5 | NVA | |||
|---|---|---|---|---|---|---|
| Mean value ± SD [ms] | Range of values [ms] | Mean value ± SD [ms] | Range of values [ms] | Mean value ± SD [ms] | Range of values [ms] | |
| Quaternary carbons C1′, C3′, C4′ | ||||||
| TCP | 0.87 ± 0.24 | 0.65–1.13 | 0.95 ± 0.22 | 0.71–1.23 | 0.71 ± 0.08 | 0.64–0.80 |
| TH1ρ | 159 ± 15 | 143–172 | 154 ± 35 | 124–192 | 31 ± 8 | 24–40 |
| Tdf | 0.95 ± 0.43 | 0.58–1.42 | Nd | nd | 0.87 ± 0.38 | 0.59–1.43 |
![[thin space (1/6-em)]](https://www.rsc.org/images/entities/char_2009.gif) |
||||||
C1![[double bond, length as m-dash]](https://www.rsc.org/images/entities/b_char_e001.gif) O O |
||||||
| TCP | 0.69 | — | 0.67 | — | 1.14 | — |
| TH1ρ | 122 | — | 107 | — | 35 | — |
| Tdf (I-I*-S) | 0.61 | — | Nd | nd | 0.52 | — |
![[thin space (1/6-em)]](https://www.rsc.org/images/entities/char_2009.gif) |
||||||
| C–H aromatic (C2′, C5′, C6′) and C8 in DHCAP | ||||||
| TCP | 0.51 ± 0.09 | 0.45–0.65 | 0.42 ± 0.05 | 0.35–0.47 | 0.42 ± 0.08 | 0.33–0.49 |
| TH1ρ | 200 ± 58 | 150–250 | 149 ± 20 | 117–160 | 39 ± 7 | 35–48 |
| Tdf (I-I*-S) | 0.42 ± 0.11 | 0.30–0.53 | Nd | nd | 0.29 ± 0.03 | 0.23–0.30 |
![[thin space (1/6-em)]](https://www.rsc.org/images/entities/char_2009.gif) |
||||||
| CH2 (C2–C7) i C7′ | ||||||
| TCP | 0.38 ± 0.11 | 0.30–0.60 | 0.27 ± 0.12 | 0.2–0.47 | 0.20 ± 0.06 | 0.15–0.3 |
| TH1ρ | 148 ± 23 | 128–180 | 129 ± 15 | 115–148 | 23 ± 4 | 21–33 |
| Tdf (I-I*-S) | 0.35 ± 0.11 | 0.20–0.50 | Nd | nd | 0.10 ± 0.09 | 0.05–0.31 |
![[thin space (1/6-em)]](https://www.rsc.org/images/entities/char_2009.gif) |
||||||
| CH3 groups | ||||||
| TCP | 1.62 ± 0.05 | 1.58–1.65 | 0.85 ± 0 | — | 0.32 | — |
| TH1ρ | 160 ± 14 | 150–170 | 160 ± 14 | 150–170 | 31 | — |
| Tdf (I-I*-S) | 2.00 ± 0.00 | 2.00 | Nd | nd | 0.23 | — |
![[thin space (1/6-em)]](https://www.rsc.org/images/entities/char_2009.gif) |
||||||
| OCH3 groups | ||||||
| TCP | 0.68 | — | 0.45 | — | 0.50 | — |
| TH1ρ | 180 | — | 180 | — | 35 | — |
| Tdf (I-I*-S) | 0.30 | — | Nd | nd | 0.32 ± 0.01 | 0.31–0.33 |
TCP is governed by dipolar coupling12 and is long for carbons without adjacent hydrogens. Quaternary carbon atoms of DHCAP and NVA have average TCP values of 0.87 and 0.7 ms respectively. TCP for CH groups is shorter (0.42–0.51 ms). Assuming that the average value of 0.42 ms is typical for CH carbons (Table 2), then 0.20 ms should be expected for CH2 and even lower value for CH3. The values for methyl carbons of 0.32–1.62 ms are longer than those expected without intramolecular dynamics, evidencing that methyl groups are fairly mobile. TCP increases with increasing mobility of the structural fragment bearing this carbon, and the fast rotation is typical for methyl groups.14 In the 13C CPMAS spectra of DHCAP separate signals of two methyl groups appeared, therefore we were able to characterize particular carbons. The values of TCP are 1.58 and 1.65 ms for C9 and C10, respectively, indicating that their interaction with intra- or intermolecular does not differ.
Relaxation times TH1ρ are influenced by the short-range spatial proximity between protons and also reflect molecular dynamics. It seemed interesting to check if the two molecules present in an asymmetric part of a unit cell of solid NVA exhibit distinct cross-polarization dynamics. Inspection of the spectra in Fig. 4, in which the doublets (C2′, C3′, C6′) of almost equal intensity are seen, as well as an analysis of TCP and TH1ρ values indicated that the behaviour of these two conformations is quite similar.
Fig. 5 shows the plot of signal intensity vs. contact time for methyl groups of NVA and DHCAP. Two signals of OCH3 groups in NVA are characterized by long decay, similar to DHCAP. The TH1ρ values obtained for CH3 groups (both from the aliphatic chain and methoxy groups) are the same for DHCAP and CAP.
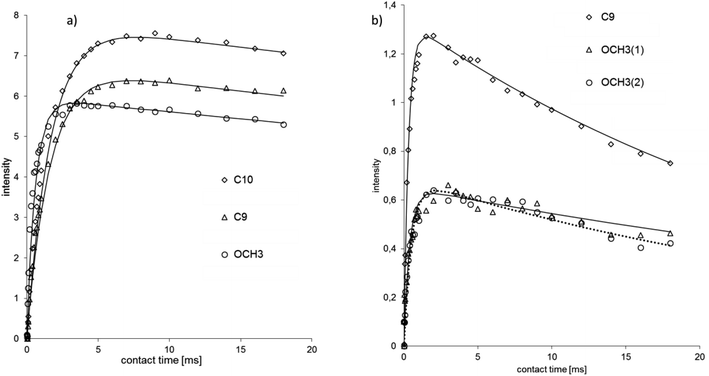 | ||
| Fig. 5 Cross-polarization kinetics for methyl carbons of (a) DHCAP and (b) NVA. Signal intensity in arbitrary units (a.u), contact time in ms. The fitted functions have long TH1ρ. | ||
The plot of signal intensity vs. contact time for carbonyl carbons C1 is illustrated in Fig. 6; the shape of fitted functions is distinct: steeper for NVA and plane for DHCAP.
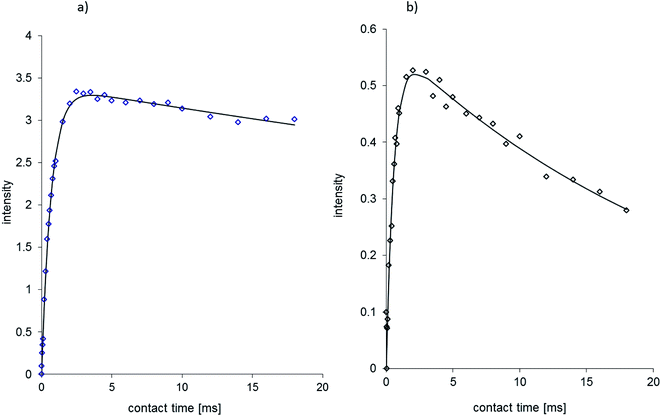 | ||
Fig. 6 Cross-polarization kinetics for C1![[double bond, length as m-dash]](https://www.rsc.org/images/entities/char_e001.gif) O carbon of (a) DHCAP and (b) NVA. The fitted functions have different T1ρ values. Signal intensity in arbitrary units (a.u), contact time in ms. Fitting using eqn (1) gives TH1ρ = 122 ms for DHCAP and 35 ms for NVA. (TCP = 0.61 ms and 0.52 ms, respectively). O carbon of (a) DHCAP and (b) NVA. The fitted functions have different T1ρ values. Signal intensity in arbitrary units (a.u), contact time in ms. Fitting using eqn (1) gives TH1ρ = 122 ms for DHCAP and 35 ms for NVA. (TCP = 0.61 ms and 0.52 ms, respectively). | ||
Unfortunately, no reliable data on cross-polarization dynamics can be provided on particular methylene carbons (except C7′) because of signal overlapping.
It is difficult to predict in advance which model will be better for the quantification of a particular CP signal. Therefore, we decided to analyze CP data in accordance with the I-I*S model. Intensity decays were described by Kolodziejski and Klinowski12 by the following equation:
I(t) = I0[1 − ½![[thin space (1/6-em)]](https://www.rsc.org/images/entities/char_2009.gif) exp(−t/Tdf) − ½ exp(−t/Tdf) − ½![[thin space (1/6-em)]](https://www.rsc.org/images/entities/char_2009.gif) exp(− exp(−![[/]](https://www.rsc.org/images/entities/char_e0ee.gif) t/Tdf)exp(−½t2/T22)], t/Tdf)exp(−½t2/T22)], |
Relaxation time in the rotating frame is frequently averaged over all protons by spin diffusion and is indicative for separation of molecules or some domains (e.g. aliphatic and aromatic) by missing intimate spin contact. Tdf are long for quaternary carbon atoms. C4′ and C3′ which are the most distant from aliphatic chain carbon atoms have the longest Tdf (0.85 and 1.42 ms for DHCAP, 0.82 and 1.42 ms for NVA, respectively). There are no significant differences in Tdf values for aromatic ring carbon atoms. However, the CH3 groups of the aliphatic chain of DHCAP and NVA differ in proton spin-diffusion constant. Methyl groups of DHCAP require longer spin-diffusion, which may be caused by fast rotation of isopropyl chain termination, as it was described earlier for CAP.5 Shorter Tdf value indicates that the CH3 group of NVA may be less rotating. The average relaxation times in the rotating frame for solid capsaicinoids decrease in the order: DHCAP > CAP > NVA. Although the differences may be the result of different phenomena, including intramolecular mobility and intermolecular interactions, the lowest values for NVA (Table 2) suggest that solid NVA is more tightly packed and the chain has less space for dynamics.
TH1ρ relaxation times are considered to be a probe of crystallinity degrees. For crystalline samples, TH1ρ takes longer values than for amorphous samples.15 It may suggest that NVA has a more disordered network compared to DHCAP and CAP. However, line broadening characteristic for amorphous solids is not observed neither in DHCAP nor NVA 13C CPMAS spectra.
Cross-polarisation dynamic parameters were analyzed for the common pharmaceutical excipients.15 Branched polymers of cellulose (methylcellulose, ethylcellulose, hydroxypropylmethylcellulose) have mean TH1ρ value of 20 ms, which is similar to NVA. For some crystalline compounds, TH1ρ values were significantly higher, for example olanzapine form II (T1ρ = ∞).16 The molecular dynamics of solid β-carotene were studied by means of 13C CPMAS NMR.17 The TCP average value of 0.79 ms was found for methine carbons and 0.65–0.78 ms for methylene carbons, which indicated that these groups must be in a flexible molecular fragment. The relaxation times TH1ρ were very long (the CP curves ended in a plateau).
Genetic algorithm search
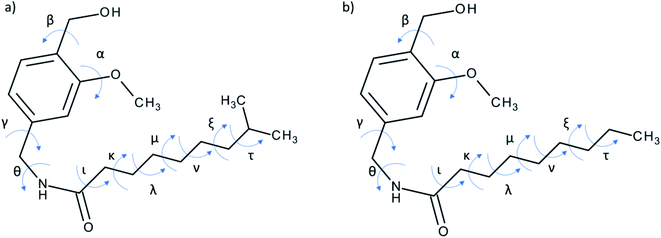
Low-energy conformations for NVA and DHCAP should be found for further molecular modelling, and simple DFT optimization is not efficient enough. For flexible compounds like NVA and DHCAP, systematical conformational searching (grid search) is extremely time consuming and is not recommended. A relatively new methodology of conformational analysis capable of locating minimum energy structures on conformational potential energy surfaces are evolutionary algorithms (GA) based on the concepts of biological evolution. A ‘population’ of possible solutions to the problem is first created with each solution being scored using a ‘fitness function’ that indicates how good they are. The population evolves over time and allows you to receive better solutions. Of the various types of evolutionary algorithm, the genetic algorithm (GA) is the most well-known. The idea of GA is based on the genetic principles of heredity transferred to the field of quantum chemistry. The best adapted, low-energy conformations are selected and promoted to the next generations.In our research for DHCAP and NVA 11 torsion angles were defined (Fig. 7) and listed in Table 5. The GA calculations with MMFF94 force field were carried out using two different dielectric constants (ε = 1.0, ε = 4.0). The higher ε value mimics the more polar surrounding of the molecule. The purpose was to verify how electrostatic interactions affect the optimal arrangements of the aliphatic chain. A set of low-energy conformers was obtained differing by ca. 1 kcal mol−1 (genetic algorithm procedures yielded ca 30 low-energy conformers for each compound). Then shielding constants calculation was carried out using DFT methods7 for each conformation. The calculated NMR shielding constants were converted into chemical shifts, allowing easier comparison with experimental data. The next step was to verify the agreement between experimental solid-state and theoretical NMR data (mainly in aliphatic chain region). Selected results are collected in Tables 3 and 4.
| E1-01 | E1-03 | E1-04 | E1-06 | E1-08 | E4-01 | E4-03 | E4-05 | E4-07 | E4-08 | |
|---|---|---|---|---|---|---|---|---|---|---|
| C1′ | 141.00 | 141.30 | 139.14 | 141.05 | 140.92 | 140.99 | 140.38 | 141.28 | 138.10 | 140.73 |
| C2′ | 116.36 | 116.14 | 113.71 | 116.24 | 115.31 | 116.76 | 117.99 | 115.89 | 114.13 | 115.86 |
| C3′ | 154.14 | 154.43 | 154.27 | 154.17 | 154.69 | 154.49 | 154.20 | 154.25 | 152.45 | 154.14 |
| C4′ | 155.12 | 153.41 | 155.19 | 155.27 | 155.25 | 154.99 | 153.91 | 154.71 | 154.56 | 155.81 |
| C5′ | 118.71 | 118.49 | 119.79 | 119.66 | 119.65 | 119.40 | 119.15 | 118.97 | 121.57 | 119.18 |
| C6′ | 126.56 | 126.38 | 128.08 | 126.62 | 126.56 | 126.75 | 126.73 | 126.38 | 128.23 | 126.32 |
| C7′ | 47.81 | 47.82 | 46.29 | 47.87 | 47.54 | 47.79 | 48.89 | 47.63 | 48.47 | 47.44 |
| C8′ | 57.37 | 57.07 | 56.80 | 56.92 | 56.39 | 57.54 | 57.07 | 57.28 | 57.03 | 56.95 |
| C1 | 178.39 | 178.72 | 176.74 | 179.03 | 178.31 | 178.35 | 179.22 | 178.90 | 177.29 | 178.91 |
| C2 | 42.16 | 43.16 | 40.68 | 36.32 | 38.94 | 41.99 | 41.46 | 43.02 | 43.00 | 39.77 |
| C3 | 34.10 | 33.31 | 30.74 | 25.75 | 24.80 | 34.29 | 28.80 | 30.48 | 32.87 | 26.14 |
| C4 | 34.26 | 34.95 | 31.90 | 31.16 | 29.05 | 32.42 | 38.73 | 35.93 | 34.17 | 29.59 |
| C5 | 37.70 | 36.82 | 31.19 | 27.95 | 30.45 | 36.32 | 35.51 | 36.08 | 36.34 | 29.55 |
| C6 | 34.50 | 33.98 | 30.87 | 28.98 | 28.10 | 33.48 | 36.24 | 32.79 | 32.90 | 28.04 |
| C7 | 44.88 | 43.10 | 39.72 | 43.15 | 41.59 | 42.48 | 44.50 | 45.62 | 45.02 | 41.67 |
| C8 | 36.04 | 36.59 | 29.77 | 31.45 | 36.65 | 36.82 | 36.02 | 36.45 | 35.62 | 36.34 |
| C9 | 22.14 | 26.44 | 20.89 | 20.79 | 22.17 | 22.69 | 26.42 | 26.34 | 22.51 | 22.02 |
| C10 | 26.98 | 22.58 | 26.71 | 26.50 | 26.99 | 26.31 | 22.28 | 22.30 | 28.45 | 26.87 |
| R2-tail | 0.907 | 0.878 | 0.924 | 0.841 | 0.723 | 0.857 | 0.822 | 0.911 | 0.934 | 0.758 |
| E1-01 | E1-03 | E1-04 | E1-05 | E1-10 | E4-04 | E4-07 | E4-08 | E4-09 | E4-10 | |
|---|---|---|---|---|---|---|---|---|---|---|
| C1′ | 140.99 | 141.27 | 140.79 | 141.18 | 140.90 | 141.21 | 140.90 | 142.68 | 141.18 | 138.04 |
| C2′ | 115.88 | 116.82 | 116.58 | 117.02 | 115.86 | 117.33 | 114.92 | 118.60 | 117.02 | 115.11 |
| C3′ | 154.53 | 154.78 | 154.59 | 154.17 | 154.15 | 154.06 | 154.50 | 156.75 | 154.17 | 152.85 |
| C4′ | 154.61 | 155.17 | 154.29 | 154.42 | 155.61 | 154.68 | 154.60 | 153.71 | 154.42 | 154.59 |
| C5′ | 119.04 | 119.62 | 119.17 | 119.08 | 119.58 | 119.24 | 119.50 | 117.94 | 119.08 | 121.82 |
| C6′ | 126.69 | 126.79 | 126.66 | 126.78 | 126.61 | 126.58 | 127.07 | 124.18 | 126.78 | 129.16 |
| C7′ | 48.03 | 48.03 | 48.24 | 47.76 | 47.39 | 48.21 | 47.29 | 47.78 | 47.75 | 49.21 |
| C8′ | 57.71 | 57.37 | 57.33 | 57.07 | 56.84 | 57.32 | 57.23 | 57.04 | 57.07 | 56.93 |
| C1 | 179.05 | 178.74 | 178.54 | 178.76 | 179.17 | 178.80 | 177.68 | 178.42 | 178.76 | 176.89 |
| C2 | 37.60 | 42.58 | 41.97 | 42.71 | 41.93 | 42.14 | 40.95 | 41.87 | 42.71 | 43.12 |
| C3 | 30.26 | 31.40 | 34.13 | 30.73 | 34.14 | 34.34 | 27.35 | 33.66 | 30.74 | 31.13 |
| C4 | 32.45 | 30.13 | 30.93 | 29.08 | 34.92 | 32.35 | 28.71 | 32.11 | 29.08 | 35.98 |
| C5 | 34.84 | 34.33 | 30.24 | 34.55 | 33.50 | 35.75 | 30.22 | 36.14 | 34.55 | 35.81 |
| C6 | 37.63 | 31.74 | 28.10 | 28.27 | 31.21 | 36.48 | 29.08 | 35.52 | 28.27 | 36.03 |
| C7 | 39.32 | 34.84 | 30.49 | 32.91 | 34.37 | 36.82 | 31.74 | 36.78 | 32.91 | 39.29 |
| C8 | 29.46 | 30.07 | 21.62 | 27.95 | 23.59 | 30.13 | 26.48 | 30.16 | 27.95 | 29.73 |
| C9 | 16.84 | 16.60 | 13.40 | 14.57 | 13.16 | 16.49 | 17.25 | 16.77 | 14.57 | 17.69 |
| R2-tail | 0.914 | 0.787 | 0.653 | 0.733 | 0.813 | 0.902 | 0.753 | 0.866 | 0.733 | 0.947 |
For each dielectric constant the best conformation was chosen (based on R2-tail values). Energies and dihedral angles of selected conformers are listed in Table 5.
| Torsion angle | DHCAP-E1 | DHCAP-E4 | NVA-E1 | NVA-E4 |
|---|---|---|---|---|
| α (°) | −0.5 | 1.5 | −0.9 | 1.8 |
| β (°) | −0.4 | 0.4 | −0.4 | 0.5 |
| γ (°) | −69.6 | 118.2 | −75.2 | 112.7 |
| θ (°) | 125.2 | 146.7 | 93 | 155.9 |
| ι (°) | 146.3 | 97.5 | 137.7 | −133.5 |
| κ (°) | −67.8 | 66.7 | −67.6 | −174.8 |
| λ (°) | −177.5 | 176 | −66.8 | −177 |
| μ (°) | 178 | 66.5 | −176.9 | −66.3 |
| ν (°) | 64.5 | 176 | 179.9 | −176.4 |
| ξ (°) | 60.7 | 175.3 | −179.7 | −180 |
| τ (°) | 60.1 | 63.8 | −179.9 | −179.8 |
| ΔE | 1.28 | 2.43 | 0.08 | 1.1 |
| R2 | 0.997 | 0.997 | 0.999 | 0.999 |
| R2-tail | 0.924 | 0.934 | 0.914 | 0.947 |
| MAE (TMS) | 4.08 | 5.34 | 4.53 | 4.87 |
| MAE (SF) | 2.62 | 2.00 | 1.86 | 1.45 |
Shielding constants are usually recalculated to chemical shifts by comparison to theoretical shielding constant of TMS (δiso = σTMS − σiso). However, there is a number of publications describing the converting of shielding constants with scaling factors (SF).18,19 Empirical scaling enables achieving high-accuracy theoretical chemical shifts. In this approach, the systematic error was decreased by scaling factors determined via linear regression analyses of experimental and computed chemical shift data. It was proposed as a rewarding method.
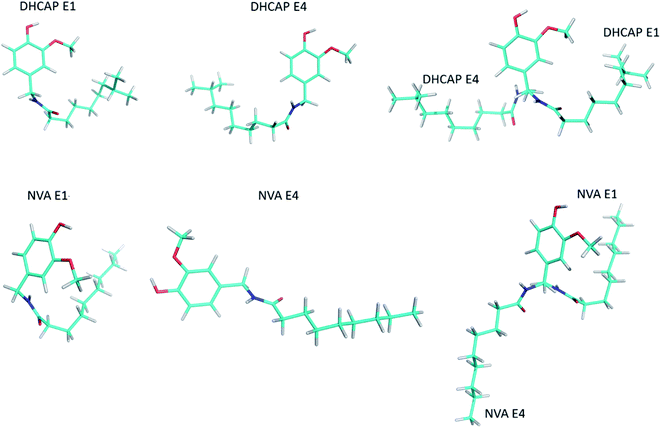
The selected low-energy conformers (Fig. 8) differ mainly in the geometry of the aliphatic chain. Their isotropic 13C shielding constants σiso were compared with the experimental δCPMAS NMR values. The correlation of the calculated isotropic shielding with each set of resonances in the MAS spectrum is satisfactory because R2 > 0.99. As a criterion of the quality of conformers, the R2 factor and the minimal absolute error (MAE) between theoretical and experimental data can be applied. However, the R2 criterion used to determine the quality of fitting is not sensitive enough to make selection, therefore R2-tail (which compares only the aliphatic chain carbons chemical shifts) and MAE were added as rewarding parameters. For both molecules, the two best conformations were chosen for each method of chemical shift conversion: DHCAP-E1, DHCAP-E4 and NVA-E1, NVA-E4 (see Tables 3 and 4).
The differences between chemical shifts calculated according to the TMS shielding constant and using scaling factors are visible at the first sight. The MAE is lower for these obtained by SF almost by half. The traditional approach in NMR calculations is calculating shielding constants for a reference molecule.20 However, the utilizing of a single molecule reference compound may lead to a systematic error. In the case of SF, isotropic shielding constants are plotted against known experimental chemical shifts for a numerous set of small organic molecules.21 and a strong linear correlation was observed.
The traditional approach, e.g. calculations of the isotropic shielding constant of TMS, allowed the selection of the best conformations: DHCAP-E1 and NVA-E1. DHCAP-E1 fulfils both criteria: the highest R2-tail value (0.924) and the lowest MAE (4.08). For NVA the highest R2-tail (0.933) and the lowest MAE (4.53) were also obtained for E1. However, when scaling factors were used, the best results were obtained for calculations with ε = 4.0. The R2-tail was 0.934 and 0.910 and MAE 2.00 and 1.45 for DHCAP-E4 and NVA-E4, respectively. These four low-energy conformers, which show the best agreement between theoretical and experimental chemical shifts, are illustrated in Fig. 8. The aromatic part of DHCAP and NVA has the same structure in all conformers, with OCH3 group pointing to C2′ and OH directed to oxygen at C3′. The most interesting structural part of both studied molecules is the flexible aliphatic chain.
Both GA-conformers of DHCAP have a bent chain, as it was found earlier for capsaicin.5 However, in one of them it is bent towards the methoxyl group (E1), which may cause steric hindrance, whereas in the second – in the opposite direction (E4). The hindrance should influence the CP kinetic parameters. The CP parameters of DHCAP for both CH3 and OCH3 group are longer than CP parameters of CAP. It may suggest increased mobility of these groups, which is possible in the absence of the steric hindrance (E4). Summarized GA and CPMAS NMR data recommend that the most probable conformation of DHCAP is DHCAP E4. It is bent as capsaicin conformation, but in the opposite direction.
Both GA conformers of NVA, which have the best fitting parameters to experimental NMR data, have different geometries of aliphatic chain. The NVA-E1 has a bent and the NVA-E4 extended aliphatic chain. Split resonances (doublets) in 13C and 15N MAS NMR spectra suggest that solid NVA sample contains two different molecules in the crystallographic unit. Taking into account the conformers obtained by GA, we suppose that the molecules coexisting in the solid may differ by the orientation of aliphatic chain. However, to confirm such assumption crystallographic data are required.
Conclusions
The solid-state structure of DHCAP and NVA were investigated. Since there is no crystallographic data and single crystals suitable for XRD were not obtained, 13C and 15N MAS NMR supported by genetic algorithm and GIAO DFT calculations were used for solid state structural studies. To the best of our knowledge this work is the first that focuses on solid state of DHCAP and NVA. DHCAP shows numerous similarities in NMR and GA data to these obtained for CAP.5 Conformation with a bent aliphatic chain is probable in solid DHCAP, however the chain is not close to the methoxyl group. The molecular network of capsaicinoids is not stabilized by NH⋯O![[double bond, length as m-dash]](https://www.rsc.org/images/entities/char_e001.gif) C intermolecular hydrogen bonds, more probable is OH⋯O
C intermolecular hydrogen bonds, more probable is OH⋯O![[double bond, length as m-dash]](https://www.rsc.org/images/entities/char_e001.gif) C interaction in DHCAP and CAP but not in NVA. Solid state of NVA is characterized by the presence of two conformers, with bent and extended aliphatic chain.
C interaction in DHCAP and CAP but not in NVA. Solid state of NVA is characterized by the presence of two conformers, with bent and extended aliphatic chain.
Conflicts of interest
There are no conflicts to declare.References
- K. Srinivasan, Biological activities of red pepper (Capsicum annuum) and its pungent principle capsaicin: a review, Crit. Rev. Food Sci. Nutr., 2016, 56(9), 1488–1500 CrossRef CAS PubMed.
- S. Kosuge and M. Furuta, Studies on the pungent principle of capsicum: part XIV chemical constitution of the pungent principle, Agric. Biol. Chem., 1970, 34(2), 248–256 CAS.
- H. L. Constant, G. A. Cordell and D. P. West, Nonivamide, a constituent of capsicum oleoresin, J. Nat. Prod., 1996, 59(4), 425–426 CrossRef CAS.
- N. O. Junior, et al., Evaluation of Natural Capsaicin (N. Cap) in Pepper Spray by GC-MS/FID, NMR and HPLC as an Alternative to the Use of Oleoresin Capsicum (OC), Human Factors and Mechanical Engineering for Defense and Safety, 2019, 3(1), 1–10 CrossRef.
- P. Siudem, K. Paradowska and J. Bukowicki, Conformational analysis of capsaicin using 13C, 15N MAS NMR, GIAO DFT and GA calculations, J. Mol. Struct., 2017, 1146, 773–781 CrossRef CAS.
- J. Bukowicki, A. Wawer and K. Paradowska, Conformational Analysis of Gentiobiose Using Genetic Algorithm Search and GIAO DFT Calculations with 13C CPMAS NMR as a Verification Method, J. Carbohydr. Chem., 2015, 34(3), 145–162 CrossRef CAS.
- M. Frisch, et al., Gaussian 09, rev. B01, Gaussian Inc., Wallingford CT, 2010 Search PubMed.
- M. W. Lodewyk, M. R. Siebert and D. J. Tantillo, Computational prediction of 1H and 13C chemical shifts: a useful tool for natural product, mechanistic, and synthetic organic chemistry, Chem. Rev., 2011, 112(3), 1839–1862 CrossRef PubMed.
- V. Gómez-Calvario, et al., 1H and 13C NMR data on natural and synthetic capsaicinoids, Magn. Reson. Chem., 2016, 54(4), 268–290 CrossRef PubMed.
- M. Witanowski, L. Stefaniak and G. Webb, Nitrogen NMR spectroscopy, in Annual reports on NMR spectroscopy, Elsevier, 1993, pp. 1–82 Search PubMed.
- X. P. Xu and D. A. Case, Probing multiple effects on 15N, 13Cα, 13Cβ, and 13C′ chemical shifts in peptides using density functional theory, Biopolymers, 2002, 65(6), 408–423 CrossRef CAS PubMed.
- W. Kolodziejski and J. Klinowski, Kinetics of cross-polarization in solid-state NMR: a guide for chemists, Chem. Rev., 2002, 102(3), 613–628 CrossRef CAS PubMed.
- U. Holzgrabe, B. W. Diehl and I. Wawer, NMR spectroscopy in pharmacy, J. Pharm. Biomed. Anal., 1998, 17(4–5), 557–616 CrossRef CAS PubMed.
- S. Witkowski, K. Paradowska and I. Wawer, 13C CP/MAS NMR studies of vitamin E model compounds, Magn. Reson. Chem., 2004, 42(10), 863–869 CrossRef CAS PubMed.
- D. M. Pisklak, et al., 13C solid-state NMR analysis of the most common pharmaceutical excipients used in solid drug formulations part II: CP kinetics and relaxation analysis, J. Pharm. Biomed. Anal., 2016, 122, 29–34 CrossRef CAS PubMed.
- W. Kolodziejski, et al., Kinetics of 1H → 13C NMR cross-polarization in polymorphs and solvates of the antipsychotic drug olanzapine, Solid State Nucl. Magn. Reson., 2011, 39(3–4), 41–46 CrossRef CAS PubMed.
- W. Kolodziejski and T. Kasprzycka-Gutman, 13C CP/MAS NMR in trans-β-carotene, Solid State Nucl. Magn. Reson., 1998, 11(3–4), 177–180 CrossRef CAS PubMed.
- F. L. Costa, et al., Very Fast and Surprisingly Accurate GIAO-mPW1PW91/3-21G//PM7 Scaling Factor for 13C NMR Chemical Shifts Calculation, Adv. Sci., Eng. Med., 2017, 9(3), 254–261 CrossRef CAS.
- T. F. Giacomello, et al., Protocol for Calculating 13C Nuclear Magnetic Resonance Chemical Shifts of Flexible Organic Molecules, Adv. Sci., Eng. Med., 2017, 9(8), 640–647 CrossRef CAS.
- P. Wałejko, et al., Racemic crystals of trolox derivatives compared to their chiral counterparts: structural studies using solid-state NMR, DFT calculations and X-ray diffraction, J. Mol. Struct., 2018, 1156, 290–300 CrossRef.
- http://cheshirenmr.info/index.htm.
| This journal is © The Royal Society of Chemistry 2020 |

