
 Open Access Article
 This Open Access Article is licensed under a Creative Commons Attribution-Non Commercial 3.0 Unported Licence
Boosting basic-peptide separation through dynamic electrostatic-repulsion reversed-phase (d-ERRP) liquid chromatography†
Giulia Mazzoccanti *a,
Simone Manettoa,
Michele Bassanb,
Alberto Foschinib,
Andrea Orlandinb,
Antonio Ricci*b,
Walter Cabribc,
Omar H. Ismaild,
Martina Catanid,
Alberto Cavazzinid and
Francesco Gasparrini*a
*a,
Simone Manettoa,
Michele Bassanb,
Alberto Foschinib,
Andrea Orlandinb,
Antonio Ricci*b,
Walter Cabribc,
Omar H. Ismaild,
Martina Catanid,
Alberto Cavazzinid and
Francesco Gasparrini*a
aDepartment of Pharmaceutical Chemistry and Technology, “Sapienza” University of Rome, Rome, Italy. E-mail: francesco.gasparrini@uniroma1.it; giulia.mazzoccanti@uniroma1.it
bFresenius Kabi iPSUM, Piazza Maestri del Lavoro 7, Cernusco sul Naviglio, 20063, MI, Italy. E-mail: antonio.ricci@fresenius-kabi.com
cDepartment of Chemistry, Alma Mater Studiorum-University of Bologna, Via Selmi2, 40126 Bologna, Italy
dDepartment of Chemistry and Pharmaceutical Sciences, University of Ferrara, Ferrara, Italy
First published on 27th March 2020
Abstract
The application of a novel chromatographic approach to therapeutic peptides bearing basic amino acids in their structure allowed unprecedented resolution of their related impurities (including epimeric isobaric ones), resulting in a superior analytical tool for the evaluation of the quality of these drugs in the market.
1. Introduction
Peptides represent an essential class of products chemically positioned between small molecules and proteins, even if not belonging to any of the two families.1Since the 1920s, with the discovery of the peptide hormone known as insulin2,3 and its use in therapy, peptides have played an increasingly important role in clinical practice as active pharmaceutical ingredients (APIs),4 and their production at a large-scale has seen significant technological improvements.1,4–7 In recent years, new synthetic modifications have been implemented on the primary sequence of peptide APIs in order to improve their pharmacokinetic profile and bioavailability, e.g., by reducing the degradative cleavage operated by proteases under physiological conditions.8,9
As a direct consequence of this, peptides were exposed to exponential interest by pharmaceutical companies over recent years, with several candidates approved by the regulatory agencies as drugs and a consistent number of new entries in the clinical trials.1 Mainly, the application of these engineered peptides exerted a high impact for the treatment of metabolic diseases, such as diabetes and obesity, reaching multibillionaire revenues thanks to the high demands.9,10 Interestingly, a common point shared by these APIs, all mimicking the GLP-1 structure, is the presence of several basic residues in their primary sequences.11
Over the years, chemical synthesis played an always more prominent role in the manufacturing of a polypeptide, due to its ability to insert non-native residues on the primary sequence of peptides.12,13 The chemical synthesis approach comprises several strategies, where the most prominent one is the solid phase peptide synthesis (SPPS), initially developed by Merrifield.14–16
SPPS technology is, by far, the most popular approach to polypeptide synthesis. However, this technology generates a plethora of specific impurities,17 with deamidation and epimerization as the most relevant cases. Deamidation is a degradative modification since it arises upon storage conditions; the epimerization is the formation of a species that differs from the native due to the racemization of single amino acid and originates from the synthesis.
The proper identification and separation of these impurities is a must for assessing the safety and efficacy of therapeutic polypeptides.18 However, the detection of these impurities in the final peptide API represents a challenge, due to the minimal modification of some of these impurities respect to the molecular structure of the parent therapeutic peptide (e.g., epimers). Moreover, epimers and the parent therapeutic peptide are isobaric; thus, since mass spectrometry cannot give us the desired information, the chromatographic separation of the two species becomes pivotal.
Indeed, over the years, several analytical techniques have been developed ad hoc for recognizing and describing peptide stereochemistry, such as enantioselective liquid chromatography,19,20 NMR,21 selective enzymatic digestion,22 and some exciting applications involving highly specific mass spectrometry techniques.23,24
Particularly for epimers, it is also possible to use reversed-phase chromatography (RPC). RPC is one of the most versatile and exploited chromatographic technique, it is used in the analysis of a wide range of compounds, and even if it cannot provide separation of enantiomers, it allows separating diastereomers such as peptide epimers.25,26 Nowadays, RPC offers impressive flexibility in terms of choice of chromatographic support and eluent, in order to ensure separations with high resolution, even for those compounds that present only small structural differences. However, one of the main weaknesses of the RPC technique, even using the latest generation columns, is the analysis of basic compounds.27 It is already known that over 70% of pharmaceutical products are bases;27 this trend can also be observed in the biopharmaceutical field, and an increasingly significant number of compounds of biomedical and biological importance has basic properties, such as the peptides containing positively charged amino acids (histidine, lysine, and arginine) described above.
Despite a large number of basic compounds produced by the pharmaceutical and biopharmaceutical industries, their control by liquid chromatography poses particular difficulties. Focusing on the RP elution mode, many of these problems are associated with the complex surface structure of the stationary phase, which often causes a critical peak tailing, and since the content of impurities needs to be evaluated at low level (e.g., 0.10%), the risk they go unnoticed in case they elute just after the main peak is very high.
In order to overcome these problems, charged surface hybrid (CSH) packing materials, for the analysis of small basic compounds under acidic pHs in RPLC, have been introduced.28,29 In 2014, Gritti and Guiochon coined the term electrostatic repulsion interactions RPLC (ER-RPLC) to describe this new mixed-mode,30 which can be defined “static” ERRP since the positive charges, usually quaternary ammonium species, are chemically bonded to the silica surface. Despite the improvements given by these packing materials, the problem of the chromatographic behavior of positively charged compounds is not entirely resolved.
In this scenario, we focused on Glucagon (GLUC 1) as a case study. GLUC is a therapeutic peptide used in the treatment of severe hypoglycaemia in type 1 diabetic patients.31 This peptide is made up of 29 L-amino acids, and it is extremely challenging from an analytical point of view because of the different modifications arising during its synthesis, such as racemization of the first histidine, that generate an epimeric isobaric impurity ([D-His]1-GLUC 2). Moreover, it can undergo deamidation of glutamines in positions 3, 20, and 24, producing the impurities named [Glu]3-GLUC 3, [Glu]20-GLUC 5 and [Glu]24-GLUC 6 and asparagines, forming [Asp]28-GLUC 4 (Fig. 1).
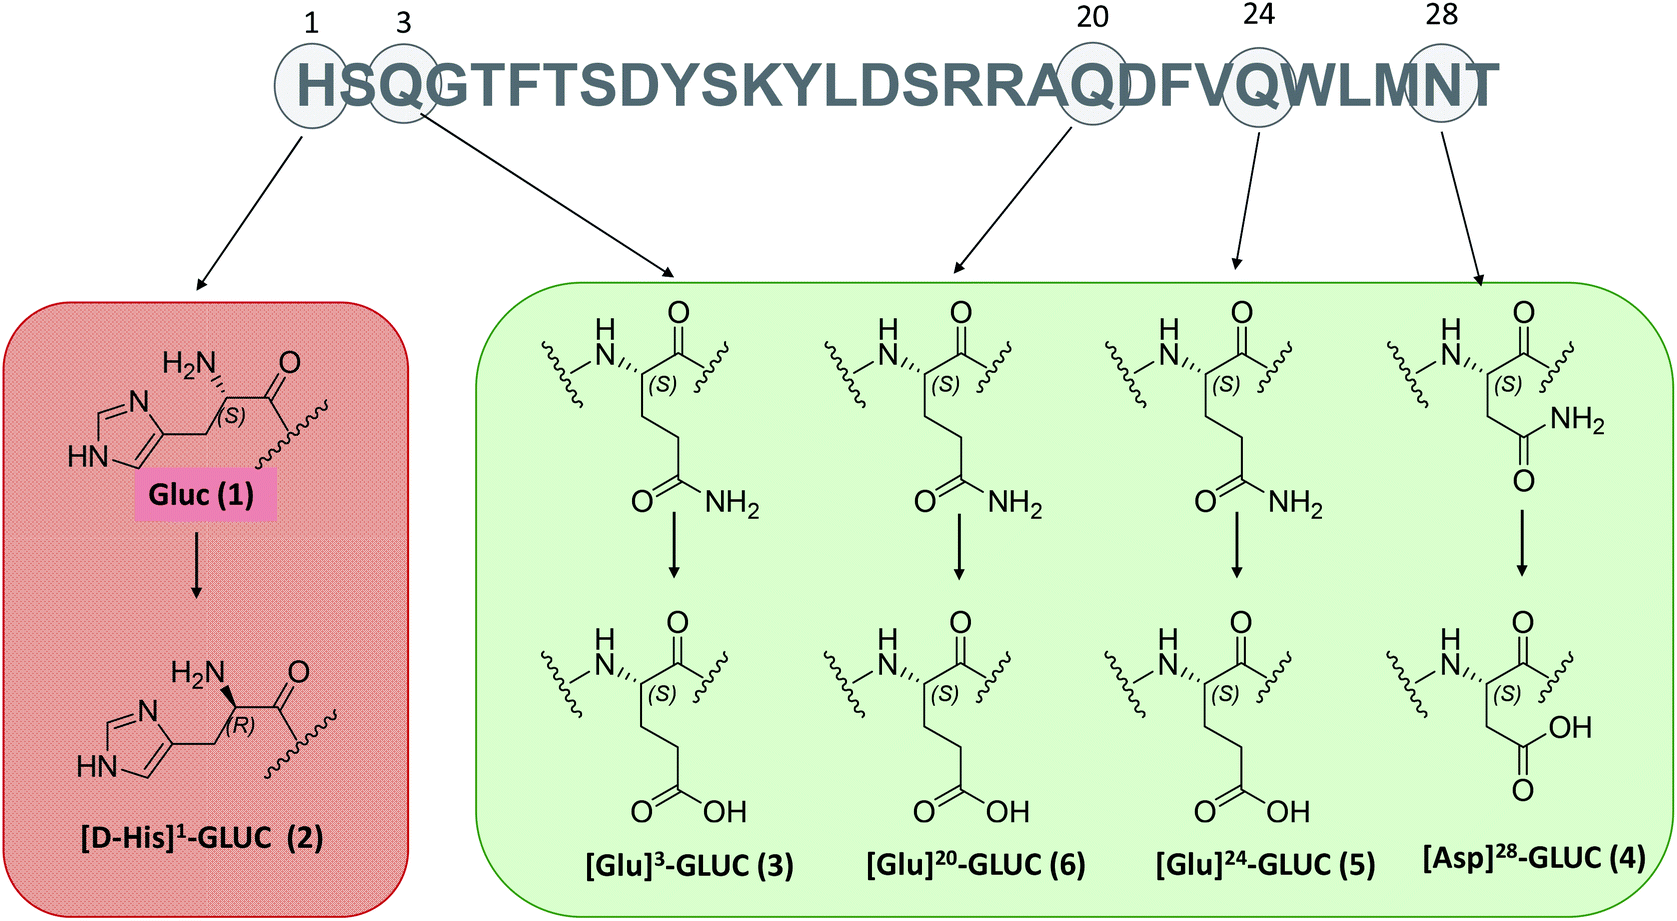 | ||
| Fig. 1 The amino acid sequence of glucagon with modifications analyzed in this work highlighted. The number in brackets refers to the elution order of the reference standards in IP-RP. | ||
Lastly, it is a basic peptide with an isoelectric point between 7.5 and 8.5.32 Attempts exploited to efficiently separate deamidated impurities of Glucagon revealed the anion-exchange chromatography as the best technique to separate and quantify these impurities.33 However, this technique has no resolutive power in discriminate epimers, such as [D-His]1-GLUC, from the main product. For this reason, the possibility to have a single chromatographic method to evaluate all the potential impurities coming from the manufacturing process and the degradative patterns will significantly simplify the analysis. The purpose of this work is, therefore, to develop an analytical method useful for characterizing and identifying the main impurities that can be found in basic biopharmaceuticals, with a particular emphasis on epimeric peptide impurities.
2. Materials and methods
2.1 Instrumentation
All the analyses were performed on a Waters Acquity UPLC (Ultra Performance Liquid Chromatography) instrument. This instrument includes a binary solvent manager with a maximum delivery flow rate of 2.0 mL min−1, an auto-sampler with a 5 μL loop injection, a column heater, a PDA photodiode array detector including a 500 nL flow cell, 80 Hz acquisition rate, resolution 4.8 nm. No filter time constant was used. 250 and 350 × 0.1 mm (L × I.D.) Viper capillaries (inlet/outlet) were used in order to minimize the extra-column contribution. With this configuration, the extra-column volume and variance (measured through uracil in presence of a zero dead-volume connector in place of the column) were 7.4 μL and 1.06 μL2 (at 0.6 mL min−1, mobile phase: 60![[thin space (1/6-em)]](https://www.rsc.org/images/entities/char_2009.gif) :40 ACN/H2O), respectively. Data acquisition and control of the UHPLC system was performed with the Empower 3 software by Waters.
:40 ACN/H2O), respectively. Data acquisition and control of the UHPLC system was performed with the Empower 3 software by Waters.
2.2 Chemicals
Reference standards, namely GLUC 1, [D-His]1-GLUC 2, [Glu]3-GLUC 3, [Glu]20-GLUC 6, [Glu]24-GLUC 5 and [Asp]28-GLUC 4 were gently given by Fresenius Kabi IPSUM (Italy).HPLC quality H2O and acetonitrile (ACN), tetrabutylammonium hydroxide (TBAOH) 30-hydrate (≥99% w/w), tetrabutylammonium hydrogen sulfate (TBAHSO4) (≥99% w/w), trifluoroacetic acid (TFA) (≥99%) and phosphoric acid solution (85% w/w) were purchased from Sigma Aldrich (St. Louis, MO, USA). All the solvents were filtered before use on a 0.2 μm filter.
2.3 Chromatographic conditions
The mobile phases used in this work are the following: (1) eluent A = H2O + TFA 13.8 mM (0.1% v/v); eluent B = ACN + TFA 13.8 mM (0.1% v/v); (2) eluent A: H2O + H3PO4 15 mM + TBAOH 10 mM (wpH = 2.2); eluent B = ACN + H3PO4 15 mM + TBAOH 10 mM (ApppH = 3.8); (3) eluent A = H2O + TFA 13.1 mM (0.1% v/v) + TBAOH 10 mM (wpH = 2.5); eluent B = ACN + TFA 13.1 mM (0.1% v/v) + TBAOH 10 mM (ApppH = 4.2); (4) eluent A = H2O + TBAHSO4 10 mM (wpH = 2.0); eluent B = ACN + TBAHSO4 10 mM (ApppH = 2.7); (5) eluent A = H2O + TBAHSO4 6 mM + TBAOH 4 mM + H3PO4 6 mM (wpH = 2.1); eluent B = ACN + TBAHSO4 6 mM + TBAOH 4 mM + H3PO4 6 mM (ApppH = 3.0).2.4 Columns
Several C18 columns with different features, such as column packed with fully porous particles (FPP) such as CSH and BEH technology particles [(A) ACQUITY UPLC® CSH C18 (100 mm × 3.0 mm L × I.D.) 1.7 μm 130 Å, (B) ACQUITY UPLC® BEH C18 (100 mm × 3.0 mm L × I.D.) 1.7 μm 130 Å, (C) ACQUITY UPLC® BEH C18 (150 mm × 2.1 mm L × I.D.) 1.7 μm 300 Å], up to those packed with superficially porous particles (SPP) [(D) Halo peptide C18 (150 mm × 4.6 mm L × I.D.) 2.7 μm 160 Å, (E) Halo peptide C18 (150 mm × 3.0 mm L × I.D.) 2.0 μm 160 Å] were used.3. Results & discussion
3.1 Ion-pair reversed-phase chromatography
The first attempt to analyze GLUC and its modifications was using trifluoroacetic acid (TFA) in the mobile phase, in order to work at acid pH and in ion-pair mode. As can be seen from Fig. S1 ESI† and Table 1, unacceptable asymmetry factors and poor efficiency and diastereoselectivity were recorded. However, the best results were obtained with the CSH column, confirming the enhanced effect of the positively charged surface in the resolution of these impurities.| Rs 1-2 | Rs 2-3 | Rs 3-4 | Rs 4-5 | Rs 5-6 | μ0 (mm s−1) | tG = 60 minutes | |
|---|---|---|---|---|---|---|---|
| A | 0.94 | 0.98 | 3.79 | — | — | 1.57 | From 23% B to 28% B |
| B | — | — | 1.20 | — | — | 1.58 | From 23% B to 28% B |
| C | — | — | 2.28 | — | — | 1.40 | From 24% B to 29% B |
| D | 0.87 | 0.92 | 2.56 | — | — | 1.67 | From 25% B to 29% B |
| E | — | — | — | — | — | 1.70 | From 26% B to 31% B |
3.2 Development of dynamic-electrostatic repulsion reversed-phase chromatography
Starting from this point, our study aimed to boost the separation of basic peptides by using in mobile phase a hydrophobic positively charged ion pair (IP) agent.The hydrophobic IP agent, present in the mobile phase, is adsorbed into the non-polar stationary phase due to its lipophilic alkyl chains. As a result, the IP agent generates a positively charged fluid surface, exploiting electrostatic repulsion with basic analytes under acidic pH conditions (Fig. 2).
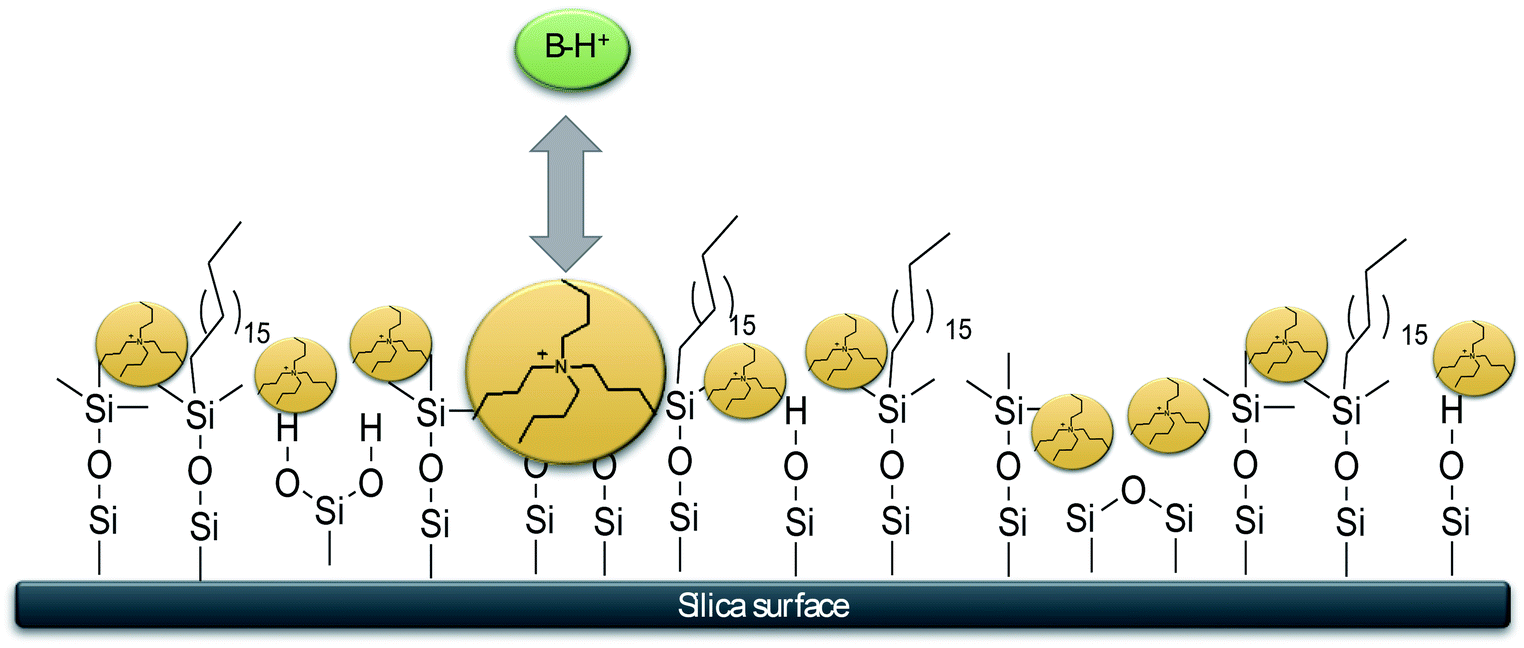 | ||
| Fig. 2 A typical RP monomeric-bonded silica (C18) endcapped with trimethylsilyl groups. It is worth nothing that in d-ERRP conditions, the hydrophobic IP agent, present in the mobile phase (TBA), is adsorbed into the non-polar stationary phase due to its lipophilic alkyl chains. As a result, the IP agent generates a positively charged fluid surface, exploiting electrostatic repulsion with basic analytes (B–H+) protonated under acidic pHs conditions. | ||
In this way, it is possible to mitigate the influence of unwanted interactions resulting in symmetrical peaks with shorter retention times compared to traditional RPLC, and therefore, faster analysis. This chromatographic strategy can be called “dynamic” d-ERRP in analogy to the term coined in 2014 by Gritti and Guiochon (the combination of intermolecular interactions is the same) but, in this case, the process is dynamic because it is generated in situ by the flow of the mobile phase.
Tetra butyl ammonium (TBA) was chosen as the IP cation (10 mM in mobile phase); moreover, several acid additives were used in order to make the pH of mobile phases acid (pH ≈ 2.5) and to study the chromatographic results changing the mobile phase anion. The columns described above were used, except for the CSH (which already has positively charged species covalently bound to the stationary phase).
The improvement turned out to be surprising: from the chromatograms obtained (Fig. S2 and Table S1 ESI†), it was clear that GLUC and its epimer [D-His]1-GLUC were entirely solved, and resolution values were considerably higher than those registered in IP-RP. The effect of repulsive interactions is clearly shown by the retention factor: in fact, about 7% less ACN was needed (compared to IP-RPLC) in order to maintain  . However, by using H3PO4 (15 mM), peak tailing was still present. The lowest asymmetry factor for GLUC was 2.3. According to this, as to decrease the asymmetry factors, we replaced the precedent acidic modifier with trifluoroacetic acid (TFA, 13.1 mM), providing better results. Peak shapes were improved on all the columns; however, on the other hand, we observed a decrease of Rs, even if the values were all higher than 1.2 (Fig. S3 and Table S2 ESI†). Excellent resolutions and good peak shape were achieved using 10 mM TBAHSO4 in the mobile phase (Fig. S4 and Table S3 ESI†). Notably, by using TBAHSO4 as an additive, we noted the inversion of the elution order between [D-His]1-GLUC and [Glu]3-GLUC, and [Glu]24-GLUC and [Glu]20-GLUC. Moreover, a higher content of ACN (compared to that used in the last two analyses described above) is needed in order to elute analytes. Under these conditions, with a gradient time of 60 minutes, we performed the analysis of a GLUC sample (produced by SPPS) enriched with the above-described impurities (Fig. 3A); the [D-His]1-GLUC was easily integrated into a highly enriched sample. Furthermore, the technique was found to be highly sensitive also for all the deamidated impurities, allowing us to identify and quantify all of them (Table 2). Outstanding results were also obtained with a short gradient of 15 minutes (Fig. 3B). Even in this case, the resolutions between GLUC and [D-His]1-GLUC were higher than 1.5, making this approach useful for the high-throughput analysis of many samples, e.g., all the fractions coming out from the downstream process (preparative purification) of peptides. Since the use of TBAHSO4 was found to be kinetically favorable (e.g., narrower and more efficient peaks), and that the use of H3PO4 and TBAOH (10 mM) instead provides greater selectivity between GLUC and [D-His]1-GLUC, we decided to use a mixture of the two anions in mobile phase (maintaining the concentration TBA 10 mM) obtaining the best separation (Fig. 4).
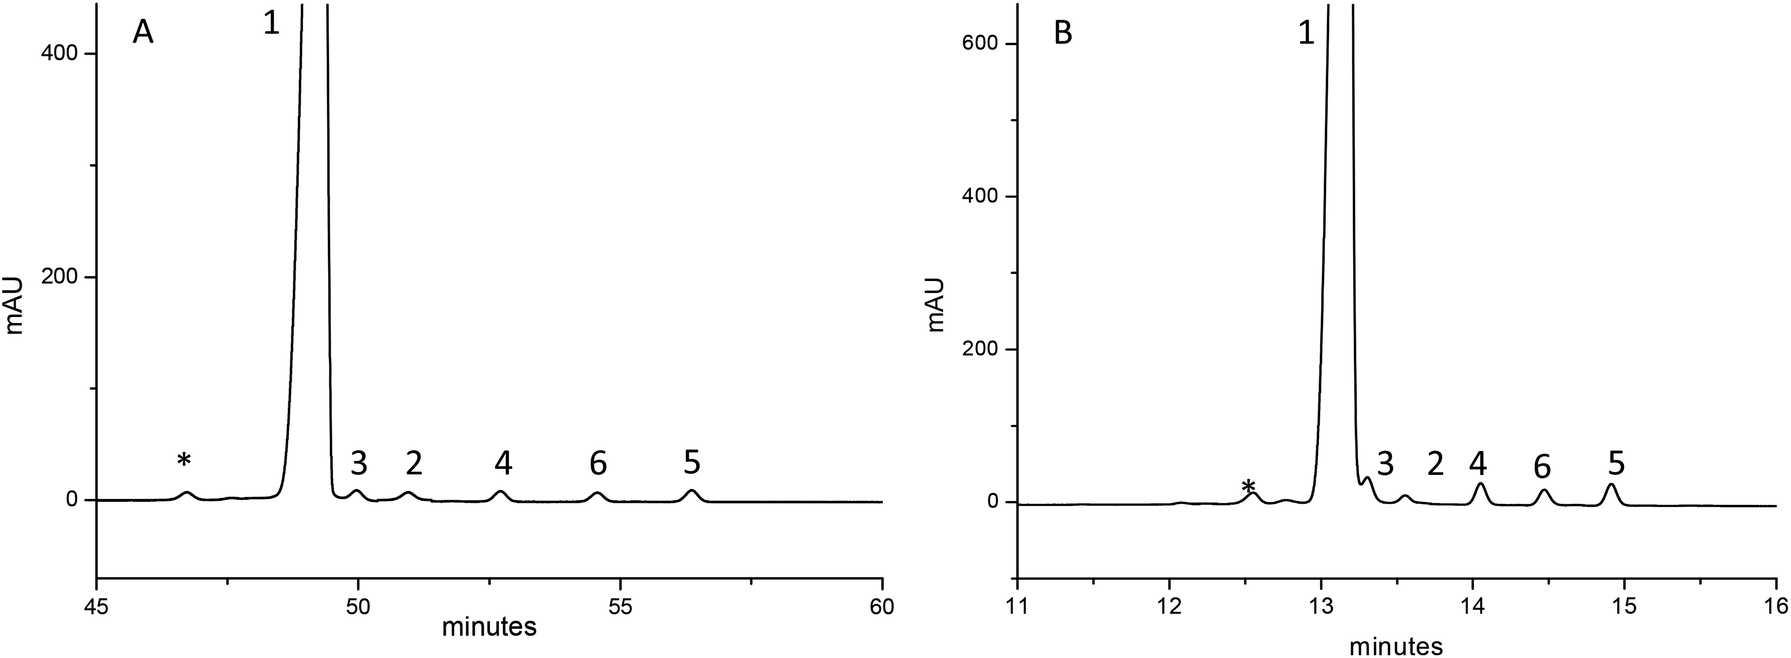 | ||
| Fig. 3 Analysis of a highly enriched GLUC (1) sample. Mobile phases 4 and column E (flow rate: 0.4 mL min−1) were used. Analyses were carried out by using a gradient time of 60 minutes (chromatogram A on the right, gradient elution: 23% B (0 min), 23% B (1 min), 29% B (61 min), 50% B (65 min), 50% B (70 min) and 23% B (71 min)); and a gradient time of 15 minutes (chromatogram B on the left, gradient elution: 26% B (0 min), 26% B (1 min), 29% B (16 min), 50% B (20 min), 50% B (25 min) and 26% B (26 min)). The asterisk denotes an unknown impurity. | ||
| * | 1 | 3 | 2 | 4 | 5 | 6 | |
|---|---|---|---|---|---|---|---|
| Area (%) | 0.4 | 97.4 | 0.4 | 0.4 | 0.5 | 0.5 | 0.6 |
| S/N | 32 | 5150 | 38 | 30 | 44 | 39 | 49 |
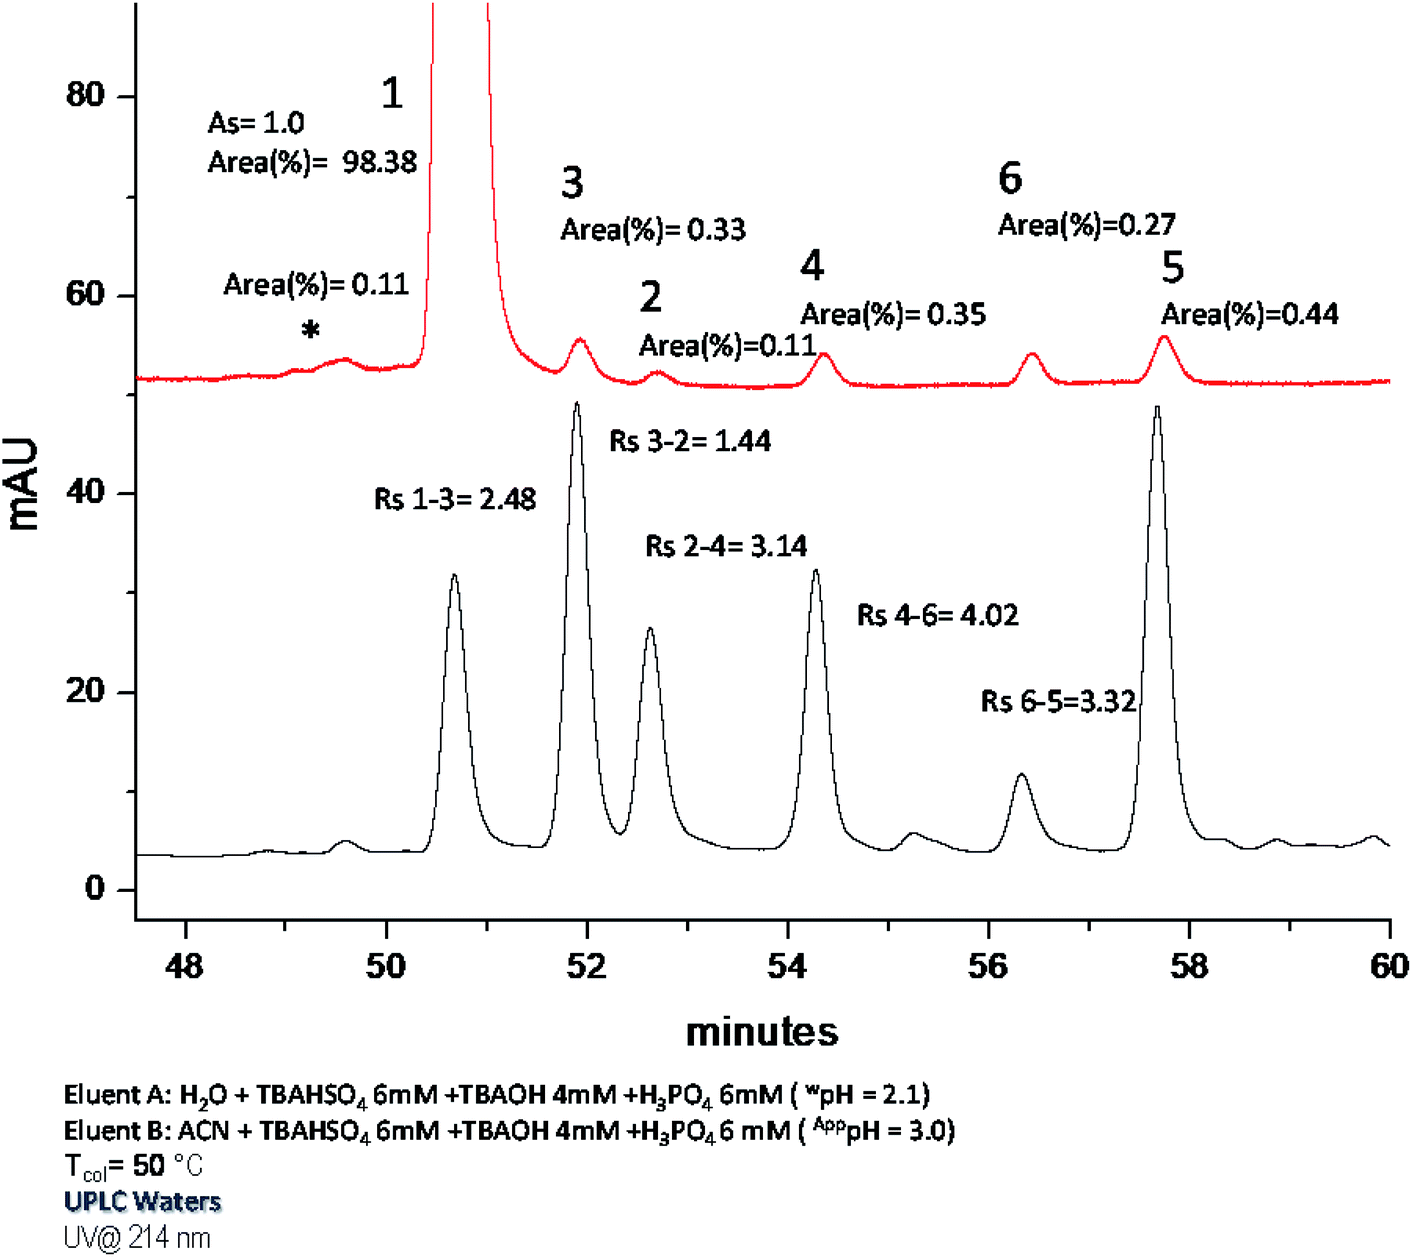 | ||
| Fig. 4 Column: Halo peptide C18 (150 mm × 3.0 mm L × I.D.) 2.0 μm 160 Å. Mobile phase 5: eluent A = H2O + TBAHSO4 6 mM + TBAOH 4 mM + H3PO4 6 mM (wpH = 2.1); eluent B = ACN + TBAHSO4 6 mM + TBAOH 4 mM + H3PO4 6 mM (ApppH = 3.0). Gradient profile: start 23% B, 0′–1′ 23% B, 61′ 28% B, 65′ 50% B, 70 50% B, 71 23% B. Flow rate: 0.4 mL min−1. Tcol: 50 °C. UV detection at 214 nm. Black chromatogram refers to reference standards (1–6), red trace to GLUC sample (produced by SPPS). The asterisk denotes an unknown impurity. | ||
In order to evaluate the repeatability of the method, we have replicated the analyses reported in Fig. 4, five times. The values of RSD (%) of retention times are reported in Table 3.
| Peak no. | Mean RT (min) | RSD (%) of RT |
|---|---|---|
| 1 | 50.68 | 0.056 |
| 3 | 51.905 | 0.041 |
| 2 | 52.67 | 0.188 |
| 4 | 54.29 | 0.104 |
| 6 | 56.365 | 0.113 |
| 5 | 57.68 | 0.098 |
Several basic-peptides were analysed using this method, and for the sake of completeness, we reported in ESI (Fig. S5 and S6 ESI†) some examples. In particular, the analysis of tetracosactide, (Fig. S6 ESI†) a synthetic basic peptide of 24-amino acid, whose theoretical isoelectric point is 10.64, allows to appreciate the significant improvement in terms of asymmetry factor from “static”-ERRP (As: 7.73 by using a CSH column and mobile phase 1) to d-ERRP (As: 1.10 by using column E, C18 based and commercially available, with the mobile phases 5).
Moreover, our group has recently published the results of the use of TBAOH in analysis of small basic-molecules.34
Lastly, it is worth noting the difference in loading that has been observed between IP-RP, “static”-ERRP, and d-ERRP. Working in d-ERRP, the chromatographic system responds much better respect to the other techniques when an increased mass of analyte is injected into the column. This makes it a useful technique for the analysis of impurities in trace amounts that elutes after the main peak, allowing to match the tight specification requested by the worldwide regulatory agencies (Fig. S7 ESI†).35
4. Conclusion
To the best of our knowledge, it is the first time that an ion pair agent (such as the TBA) is used for promoting the elution of a peptide that, at the operating pH, has the same (positive) charge as the IP-agent. This electrostatic repulsion mechanism occurs thanks to the TBA adsorbed on the apolar stationary phase (C18) through a van der Walls interactions network between its alkyl chain and octadecyl chain on silica particles surface. This mechanism is confirmed by the lower amount of ACN required for the elution of the analyte in d-ERRP respect to IP-RP. In fact, due to the repulsive effect exploited by TBA on the product GLUC, it has less interaction with the stationary phase and elutes earlier respect to the IP-RP analysis.Moreover, it is noteworthy to observe that the developed d-ERRP strategy for GLUC is so effective in discriminating its epimer [D-His]1-GLUC, probably thanks to the basic nature of the amino acid involved (histidine). This constitutes a very attractive feature of this approach since histidine is probably the most susceptible to the epimerization of the natural amino acids.36
Nevertheless, comparing analyses carried out using mobile phases with the same pH, the same concentration of TBA (10 mM) but different mobile phase anion, we noted significant differences in selectivity, resolution, peak shape, and content of ACN needed in order to elute analytes. This aspect underlines how the different nature of the anion influences the equilibria that arise in the system. Indeed, the mechanism by which anions in the mobile phase (H2PO4−, CF3COO− and HSO4−) influences the chromatographic performance of the system can be attributed to their ranking in the Hofmeister series.37 The rationalization of the different equilibria that can be in such system is not trivial; indeed, while the adsorption of IP agent on the hydrophobic stationary phase has been and profoundly evaluated,38,39 and a rationale of the behavior of inorganic additive in RPLC has been assessed,40–44 the presence of both additives has not yet been taken into consideration, as well as a comprehensive theoretical model.
However, it is not a technique that can be interfaced with mass spectrometry due to the low volatility of IP agents. Attempt to adapt the strategy using volatile IP agents, such as TEA (Fig. S8 ESI†), did not provide comparable results. Anyway, in the case of epimers discrimination, where the d-ERRP approach reveals its efficacy, the chromatographic separation is more significant than MS detection.
In conclusion, we developed an effective and sensitive method for the separation of related substances present in peptides with basic properties. Using Glucagon as a case study, the d-ERRP method proved to be able to entirely separate epimers and other process/degradative species using only one single chromatographic method, reducing the peak tailing, decreasing the analysis time, and decreasing the amount of organic modifier needed. Furthermore, the proposed method is of general applicability; in fact, it can be used with all the appropriate silica-based RP packings material, for the analysis of basic proteins, peptides, and small molecules. Even if the retention mechanism still needs to be fully clarified and will be the subject of further studies, the reported d-ERRP approach will provide a novel, enhanced instrument on the toolbox of the analyst, improving the evaluation of the quality of the marketed molecules and candidates, in the quest of safer and more effective drugs for the patients.
Conflicts of interest
There are no conflicts to declare.Acknowledgements
The authors thank the Sapienza–Fresenius Kabi agreement 2018 and Italian University and Scientific Research Ministry (grant PRIN 2017Y2PAB8 003).Notes and references
- J. L. Lau and M. K. Dunn, Bioorg. Med. Chem., 2018, 26, 2700–2707 CrossRef CAS PubMed.
- S. L. Aronoff, K. Berkowitz, B. Shreiner and L. Want, Diabetes Spectr., 2004, 17, 183–190 CrossRef.
- F. G. Banting, C. H. Best, J. B. Collip, W. R. Campbell and A. A. Fletcher, Can. Med. Assoc. J., 1922, 12, 141–146 CAS.
- A. Loffet, J. Pept. Sci., 2002, 8, 1–7 CrossRef CAS PubMed.
- I. Gill, R. López-Fandiño, X. Jorba and E. N. Vulfson, Enzyme Microb. Technol., 1996, 18, 162–183 CrossRef CAS.
- T. Bruckdorfer, O. Marder and F. Albericio, Curr. Pharm. Biotechnol., 2005, 5, 29–43 Search PubMed.
- A. K. Sato, M. Viswanathan, R. B. Kent and C. R. Wood, Curr. Opin. Biotechnol., 2006, 17, 638–642 CrossRef CAS PubMed.
- A. C. Lee, J. L. Harris, K. K. Khanna and J. H. Hong, Int. J. Mol. Sci., 2019, 20(10), 2383 CrossRef PubMed.
- L. Knudsen, Front. Endocrinol., 2019, 10, 155 CrossRef PubMed.
- K. L. Tran, Y. I. Park, S. Pandya, H. J. Muliyil, D. B. Jensen, K. Huynh and Q. T. Nguyen, American Health & Drug Benefits, 2017, 10(4), 178–188 Search PubMed.
- M. J. Moon, S. Park, D. K. Kim, E. B. Cho, J. I. Hwang, H. Vaudry and J. Y. Seong, Front. Endocrinol., 2012, 3, 1–9 Search PubMed.
- A. A. Zompra, A. S. Galanis, O. Werbitzky and F. Albericio, Future Med. Chem., 2009, 1, 361–377 CrossRef CAS PubMed.
- P. Vlieghe, V. Lisowski, J. Martinez and M. Khrestchatisky, Drug Discovery Today, 2010, 15, 40–56 CrossRef CAS PubMed.
- R. B. Merrifield, J. Am. Chem. Soc., 1963, 85, 2149–2154 CrossRef CAS.
- M. Verlander, Int. J. Pept. Res. Ther., 2007, 13(1–2), 75–82 CrossRef CAS.
- W. Chan and P. White, Fmoc Solid Phase Peptide Synthesis: A Practical Approach, OUP Oxford, 2000 Search PubMed.
- Y. Yang, Side Reactions in Peptide Synthesis, Academic Press, 2015 Search PubMed.
- ANDAs for Certain Highly Purified Synthetic Peptide Drug Products That Refer to Listed Drugs of rDNA Origin Guidance for Industry, FDA Guidance, Oct 2017 Search PubMed.
- B. Zhang, R. Soukup and D. W. Armstrong, J. Chromatogr. A, 2004, 1053, 89–99 CrossRef CAS PubMed.
- C. Czerwenka and W. Lindner, Anal. Bioanal. Chem., 2005, 382, 599–638 CrossRef CAS PubMed.
- K. Trzeciak-Karlikowska, A. Bujacz, W. Ciesielski, G. D. Bujacz and M. J. Potrzebowski, J. Phys. Chem. B, 2011, 115, 9910–9919 CrossRef CAS PubMed.
- M. A. Ewing, J. Wang, S. A. Sheeley and J. V. Sweedler, Anal. Chem., 2008, 80, 2874–2880 CrossRef CAS PubMed.
- Y. Tao, N. R. Quebbemann and R. R. Julian, Anal. Chem., 2012, 84, 6814–6820 CrossRef CAS PubMed.
- K. Jeanne Dit Fouque, A. Garabedian, J. Porter, M. Baird, X. Pang, T. D. Williams, L. Li, A. Shvartsburg and F. Fernandez-Lima, Anal. Chem., 2017, 89, 11787–11794 CrossRef CAS PubMed.
- B. Larsen, V. Viswanatha, S. Y. Chang and V. J. Hruby, J. Chromatogr. Sci., 1978, 16, 207–210 CAS.
- B. Larsen, B. L. Fox, M. F. Burke and V. J. Hruby, Int. J. Pept. Protein Res., 1979, 13, 12–21 CrossRef CAS PubMed.
- D. V. McCalley, J. Chromatogr. A, 2010, 1217, 858–880 CrossRef CAS PubMed.
- T. H. Walter and R. W. Andrews, TrAC, Trends Anal. Chem., 2014, 63, 14–20 CrossRef CAS.
- C. Wang, Z. Guo, Z. Long, X. Zhang and X. Liang, J. Chromatogr. A, 2013, 1281, 60–66 CrossRef CAS PubMed.
- F. Gritti and G. Guiochon, J. Chromatogr. A, 2014, 1374, 112–121 CrossRef CAS PubMed.
- G. Jiang and B. B. Zhang, Am. J. Physiol.: Endocrinol. Metab., 2003, 284 Search PubMed.
- J. S. Pedersen, J. Diabetes Sci. Technol., 2010, 4, 1357–1367 CrossRef PubMed.
- S. Gorog, Identification and Determination of impurities in Drugs, 2000, p. 673 Search PubMed.
- S. Manetto, G. Mazzoccanti, A. Ciogli, C. Villani and F. Gasparrini, J. Sep. Sci., 2020, 1–10 Search PubMed.
- N. H. Davies, M. R. Euerby and D. V. McCalley, J. Chromatogr. A, 2007, 1138, 65–72 CrossRef CAS PubMed.
- D. S. Kemp, Racemization in Peptide Synthesis, ACADEMIC PRESS, INC., 1979, DOI:10.1016/b978-0-12-304201-9.50013-8.
- H. I. Okur, J. Hladílková, K. B. Rembert, Y. Cho, J. Heyda, J. Dzubiella, P. S. Cremer and P. Jungwirth, J. Phys. Chem. B, 2017, 121, 1997–2014 CrossRef CAS PubMed.
- Á. Bartha and J. Ståhlberg, J. Chromatogr. A, 1994, 668, 255–284 CrossRef.
- C. Horvath, W. Melander, I. Molnar and P. Molnar, Anal. Chem., 1977, 49, 2295–2305 CrossRef CAS.
- J. Zhang, T. Raglione, Q. Wang, B. Kleintop, F. Tomasella and X. Liang, J. Chromatogr. Sci., 2011, 49, 825–831 CAS.
- J. Flieger, J. Chromatogr. A, 2006, 1113, 37–44 CrossRef CAS PubMed.
- T. Cecchi and P. Passamonti, J. Chromatogr. A, 2009, 1216, 1789–1797 CrossRef CAS PubMed.
- A. Vemić, M. Kalinić, S. Erić, A. Malenović and M. Medenica, J. Chromatogr. A, 2015, 1386, 39–46 CrossRef PubMed.
- J. M. Roberts, A. R. Diaz, D. T. Fortin, J. M. Friedle and S. D. Piper, Anal. Chem., 2002, 74, 4927–4932 CrossRef CAS PubMed.
Footnote |
| † Electronic supplementary information (ESI) available: Experimental section, and chromatographic data. See DOI: 10.1039/d0ra01296c |
| This journal is © The Royal Society of Chemistry 2020 |