DOI:
10.1039/D0RA01273D
(Paper)
RSC Adv., 2020,
10, 20991-20999
Persulfate activation by nano zero-valent iron for the degradation of metoprolol in water: influencing factors, degradation pathways and toxicity analysis†
Received
10th February 2020
, Accepted 28th May 2020
First published on 3rd June 2020
Abstract
In this study, nano zero-valent iron (nZVI) was utilized to activate persulfate (PS) for the degradation of metoprolol (MTP), a commonly used drug for curing cardiovascular diseases, in water. Quenching tests indicated that both the sulfate radical (SO4˙−) and hydroxyl radical (˙OH) contributed to the degradation of MTP, while SO4˙− seemed to play a large role under natural pH conditions. Batch tests were conducted to investigate the effects of several influencing factors, such as PS concentration, initial MTP concentration, pH, temperature and common anions, on the degradation performance of MTP. Generally, lower MTP concentration and pH values, and higher PS concentration and temperature favoured MTP degradation. HCO3−, NO3− and SO42− were found to inhibit MTP degradation, while Cl− enhanced MTP degradation. Several corrosion products of nZVI, including Fe3O4, Fe2O3 and FeSO4, were formed during the reaction, which was reflected by the combined XRD and XPS analysis. Degradation pathways of MTP were proposed according to the identified transformation products, and the peak areas of the major products along with the time were also monitored. Finally, the toxicity of the reaction solution was assessed by experiments using Aliivibrio fischeri. Overall, it could be concluded that nZVI/PS might be a promising method for the rapid treatment of MTP-caused water pollution.
1. Introduction
Beta (β)-blockers are a type of drug that can inhibit the activation and stimulation of beta-adrenergic receptors in multiple organs and are extensively used for curing cardiovascular diseases, i.e., angina and hypertension.1 Currently, this kind of drug is often detected in wastewaters or surface waters at concentrations in the range of ng L−1 to μg L−1, largely due to their wide utilization as well as incomplete removal by our conventional wastewater treatment plants (WWTPs).2,3 As a frequently prescribed β-blocker, metoprolol (MTP) shows higher stability and has a longer estimated half-life in comparison with two other commonly prescribed β-blockers, propranolol and atenolol, under the condition of simulated solar irradiation.4 A considerable number of studies have demonstrated that β-blockers including MTP have potential environment risks.5,6 Therefore, due to their side effects on our ecosystem and their low removal efficiency by WWTPs, a method to remove these compounds efficiently from the aquatic environment by suitable technologies is urgently required.
Lately, emerging sulfate radical (SO4˙−)-based advanced oxidation processes have gained much attention owing to their ability to decompose and mineralize recalcitrant micro organic pollutants in aqueous solution. SO4˙− (2.5–3.1 V) has a comparable or even higher standard redox potential than ˙OH (2.8 V), which can also readily degrade organic contaminants.7,8 Commonly, SO4˙− can be produced from stable and low-cost persulfate (PS) or peroxymonosulfate (PMS) by various activation paths, i.e., ultraviolet radiation, transition metals, heat, and ultrasound (US), as shown in eqn (1).9
| | |
S2O82− + activator → SO4˙− + (SO4˙− or SO42−)
| (1) |
| | |
Fe2+ + S2O82− → SO4˙− + SO42− + Fe3+
| (2) |
| | |
Fe2+ + SO4˙− → Fe3+ + SO42−
| (3) |
| | |
2Fe0 + O2 + 2H2O → 2Fe2+ + 4OH−
| (4) |
| | |
Fe0 + 2H2O → Fe2+ + 2OH− + H2
| (5) |
| | |
Fe0 + S2O82− → Fe2+ + 2SO42−
| (6) |
Among these methods, transition metals, especially iron species such as ferrous iron (Fe2+), are generally recognized as highly effective and non-toxic activators of PS to produce SO4˙− (eqn (2)).10 Considering that ferrous iron (Fe2+) is hard to regenerate after rapid oxidation to ferric iron (Fe3+) and excess Fe2+ can also scavenge SO4˙− (eqn (3)), the application of such a process for water treatment would be easily restricted.10 To overcome this drawback intrinsic to Fe2+ activated PS system, zero-valent iron (ZVI) is considered as a potential alternative that can maintain proper quantities of Fe2+ during the activation of PS. To further improve the efficiency of the ZVI/PS system, nanoscale ZVI has recently been widely adopted for PS activation to remove organic contaminants in water owing to its larger surface area and high reactivity.11 During the nZVI/PS system, dissolved Fe2+ can be generated from the corrosion of nZVI (eqn (4)–(6)), which would serve as the activator for PS to produce SO4˙−.12 In addition, Fe0 is capable of regenerating Fe3+ to Fe2+ on its surface (eqn (7)) as well as reducing the precipitation of iron hydroxides, which would accelerate the decomposition of the target contaminants.13,14
Hence, in the present study we aimed to evaluate the feasibility of the nZVI/PS system for degrading MTP in water and to investigate the effects of major influencing factors, including PS concentration, initial MTP concentration, pH, temperature and anions. Then, the variation of nZVI after PS corrosion were analysed by XRD and XPS. Furthermore, four possible degradation pathways were tentatively put forward according to the intermediate products. Lastly, Aliivibrio fischeri experiments was used to estimate the toxicity of MTP and its products.
2. Materials and methods
2.1. Chemicals
High ultrapure water, obtained from a Milli-Q water purification system, was used for preparing all the solutions. Metoprolol tartrate salt (98%), commercial nZVI (50 nm) and ferrous sulfate heptahydrate (>99%) were acquired from Aladdin (Shanghai, China). Sodium persulfate (PS), tert-butanol (TBA), ethanol (EtOH), sodium hydroxide (NaOH), sulfuric acid (H2SO4), sodium chloride (NaCl), sodium sulfate anhydrous (Na2SO4), sodium nitrate (NaNO3) and sodium bicarbonate (NaHCO3) were purchased from Shanghai Sinopharm Chemical Reagent Co., Ltd (China). The effluent of the secondary treatment was collected from one wastewater treatment plant (WWTP) in Shanghai, China. The major qualities of WWTP effluent were summarized in Table S1.† The WWTP effluent were filtered through a 0.45 μm membrane filter with 48 h after sampling and stored at 4 °C until use.
2.2. Experimental procedure
Batch experiments were conducted in 500 mL beakers containing 300 mL reaction solution. All the tests were maintained at a fixed temperature of 20 ± 1 °C via a water bath. A mechanical agitator (HJ-4S, Jiangsu Jintan Xicheng Xinrui Instrument Factory, China) was placed in the middle of the beaker to guarantee the solution mixed thoroughly during the reaction. The reactions were initiated by adding appropriate amounts of PS and nZVI to the MTP solution. Control tests in which PS was activated by Fe2+ were also conducted using the same molar ratio as nZVI did. The desired solution pH values were adjusted by adding 1 N NaOH or H2SO4. Aqueous samples were collected at designated times and immediately filtered through a 0.22 μm pore polytetrafluoroethylene filter and then instantly quenched with EtOH for further analysis. All the tests were conducted in triplicate, and the mean values were recorded and reported.
2.3. Analyses
MTP was quantified using a Shimadzu HPLC system (Japan) equipped with a UV detector set at 222 nm and a Waters C18 column (5 μm, 4.6 × 250 mm). The mobile phase consisted of acetonitrile and 10 mM acetate buffer (v/v, 40/60) at a flow rate of 0.8 mL min−1. The Fe2+ and PS concentrations were quantified using the o-phenanthroline and potassium iodide spectrophotometric methods, respectively. Total organic carbon (TOC) was measured by a Multi N/C 3100 carbon analyser (Analytik Jena, Germany).
The intermediate products of MTP were analyzed by LC/MS/MS, which consisted of a HPLC system (Waters, e2695) and a TSQ Quantum mass spectrometer (Thermo) equipped with an electrospray ionization (ESI) source and operating in positive mode. Products separation were acquired on a Hypersil Gold C18 column (5 μm, 2.1 × 150 mm, Thermo). Elution was performed at a flow rate of 0.25 mL min−1 with 10 mM acetate buffer (solvent A) and acetonitrile (solvent B). A gradient programme was adopted as follows: 1% B for the first 5 min, linear increase to 50% B for the afterward 10 min and gradual decrease to 1% B over the next 10 min. The spray voltage was 3.5 kV. The sheath gas pressure and the capillary temperature were 30 arbitrary units and 250 °C, respectively. The mass analyser was operated in both full scan mode and product scan mode for product identification.
The morphology of nZVI was examined by transmission electron microscopy (TEM) (JEM 2100 F) at 200 kV. The crystal structure of nZVI was analysed by X-ray diffraction (XRD) (Dmax 2500, Rigaku, Japan), and the elemental composition of nZVI was analysed by X-ray photoelectron spectroscopy (XPS) (Kratos AXIS SUPRA, Shimadzu, Japan).
2.4. Toxicity evaluation
The acute toxicity of samples treated with nZVI/PS was determined by quantifying the decrease in the bioluminescence of Aliivibrio fischeri. The luminescence was detected using a Mithras LB 940 multimode microplate reader (Berthold Technologies, Germany). The inhibition rate is expressed by eqn (8).| |
 | (8) |
where L0 and L are the luminosity of the blank sample and the reaction samples, respectively.
3. Results and discussion
3.1. Removal of MTP under different systems
Tests were first performed to evaluate the removal performance of MTP by four different systems, namely, PS, nZVI, Fe2+/PS and nZVI/PS. Fig. 1(a) shows that no noticeable MTP degradation within 30 min for PS or nZVI alone. In contrast, the degradation of MTP largely improved in the latter two systems, reaching 47.5% and 91.1% in the Fe2+/PS and nZVI/PS systems after 30 min of treatment, respectively. The enhancement of MTP degradation is attributed to the production of high oxidizing power species (SO4˙−/˙OH).7 In addition, the Fe2+/PS system seemingly achieved a higher MTP degradation rate in the initial phase. This phenomenon could be attributed to a fast reaction between Fe2+ and PS to rapidly produce a higher amount of SO4˙− that resulting in a significant MTP degradation rate. While, the formed Fe3+ was difficult to reduced back to Fe2+, thus less production of SO4˙− led to the termination of the degradation of MTP in the subsequent phase. However, as an iron source, nZVI can gradually release Fe2+, resulting the scavenging effect caused by excess Fe2+ becomes weaken and the production of SO4˙− becomes more moderately, which could explain the better performance on MTP degradation in the latter period during the nZVI/PS system.
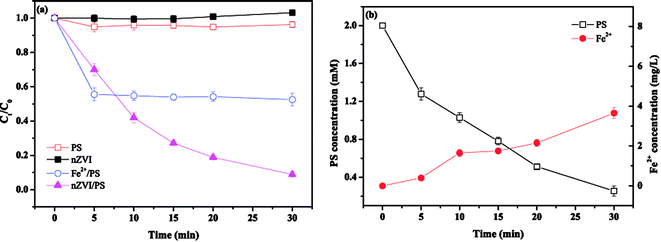 |
| | Fig. 1 (a) Removal of MTP under different systems; (b) the changes in PS and Fe2+ concentrations in the nZVI/PS system. Conditions: [MTP]0 = 0.05 mM, [PS]0 = 2 mM, [nZVI]0 = 0.33 g L−1 (5.89 mM), [Fe2+]0 = 5.89 mM, no pH adjustment. | |
The variation in the PS and Fe2+ concentrations was monitored during the treatment in order to interpret the interactions between PS and nZVI. As presented in Fig. 1(b), the PS concentration significantly decreased from 2 to 0.25 mM within 30 min, while the concentration of Fe2+ only increased from 0 to 3.6 mg L−1 at 30 min. This slight increase indicated that Fe2+ was consumed to speed up the reaction described in eqn (2), thereby leading to an increase in PS decomposition. In addition, excess Fe2+ can scavenge SO4˙−, resulting in less Fe2+ but more Fe3+ (eqn (3)).13,14 However, the recycling of Fe3+ to Fe2+ on the surface of nZVI can maintain a suitable Fe2+ concentration in solution (eqn (7)).
Both SO4˙− and ˙OH may participated in the degradation of MTP during the nZVI/PS process. EtOH and TBA were selected as probes during the reaction to confirm the major oxidizing species for MTP degradation. EtOH has been reported to react with both SO4˙− (1.6–7.7 × 10⁷ M−1 s−1) and ˙OH (1.2–2.8 × 10⁹ M−1 s−1) at high rates. While, TBA reacts with SO4˙− and ˙OH at different rates, and the second order rate constant for TBA reacting with ˙OH is 3.8–7.6 × 10⁸ M−1 s−1, which is about 3-order greater than that with SO4˙− (4.0–9.1 × 10⁵ M−1 s−1).15 Fig. S1† presents the degradation of MTP decreased from 91.1% to 83.4% and 63.6%, respectively, in the presence of 20 mM TBA or EtOH ([scavenger]0/[PS]0 = 10![[thin space (1/6-em)]](https://www.rsc.org/images/entities/char_2009.gif) :
:![[thin space (1/6-em)]](https://www.rsc.org/images/entities/char_2009.gif) 1). Moreover, when the concentration of TBA or EtOH reached to 200 mM ([scavenger]0/[PS]0 = 100
1). Moreover, when the concentration of TBA or EtOH reached to 200 mM ([scavenger]0/[PS]0 = 100![[thin space (1/6-em)]](https://www.rsc.org/images/entities/char_2009.gif) :
:![[thin space (1/6-em)]](https://www.rsc.org/images/entities/char_2009.gif) 1), the degradation of MTP further decreased to 72.5% and 25.3%, respectively. The inhibition of the degradation of MTP in the presence of TBA was much less than that in the presence of EtOH, indicating that despite both SO4˙− and ˙OH contributed to the degradation of MTP, SO4˙− had a more predominant role.
1), the degradation of MTP further decreased to 72.5% and 25.3%, respectively. The inhibition of the degradation of MTP in the presence of TBA was much less than that in the presence of EtOH, indicating that despite both SO4˙− and ˙OH contributed to the degradation of MTP, SO4˙− had a more predominant role.
3.2. Effect of PS concentration
The effect of PS concentration on MTP degradation is shown in Fig. 2. As seen, the degradation of MTP increased from 40.2% to 96.3% as the PS concentration rised from 0.5 to 3 mM, revealing that a higher PS concentration favoured MTP degradation. This enhancement could be ascribed to the greater decomposition of PS to produce more SO4˙−. However, as the PS concentration further increased to 4 mM, the degradation of MTP remained almost unchanged, probably due to the side reaction between SO4˙− and excess PS and the self-combination of SO4˙−, causing an insignificant improvement during the process (eqn (9) and (10)).16| | |
SO4˙− + S2O82− → 2SO42− + S2O8˙−, k = 6.1 × 10⁵ M−1 s−1
| (9) |
| | |
SO4˙− + SO4˙− → S2O82−, k = 4.0 × 10⁵ M−1 s−1
| (10) |
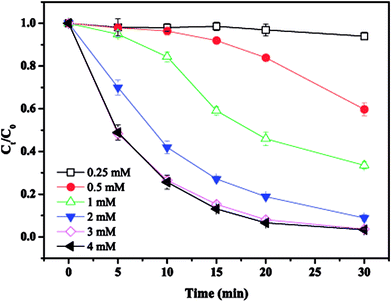 |
| | Fig. 2 Effect of PS concentration on MTP degradation. Conditions: [MTP]0 = 0.05 mM, [PS]0 = 0.25–4 mM, [nZVI]0 = 0.33 g L−1, no pH adjustment. | |
3.3. Effect of initial MTP concentration
The effect of initial MTP concentration on MTP degradation is shown in Fig. 3. As displayed in Fig. 3, the degradation efficiency of MTP was largely depended on its initial concentration. When the initial concentration was 0.01 mM, almost completely MTP removal was achieved within 30 min. With the initial MTP concentration increased from 0.1 mM to 0.2 mM, the MTP degradation efficiency decrease to 47.5%. Thus, higher initial MTP concentration resulted a lower removal efficiency. Generally, the generation of SO4˙− would be constant under identical conditions. Further, increasing initial MTP concentration would increase the time took to transfer to the nZVI surface, thus reducing the rate of SO4˙− yielded by PS activated by nZVI.17
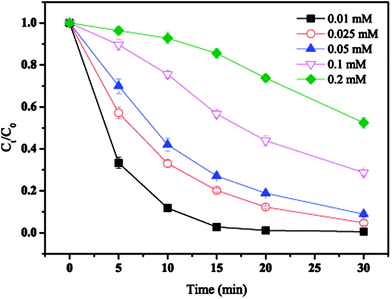 |
| | Fig. 3 Effect of initial MTP concentration on MTP degradation. Conditions: [MTP]0 = 0.01–0.2 mM, [PS]0 = 2 mM, [nZVI]0 = 0.33 g L−1, no pH adjustment. | |
3.4. Effect of initial pH
The effect of the initial solution pH on MTP degradation is shown in Fig. 4. It can be clearly observed that the maximum degradation efficiency of 99.5% was achieved at pH 3 and almost 88.7% of MTP was degraded within the first 5 min. With the pH rised from 5 to 9, the degradation of MTP slightly reduced from 95.9% to 83.8%. These results verified that acidic conditions favour MTP degradation because of the generation of more SO4˙− by accelerated nZVI corrosion to activate PS (eqn (11)).18 However, it is worth noting that significant inhibition of MTP degradation was observed at pH 11, suggesting that the degradation is hindered under alkaline conditions. As the pH increased, more ˙OH would be produced according to eqn (12) and (13).19 ˙OH can also be scavenged by a high concentration of OH− (eqn (14)).20 Moreover, the precipitates of Fe2+ and Fe3+ under strong alkaline conditions (eqn (15) and (16)) covered the nZVI surface, thus leading to less release of Fe2+ for PS activation.21| | |
Fe0 + 2H+ → Fe2+ + H2
| (11) |
| | |
All pH: SO4˙− + H2O ↔ SO42− + H+ + ˙OH
| (12) |
| | |
Alkaline pH: SO4˙− + OH− → SO42− + ˙OH
| (13) |
| | |
˙OH + OH− → ˙O− + H2O, k = 1.2 × 10¹⁰ M−1 s−1
| (14) |
| | |
Fe2+ + 2OH− → Fe(OH)2
| (15) |
| | |
Fe3+ + 3OH− → Fe(OH)3
| (16) |
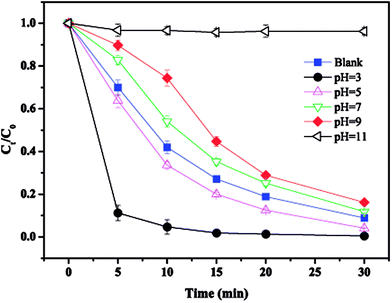 |
| | Fig. 4 Effect of initial pH on MTP degradation. Conditions: [MTP]0 = 0.05 mM, [PS]0 = 2 mM, [nZVI]0 = 0.33 g L−1, pH = 3–11. | |
3.5. Effect of temperature
The effect of temperature on MTP degradation is shown in Fig. 5. The degradation slightly increased from 91.1% to 94.9% after 30 min as the temperature increased from 20 to 55 °C (293–328 K). These findings indicate that higher temperatures favour MTP degradation, possibly because the reaction between PS with Fe2+ is accelerated by increasing the temperature (eqn (2)).22 Another possible explanation is that more Fe2+ is produced by iron corrosion in the nZVI/PS system under higher temperature conditions (eqn (4) and (5)).18 There is a good linear relationship between ln![[thin space (1/6-em)]](https://www.rsc.org/images/entities/char_2009.gif) k and 1/T as exhibited in the inset of Fig. 4, and the data are well fit by the Arrhenius equation described in eqn (17).
k and 1/T as exhibited in the inset of Fig. 4, and the data are well fit by the Arrhenius equation described in eqn (17).| |
 | (17) |
where k is the initial rate constant for each temperature (s−1), A is the pre-exponential factor (s−1), Ea is the apparent activation energy (kJ mol−1), R is the universal gas constant (8.314 J mol−1 K−1), and T is the absolute temperature (K). Then, the activation energy was determined as 14.58 kJ mol−1, the value is relatively lower than that required for other previously reported contaminants, such as 2,4-dichlorophenol (91.5 kJ mol−1),17 and fenitrothion (90.6 kJ mol−1)23 and bentazon (43.5 kJ mol−1),18 indicating that such a reaction can be easily attained. However, prior studies also revealed that rapid consumption of PS and side reactions may also occur simultaneously at higher temperatures, which can explain the slight increase in MTP removal within 30 min by nZVI/PS under different temperatures.24 Therefore, an optimal temperature should be determined for efficient removal of MTP in practical usage.
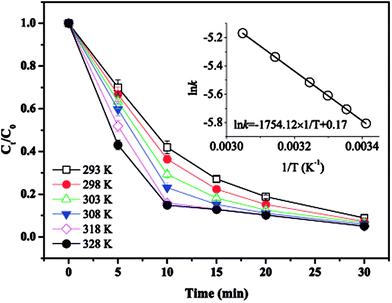 |
| | Fig. 5 Effect of temperature on MTP degradation. Conditions: [MTP]0 = 0.05 mM, [PS]0 = 2 mM, [nZVI]0 = 0.33 g L−1, T = 293–328 K, no pH adjustment. | |
3.6. Effect of common anions
The effect of common anions on MTP degradation is shown in Fig. 6. As observed, all the tested anions showed an inhibitory effect towards MTP degradation except for Cl−. Specifically, the removal efficiency of MTP decreased from 91.1% (without anions) to 79.5%, 72.3%, and 14.7% with the addition of SO42−, NO3−, and HCO3−, respectively, indicating that the inhibitory extent of the tested anions followed the order of HCO3− > NO3− > SO42−.
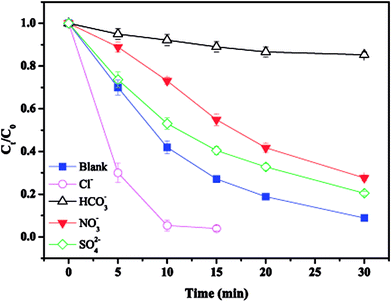 |
| | Fig. 6 Effect of anions on MTP degradation. Experimental conditions: [MTP]0 = 0.05 mM, [PS]0 = 2 mM, [nZVI]0 = 0.33 g L−1, [anions]0 = 5 mM, no pH adjustment. | |
The observed slight inhibition exerted by NO3− on the removal efficiency can be explained by its ability to react with SO4˙− at a low rate of 2.1 × 10⁶ M−1 s−1 to produce NO3˙ (2.50 V), which is a comparatively less reactive radical (eqn (18)).25 The inhibitive effect of SO42− on MTP degradation resulted from the following reasons: first, the oxidation–reduction potential of SO4˙−/SO42− reduced with increasing SO42− concentration;26 second, SO42− could react with both Fe2+ and Fe3+ to produce a mixture of Fe(SO4)2− and FeSO4+ complexes, resulting in lower concentration of Fe2+ by coordination;27 furthermore, SO42− could reduce the oxygenation of Fe2+ in neutral and slightly acidic solutions due to the generation of ion pairs (FeSO4) that are more difficult to oxidize.28 Compared to NO3− and SO42−, the stronger inhibitory effect exerted by HCO3− on MTP degradation was attributed to HCO3− being a great scavenger for both SO4˙− and ˙OH and CO3˙− with a lower oxidation potential would be generated through the reactions described in eqn (19)–(21).29 Moreover, the addition of HCO3− would increase the pH of the reaction solution, and the basic conditions decreased the degradation of MTP as discussed earlier. Finally, the dissociation equilibrium of HCO3− in aqueous solution resulted in the coexistence of HCO3− and CO3−, and it has been reported that CO32− can combine with Fe2+ to precipitate FeCO3, resulting in less Fe2+ available for PS activation.27
| |
 | (18) |
| |
 | (19) |
| | |
˙OH + HCO3− → CO3˙− + H2O
| (20) |
| |
 | (21) |
It is of interest to observe that the addition of Cl− accelerated the degradation of MTP, although it is commonly assumed that Cl− has an adverse impact on SO4˙−-based oxidation performance.30 Our observation is in accordance with the results of Wei et al., who reported that Cl− could accelerate bentazon degradation.18 The positive effects can be explained by the generation of reactive chlorine radicals including Cl˙ (2.4 V) and Cl2˙− (1.36 V) according to eqn (22) and (23), which can also be involved in the degradation of MTP.31 According to Fang et al., the addition of Cl− could influence the distribution of radical species and the sum of radical species during a SO4˙−-based oxidation process.32 Despite the reported rate constant between Cl2˙− and MTP ((5.07 ± 0.38) × 108 M−1 s−1) being lower than that of SO4˙− and MTP ((5.11 ± 0.12) × 109 M−1 s−1), the total amount of radical species would increase with the presence of Cl−, thus enhancing MTP degradation.33,34 Another explanation for our observation in MTP degradation might be that the presence of Cl− increases the ion strength, enhancing the adsorption of MTP on the surface of iron and/or iron oxide, and finally accelerating the surface reaction because the radicals were produced at the surface of iron.35
| | |
SO4˙− + Cl− ↔ Cl˙ + SO42−
| (22) |
In order to evaluate the feasibility of nZVI/PS process on the removal of MTP in the aquatic environment, MTP degradation in WWTP effluent was also conducted. Fig. S2† presents the degradation kinetics of MTP in the WWTP effluent. Obviously, MTP degradation was significantly reduced in WWTP effluent than that in pure water. The removal rate of MTP at 30 min was 47.8% by the nZVI/PS in the WWTP effluent, while that was 91.1% in pure water. As listed in Table S1,† inorganic anions and NOM are presented in wastewater (WW) sample. Fig. 6 showed that the co-existing inorganic anions, such as NO3−, SO42−, inhibited the degradation of MTP and the presence of NOM would also compete with MTP for SO4˙− and/or ˙OH, which were likely to affect the MTP degradation in WW. Thus, higher temperature as well as longer reaction time may be needed for more efficiently removal of MTP in real water matrix.
3.7. Transformation of nZVI
The pristine nZVI exhibited itself as aggregates of spherical particles with a diameter of approximately 50 nm (Fig. S3†). After exposure to the reaction process for 30 min, the surface of nZVI particles became coarse and their diameters notably increased, possibly because of the formation of iron oxidation products, such as goethite (α-FeOOH), haematite (α-Fe2O3) and magnetite (Fe3O4), that covered the nZVI surface as previously reported.36
Fig. 7(a) shows that the diffraction peaks at 2θ values of 44.7° (h k l = 1 1 0), 65.2° (h k l = 2 0 0) and 82.5° (h k l = 2 1 1) were sharp and intense, confirming the presence of Fe0 according to the basic reflection.37 XRD patterns exhibited some new diffraction peaks after nZVI exposure to the reaction, and the weak characteristic peaks at 2θ values of 35.4° and 62.7° indicated the formation of Fe3O4 and Fe2O3, respectively.17
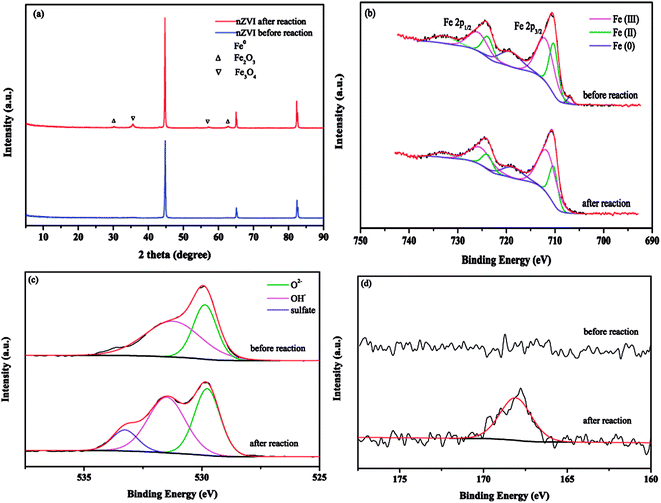 |
| | Fig. 7 (a) XRD patterns; (b) Fe 2p spectra; (c) O 1s spectra and (d) S 2p spectra of nZVI before and after nZVI/PS treatment. | |
XPS analysis was also employed to further inspect the surface composition of nZVI after being subjected to the oxidation process. Fig. 7(b) presents the spectra of the Fe 2p region. The peaks at binding energy (BE) values of 711.9, 710.2 and 706.9 eV were related to Fe(III), Fe(II) and Fe(0) of Fe 2p3/2 in pristine nZVI, respectively. For Fe 2p1/2, peaks appeared at 725.7, 723.8 and 719.1 eV.38 After the reaction, it can be clearly observed that the peak of Fe(0) cannot be found in the spectra of Fe 2p3/2, and the proportion of Fe(III) species improved from 47.75% to 60.12%; these results were related to the exhaustion of Fe(0) to transform into more Fe(III) during the process. The changes in the distribution of Fe(III) and Fe(II) suggested that electron transfer occurred on the nZVI surface. Fig. 7(c) exhibits the O 1s spectra of nZVI before and after the reaction, the two main peaks at 529.8 and 531.2 eV observed from the fresh nZVI were assigned to lattice oxygen (O2−) and OH−, respectively.38 After the reaction, an additional peak located at 533.2 eV can be seen in the O 1s spectra, which was assigned to the oxygen in sulfate (SO42−). Moreover, the results of the S 2p spectra further confirmed the generation of sulfate. As presented in Fig. 7(d), compared to no detectable sulfur on the surface of fresh nZVI, a significant sulfur peak at 168.0 eV assigned to sulfate was found after reaction, and these observations implied that ferrous sulfate (FeSO4) probably formed on the nZVI surface after utilization.39 These results confirmed the formation of oxidation layer after nZVI was subjected to the oxidation process.
3.8. Degradation pathways of MTP
The intermediate products of MTP via nZVI/PS were explored by LC/MS/MS. Fig. S4† depicts the total ion current (TIC) chromatograms of the samples obtained under different reaction times. As exhibited in Fig. S4,† the chromatograms show clearly the appearance of new peaks corresponding to the products from the degradation of MTP. In addition, these products have more hydrophilic structure than MTP since it was eluted out from the column prior to MTP. The identified products and their MS/MS patterns are displayed in Fig. S5 and Table S2.† In brief, four major pathways for MTP degradation can be suggested based on the identified products (Fig. 8). Pathway I was initiated by the attack of SO4˙− and/or ˙OH at the ether bond of MTP, resulting in the cleavage of an ether linkage to form P133.40 Pathway II was initiated by SO4˙− through electron transfer or ˙OH through hydroxyl addition mechanisms, leading to the formation of the hydroxylated product P283-I, which was further hydroxylated to form P299. The hydroxylation of an aromatic ring has always been considered a major oxidation pathway induced by SO4˙−-based oxidation systems.41 The product P281 with m/z of 282 was recognized as 1-(4-(2-hydroxy-3-(isopropylamino)propoxy)phenyl)-2-methoxyethanone, deriving from the oxidation of –OH to the –C![[double bond, length as m-dash]](https://www.rsc.org/images/entities/char_e001.gif) O on the branch chain of P283-II.42 Unlike P283-I, P283-II was derived from the hydroxylation that occurred at the methoxyethyl side chain rather than the aromatic ring of MTP.43 However, P283-II was not detected in the present study most likely owing to its fast transformation rate in the nZVI/PS system. Pathway III occurred via ˙OH attack on the ether side chain followed by elimination to yield a transformation product P239, followed by the oxidation of alcohol to aldehyde, which produces P237. Then, hydroxylated P237 and P253-I formed under the attack of SO4˙− and/or ˙OH. Pathway IV includes the cleavage of the terminal methyl group to yield P253-II, which was also identified as the ozonation product of MTP.44 The proposed reaction mechanism involved in MTP degradation includes hydroxylation, cleavage of an ether bond, demethoxylation and demethylation.
O on the branch chain of P283-II.42 Unlike P283-I, P283-II was derived from the hydroxylation that occurred at the methoxyethyl side chain rather than the aromatic ring of MTP.43 However, P283-II was not detected in the present study most likely owing to its fast transformation rate in the nZVI/PS system. Pathway III occurred via ˙OH attack on the ether side chain followed by elimination to yield a transformation product P239, followed by the oxidation of alcohol to aldehyde, which produces P237. Then, hydroxylated P237 and P253-I formed under the attack of SO4˙− and/or ˙OH. Pathway IV includes the cleavage of the terminal methyl group to yield P253-II, which was also identified as the ozonation product of MTP.44 The proposed reaction mechanism involved in MTP degradation includes hydroxylation, cleavage of an ether bond, demethoxylation and demethylation.
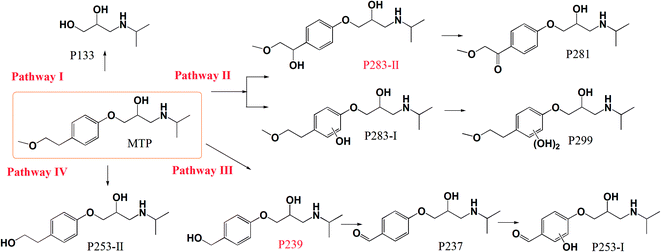 |
| | Fig. 8 Degradation pathways for MTP during nZVI/PS treatment. Conditions: [MTP]0 = 0.05 mM, [PS]0 = 2 mM, [nZVI]0 = 0.33 g L−1, no pH adjustment. | |
Fig. S6† shows the evolution of the products' peak areas along with the reaction time. As seen, the peak areas of the majority of products show an up–down trend, indicating the capability of oxidizing these products by the nZVI/PS system. For example, the maximum formation of P283-I, P299, P281, and P237 appeared during the first 10–20 min, and then slowly declined with increasing the reaction time. Of note, the major product (P133) increased continuously until the end of the reaction.
3.9. Toxicity analysis
The toxicity of the intermediate byproducts of target pollutant is important in assessing whether a technique is effective and environmentally friendly or not. Fig. 9 exhibits the evolution of acute toxicity along with the reaction time evaluated by bioluminescence experiments. As seen, although complete MTP removal could be achieved within 45 min, the specific value of TOCt/TOC0 decreased gradually from 100% to 75.9% in 60 min, indicating that most of the degraded MTP remained in the solution, as discussed earlier, and was not completely mineralized. The toxicity change showed an increasing and then decreasing trend, with a maximum value of 71.2% occurred at 30 min, revealing the intermediate products with more toxic than MTP were formed during the initial stage of the reaction. The presence of some identified or unidentified products including aliphatic intermediates, have also been reported to exert more toxicity than its parent compound.42 Further, some carcinogenic products, such as P237, should also be deserved of great concern.45 On the other hand, it has been demonstrated that there has a positive correlation between a compound and its octanol–water partition coefficient.46 Thus, the toxicity of the formed hydroxylated products, such as P283-I, which derived from the oxidation of SO4˙−/˙OH, might be reduced. Most of the products were expected to decompose or even mineralize with prolonging the reaction time. Therefore, the nZVI/PS process possesses promising potential for treating MTP-polluted water as well as controlling its toxicity.
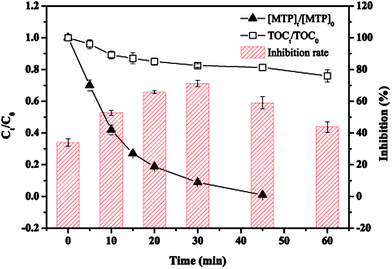 |
| | Fig. 9 Evolution of toxicity, [MTP]t/[MTP]0 and TOCt/TOC0 during the reaction. Conditions: [MTP]0 = 0.05 mM, [PS]0 = 2 mM, [nZVI]0 = 0.33 g L−1, no pH adjustment. | |
4. Conclusions
This study investigated the applicability of the nZVI/PS process for MTP degradation in water. Nearly 91.1% removal of 0.05 mM MTP was achieved within 30 min at a PS concentration of 2 mM and a nZVI dosage of 0.33 g L−1. SO4˙− was identified as the predominant radical responsible for MTP degradation. Higher PS concentrations and temperatures, lower initial MTP concentrations and acidic conditions could enhance the removal of MTP. Moreover, inorganic anions such as NO3−, SO42−, HCO3− and Cl− greatly affect MTP degradation in the nZVI/PS system. On the basis of XRD and XPS analysis, it can be concluded that Fe3O4, Fe2O3 and FeSO4 formed on the nZVI surface after reaction. Several intermediate products were recognized, of which reveals the four initial degradation pathways, such as hydroxylation, cleavage of an ether bond, demethoxylation and demethylation. Toxicity test indicated that the toxicity of MTP could be controlled by the nZVI/PS treatment. This study can help us to understand the reaction mechanisms, as well as the transformation pathways of MTP by the nZVI/PS treatment.
Conflicts of interest
There are no conflicts to declare.
Acknowledgements
This research was financially supported by the National Natural Science Foundation of China (51708348; 51778565), and State Key Laboratory of Pollution Control and Resource Reuse Foundation (PCRRF18005).
References
- D. B. Huggett, I. A. Khan, C. M. Foran and D. Schlenk, Environ. Pollut., 2003, 121, 199–205 CrossRef CAS PubMed.
- R. Varga, Z. Eke and K. Torkos, Talanta, 2011, 85, 1920–1926 CrossRef CAS PubMed.
- I. Oller, S. Malato and J. A. Sánchez-Pérez, Sci. Total Environ., 2011, 409, 4141–4166 CrossRef CAS PubMed.
- Q. T. Liu and H. E. Williams, Environ. Sci. Technol., 2007, 41, 803–810 CrossRef CAS PubMed.
- D. D. Ćetojević, S. J. Armaković, D. V. Šojić and B. F. Abramović, Sci. Total Environ., 2013, 463–464, 968–974 CrossRef PubMed.
- A. A. Godoy, F. Kummrow and P. A. Z. Pamplin, Chemosphere, 2015, 138, 281–291 CrossRef CAS PubMed.
- J. L. Wang and S. Z. Wang, Chem. Eng. J., 2018, 334, 1502–1517 CrossRef CAS.
- Y. Q. Gao, N. Y. Gao, D. Q. Yin, F. X. Tian and Q. F. Zheng, Chemosphere, 2018, 201, 50–58 CrossRef CAS PubMed.
- F. Ghanbari and M. Moradi, Chem. Eng. J., 2017, 310, 41–62 CrossRef CAS.
- I. Epold, M. Trapido and N. Dulova, Chem. Eng. J., 2015, 279, 452–462 CrossRef CAS.
- H. X. Li, J. Q. Wan, Y. W. Ma, Y. Wang and M. Z. Huang, Chem. Eng. J., 2014, 237, 487–496 CrossRef CAS.
- C. Kim, J. Y. Ahn, T. Y. Kim, W. S. Shin and I. Hwang, Environ. Sci. Technol., 2018, 52, 3625–3633 CrossRef CAS PubMed.
- D. H. Bremner, A. E. Burgess, D. Houllemare and K. C. Namkung, Appl. Catal., B, 2006, 63, 15–19 CrossRef CAS.
- I. Hussain, Y. Q. Zhang, S. B. Huang and X. Z. Du, Chem. Eng. J., 2012, 203, 269–276 CrossRef CAS.
- Y. F. Ji, Y. Fan, K. Liu, D. Y. Kong and J. H. Lu, Water Res., 2015, 87, 1–9 CrossRef CAS PubMed.
- Y. Q. Gao, N. Y. Gao, Y. Deng, Y. Q. Yang and Y. Ma, Chem. Eng. J., 2012, 195–196, 248–253 CrossRef CAS.
- R. C. Li, X. Y. Jin, M. Megharaj, R. Naidu and Z. L. Chen, Chem. Eng. J., 2015, 264, 587–594 CrossRef CAS.
- X. Y. Wei, N. Y. Gao, C. J. Li, Y. Deng, S. Q. Zhou and L. Li, Chem. Eng. J., 2016, 285, 660–670 CrossRef CAS.
- C. J. Liang, Z. S. Wang and C. J. Bruell, Chemosphere, 2007, 66, 106–113 CrossRef CAS PubMed.
- G. V. Buxton, C. L. Greenstock, W. P. Helman and A. B. Ross, J. Phys. Chem. Ref. Data, 1988, 17, 513–886 CrossRef CAS.
- J. L. Chen, S. R. Al-Abed, J. A. Ryan and Z. Li, J. Hazard. Mater., 2001, 83, 243–254 CrossRef CAS PubMed.
- M. H. Nie, Y. Yang, Z. J. Zhang, C. X. Yan, X. N. Wang, H. J. Li and W. B. Dong, Chem. Eng. J., 2014, 246, 373–382 CrossRef CAS.
- Y. J. Sun, J. J. Zhao, B. T. Zhang, J. Li, Y. B. Shi and Y. Zhang, Chem. Eng. J., 2019, 368, 553–563 CrossRef CAS.
- G. R. Peyton, Mar. Chem., 1993, 41, 91–103 CrossRef CAS.
- A. Ghauch and A. M. Tuqan, Chem. Eng. J., 2012, 183, 162–171 CrossRef CAS.
- C. C. Lin and Y. H. Chen, Sep. Purif. Technol., 2018, 194, 388–395 CrossRef CAS.
- H. X. Li, J. Q. Wan, Y. W. Ma, Y. Wang and Z. Y. Guan, RSC Adv., 2015, 5, 99935–99943 RSC.
- E. Lipczynska-Kochany, G. Sprah and S. Harms, Chemosphere, 1995, 30, 9–20 CrossRef CAS PubMed.
- H. P. Gao, J. B. Chen, Y. L. Zhang and X. F. Zhou, Chem. Eng. J., 2016, 306, 522–530 CrossRef CAS.
- L. R. Bennedsen, J. Muff and E. G. Søgaard, Chemosphere, 2012, 86, 1092–1097 CrossRef CAS PubMed.
- X. Y. Yu, Z. C. Bao and J. R. Barker, J. Phys. Chem. A, 2004, 108, 295–308 CrossRef CAS.
- G. D. Fang, D. D. Dionysiou, Y. Wang, S. R. Al-Abed and D. M. Zhou, J. Hazard. Mater., 2012, 227–228, 394–401 CrossRef CAS PubMed.
- L. S. Lian, B. Yao, S. D. Hou, J. Y. Fang, S. W. Yan and W. H. Song, Environ. Sci. Technol., 2017, 51, 2954–2962 CrossRef CAS PubMed.
- Y. Lei, S. S. Cheng, N. Luo, X. Yang and T. C. An, Environ. Sci. Technol., 2019, 53, 11170–11182 CrossRef CAS PubMed.
- C. Jeyaprabha, S. Sathiyanarayanan and G. Venkatachari, J. Electroanal. Chem., 2005, 583, 232–240 CrossRef CAS.
- H. X. Li, J. Q. Wan, Y. W. Ma, M. Z. Huang, Y. Wang and Y. M. Chen, Chem. Eng. J., 2014, 250, 137–147 CrossRef CAS.
- X. Li, M. H. Zhou, Y. W. Pan and L. T. Xu, Chem. Eng. J., 2017, 307, 1092–1104 CrossRef CAS.
- X. F. Xia, L. Ling and W. X. Zhang, Chemosphere, 2017, 168, 1597–1603 CrossRef CAS PubMed.
- H. Fu, X. Wang, H. Wu, Y. Yin and J. Chen, J. Phys. Chem. C, 2007, 111, 6077–6085 CrossRef CAS.
- E. Leyva, E. Moctezuma, M. López, K. M. Baines and B. Zermeño, Catal. Today, 2019, 323, 14–25 CrossRef CAS.
- Y. Yang, X. L. Lu, J. Jiang, J. Ma, G. Q. Liu, Y. Cao, W. L. Liu, J. Li, S. Y. Pang, X. J. Kong and C. W. Luo, Water Res., 2017, 118, 196–207 CrossRef CAS PubMed.
- D. Šojić, V. Despotović, D. Orčić, E. Szabó, E. Arany, S. Armaković, E. Illés, K. Schrantz, A. Dombi, T. Alapi, E. Sajben-Nagy, A. Palágyi, C. Vágvölgyi, L. Manczinger, L. Bjelica and B. Abramović, J. Hydrol., 2012, 472–473, 314–327 CrossRef.
- O. M. S. Filipe, N. Mota, S. A. O. Santos, M. R. M. Domingues, A. J. D. Silvestre, M. G. P. M. S. Neves, M. M. Q. Simões and E. B. H. Santos, J. Hazard. Mater., 2017, 323, 250–263 CrossRef CAS PubMed.
- J. Benner and T. A. Ternes, Environ. Sci. Technol., 2009, 43, 5472–5480 CrossRef CAS PubMed.
- A. Jaén-Gil, G. Buttiglieri, A. Benito, R. Gonzalez-Olmos and S. Rodríguez-Mozaz, J. Hazard. Mater., 2019, 319, 121523 Search PubMed.
- J. Lienert, K. Güdel and B. I. Escher, Environ. Sci. Technol., 2007, 41, 4471–4478 CrossRef CAS PubMed.
Footnote |
| † Electronic supplementary information (ESI) available. See DOI: 10.1039/d0ra01273d |
|
| This journal is © The Royal Society of Chemistry 2020 |
Click here to see how this site uses Cookies. View our privacy policy here.  Open Access Article
 *a,
Jia Zhanga,
Jin-qiang Zhoua,
Cong Lia,
Nai-yun Gaob and
Da-qiang Yinb

![[thin space (1/6-em)]](https://www.rsc.org/images/entities/char_2009.gif) :
:![[thin space (1/6-em)]](https://www.rsc.org/images/entities/char_2009.gif) 1). Moreover, when the concentration of TBA or EtOH reached to 200 mM ([scavenger]0/[PS]0 = 100
1). Moreover, when the concentration of TBA or EtOH reached to 200 mM ([scavenger]0/[PS]0 = 100![[thin space (1/6-em)]](https://www.rsc.org/images/entities/char_2009.gif) :
:![[thin space (1/6-em)]](https://www.rsc.org/images/entities/char_2009.gif) 1), the degradation of MTP further decreased to 72.5% and 25.3%, respectively. The inhibition of the degradation of MTP in the presence of TBA was much less than that in the presence of EtOH, indicating that despite both SO4˙− and ˙OH contributed to the degradation of MTP, SO4˙− had a more predominant role.
1), the degradation of MTP further decreased to 72.5% and 25.3%, respectively. The inhibition of the degradation of MTP in the presence of TBA was much less than that in the presence of EtOH, indicating that despite both SO4˙− and ˙OH contributed to the degradation of MTP, SO4˙− had a more predominant role.


![[thin space (1/6-em)]](https://www.rsc.org/images/entities/char_2009.gif) k and 1/T as exhibited in the inset of Fig. 4, and the data are well fit by the Arrhenius equation described in eqn (17).
k and 1/T as exhibited in the inset of Fig. 4, and the data are well fit by the Arrhenius equation described in eqn (17).


![[double bond, length as m-dash]](https://www.rsc.org/images/entities/char_e001.gif) O on the branch chain of P283-II.42 Unlike P283-I, P283-II was derived from the hydroxylation that occurred at the methoxyethyl side chain rather than the aromatic ring of MTP.43 However, P283-II was not detected in the present study most likely owing to its fast transformation rate in the nZVI/PS system. Pathway III occurred via ˙OH attack on the ether side chain followed by elimination to yield a transformation product P239, followed by the oxidation of alcohol to aldehyde, which produces P237. Then, hydroxylated P237 and P253-I formed under the attack of SO4˙− and/or ˙OH. Pathway IV includes the cleavage of the terminal methyl group to yield P253-II, which was also identified as the ozonation product of MTP.44 The proposed reaction mechanism involved in MTP degradation includes hydroxylation, cleavage of an ether bond, demethoxylation and demethylation.
O on the branch chain of P283-II.42 Unlike P283-I, P283-II was derived from the hydroxylation that occurred at the methoxyethyl side chain rather than the aromatic ring of MTP.43 However, P283-II was not detected in the present study most likely owing to its fast transformation rate in the nZVI/PS system. Pathway III occurred via ˙OH attack on the ether side chain followed by elimination to yield a transformation product P239, followed by the oxidation of alcohol to aldehyde, which produces P237. Then, hydroxylated P237 and P253-I formed under the attack of SO4˙− and/or ˙OH. Pathway IV includes the cleavage of the terminal methyl group to yield P253-II, which was also identified as the ozonation product of MTP.44 The proposed reaction mechanism involved in MTP degradation includes hydroxylation, cleavage of an ether bond, demethoxylation and demethylation.


