 Open Access Article
Excitation dependent visible and NIR photoluminescence properties of Er3+, Yb3+ co-doped NaBi(MoO4)2 nanomaterials†
Pushpendra,
Ravi K. Kunchala,
Rimple Kalia and
Boddu S. Naidu *
*
Institute of Nano Science and Technology (INST), Phase 10, Sector 64, Mohali, Punjab, India-160062. E-mail: naidu245@gmail.com; sanyasinaidu@inst.ac.in
First published on 9th April 2020
Abstract
Due to the exceptional luminescence properties of lanthanide doped nanomaterials, they have applications in various field such as sensing, photocatalysis, solar cells, bio-imaging, therapy, diagnostics, anti-counterfeiting, latent fingerprint development, optical amplifiers, solid state lighting, etc. Here, we report the excitation dependent photoluminescence properties of Yb3+, Er3+ co-doped NaBi(MoO4)2 nanomaterials in both the visible and NIR regions upon UV, visible and NIR excitation. These photoluminescence properties show that strong energy transfer occurs from the host to the Yb3+, Er3+ ions. These materials show major emission bands at 530, 552 (green) and 656 nm (red) in the visible region and 1000 and 1534 nm in the NIR region. The intensity ratio between green and red bands is dependent on the excitation wavelength, whereas the intensity ratio of the 1000 and 1534 nm bands relies on the excitation wavelength and Er3+ doping concentration. These materials also exhibit host emission and upconversion luminescence properties in the visible region.
1. Introduction
Lanthanide ions are known to have excellent luminescence properties in the UV, visible and NIR regions due to their rich energy levels. These ions also show both down-shifting and upconversion photoluminescence properties with long excited state lifetime values and high quantum yields.1,2 Due to these exceptional luminescence properties, lanthanide doped nanomaterials have applications in various fields such as sensing, photocatalysis, solar cells, bio-imaging, therapy, diagnostics, anti-counterfeiting, latent fingerprint development, optical amplifiers, solid state lighting, etc.1–8 Among lanthanide ions, the trivalent erbium ion shows emission in the visible and NIR regions and also exhibits upconversion luminescence properties. However, its upconversion luminescence properties are very poor if it is doped alone due to low absorption cross section. To improve the upconversion luminescence properties, Yb3+ is used as a sensitizer, where it absorbs the NIR radiation and transfer the energy to the Er3+ ion. Energy transfer from Yb3+ to Er3+ and Er3+ to Er3+ are also investigated in detail.9,10 Among the lanthanide ions, Yb3+, Er3+ doped upconversion materials are well known for their unique optical features, such as excellent upconversion luminescence, long excited state lifetime, and high quenching concentration compared to other rare earth ions.11,12 Recently, Yb3+, Er3+ co-doped dual mode emitting materials become key players in anti-counterfeiting technology due to their unique luminescence properties under both UV and NIR illuminations.13–16However, most of these host materials are rare earth based fluorides. These materials are toxic, very expensive and getting large quantity of high purity rare earth materials is very difficult. Recently, reports on lanthanide doped bismuth based nanomaterials are increasing gradually due to its advantages over rare earths such as nontoxic nature, more abundant, less expensive and an environment ecofriendly, which could be termed as ‘Green Bismuth’.17–27 Also, ionic size, charge, co-ordination number of bismuth is similar to rare earth ions. Bismuth activated materials are known to have their characteristic emission properties which makes them more important class of luminescent materials.28–30 NaBi(MoO4)2 is an excellent host material for lanthanide ions with excellent luminescence properties. For example, Gan, et al. reported the luminescence properties of Eu3+, Gd3+ co-doped NaBi(MoO4)2 materials.22 Rico, et al. studied upconversion luminescence properties of Er3+ doped single crystals.26 Li, et al. reported white light emission from Eu3+, Dy3+ co-doped NaBi(MoO4)2 materials and their use in light emitting diode.23 Li and Deun investigated upconversion properties of Er3+/Yb3+ co-doped bulk materials.27 Very recently, our group has been reported the room temperature synthesis of Eu3+ doped NaBi(MoO4)2 nanomaterials and their luminescence properties.24 In the present manuscript, we are reporting visible and NIR photoluminescence of NaBi0.9−xErxYb0.1(MoO4)2 nanomaterials upon UV, visible and NIR excitations. To the best of authors knowledge, so far there is no report on visible, NIR and upconversion luminescence properties of NaBi0.9−xErxYb0.1(MoO4)2 nanomaterials.
2. Results and discussion
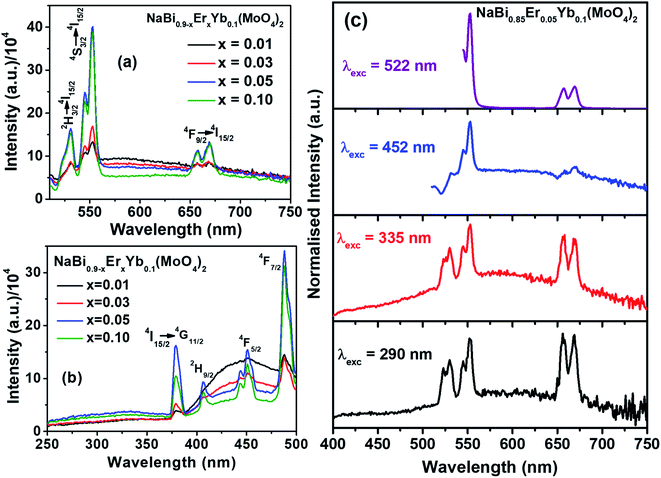
Nanomaterials of NaBi0.9−xErxYb0.1(MoO4)2, (0.01 ≤ x ≤ 0.1) are prepared by co-precipitation method at room temperature. The detailed synthesis procedure and characterization techniques details are given in ESI.† X-ray diffraction patterns of NaBi0.9−xErxYb0.1(MoO4)2, (0.01 ≤ x ≤ 0.1) nanomaterials (Fig. S1, ESI†) shows that all doped materials crystallized in scheelite structure. They match completely with the standard JCPDS file # 01-074-8694 of NaBi(MoO4)2. Crystallite size of all these nanomaterials is calculated using Debye–Scherrer formula and is found to be 13 nm for all samples. Raman and FTIR spectra of all doped samples (Fig. S2 and S3, ESI†) are similar to that of undoped sample as well as reported data.31,32 Absence of extra peak confirm that there is no amorphous impurity phase present in these materials. DR UV-vis spectra shows that Er3+ absorption increases with its concentration (Fig. S4, ESI†). TEM image of these nanomaterials shows that they consist of nearly spherical particles with size in the range of 5–18 nm (Fig. S5, ESI†). EDS analysis of these materials shows that the actual composition of metal ions is similar to the added composition (Fig. S6, ESI†).Luminescence properties of NaBi0.9−xErxYb0.1(MoO4)2, (0.01 ≤ x ≤ 0.1) nanomaterials in visible region are recorded at 488 nm excitation and shown in Fig. 1(a). Three major transitions corresponding to 2H11/2 → 4I15/2 (530 nm, green), 4S3/2 → 4I15/2 (552 nm, green) and 4F9/2 → 4I15/2 (656 nm, red) of Er3+ are observed. Intensity of these transitions increases with the concentration of Er3+ till x = 0.05 and thereafter it started decreasing. The initial increase in the intensity with Er3+ concentration is due to increase in the number of Er3+ ions getting excited. However, with further increase in Er3+ concentration, Er–Er cross-relaxation and multi phonon relaxation leads to non-radiative decay. Hence, x = 0.05 of Er3+ is an optimum concentration for obtaining maximum photoluminescence in this host material. Excitation spectra corresponding to Er3+ emission (552 nm) of these nanomaterials are shown in Fig. 1(b). It consists of very broad band between 250–370 nm corresponding to host material (combination of molybdate charge transfer and s–p transition of Bi3+) and few sharp peaks corresponding to f–f transition of Er3+ ions. Intensity of all these transitions increases with the concentration of Er3+ till 0.05 and thereafter it decreases. The observation of host absorption while monitoring Er3+ emission confirm the transfer of energy from host to Er3+. There is another broad band between 400–500 nm corresponding to some trap states present in the host materials and its intensity continuously decrease with increase in the Er3+ concentration.
Emission spectra of these materials are recorded by exciting host material (290, 335 nm) as well as direct Er3+ ions (452, 488, 522 nm) for better understanding of the interaction between host material and dopant ions. Emission spectra of NaBi0.85Er0.05Yb0.1(MoO4)2 nanomaterials excited at different wavelength are shown in Fig. 1(c). Emission spectra obtained by exciting host material (290, 335 nm) exhibit nearly equal intensities of green and red emission peaks with broad background emission centered around 570 nm. This broad emission is due to the trap states present in the host material. In case of direct excitation of Er3+, the material emit strong green and week red light. These results demonstrate that equal energy transfer from host material to 2H11/2, 4S3/2, and 4F9/2 levels of Er3+ occurs. Whereas 2H11/2, 4S3/2 levels are more populated than 4F9/2 level after direct excitation of Er3+ ions. Similar kind of results are observed in all Er3+ and Yb3+ co-doped samples (Fig. S7–S9,† ESI).
Emission spectra in near infrared (NIR) region of NaBi0.9−xErxYb0.1(MoO4)2, (0.01 ≤ x ≤ 0.1) nanomaterials are recorded at 522 nm excitation and presented in Fig. 2(a). It consists of two emission bands, i.e., one weak band corresponding to 4I11/2 → 4I15/2 (1000 nm) and a strong band with fine splitting due to 4I13/2 → 4I15/2 (1534 nm) transitions of Er3+. Their intensity increases with the concentration of Er3+ till 0.05, thereafter decreases. The reduction in the intensity of emission above x = 0.05 is assigned to the concentration quenching. Similar kind of trend is also observed for Er3+ emission in the literature.33,34 Excitation spectra of NaBi0.9−xErxYb0.1(MoO4)2, (0.01 ≤ x ≤ 0.1) nanomaterials are monitored at 1534 nm emission and shown in Fig. 2(b). A broad band centered at 290 nm along with several sharp peaks are observed. The former is assigned to host materials absorption and later ones are corresponding to f–f transitions of Er3+ in the host matrix. The observation of host absorption while monitoring 1534 nm emission reveals the energy transfer from host to Er3+ ion. However, the lower intensity of host absorption suggest that the energy transferred to the Er3+ leads to several f–f transitions in visible and NIR regions.
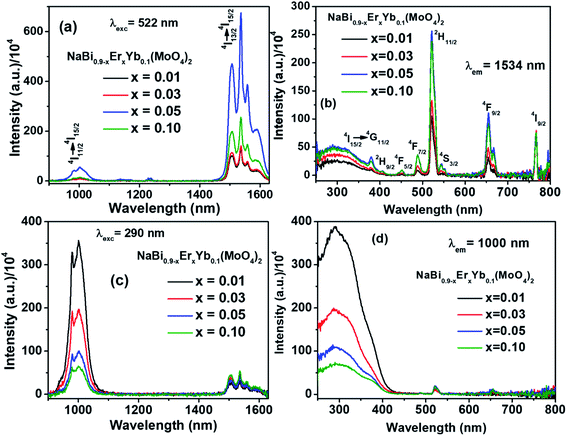 | ||
| Fig. 2 Emission spectra excited at (a) 522 nm, (c) 290 nm and excitation spectra monitored at (b) 1534 nm, (d) 1000 nm emission of NaBi0.9−xErxYb0.1(MoO4)2, (0.01 ≤ x ≤ 0.1) nanomaterials. | ||
To understand the energy transfer from NaBi(MoO4)2 to Er3+, Yb3+ ions, emission spectra of these nanomaterials in NIR region are recorded at 290 nm and shown in Fig. 2(c). All these spectra have bands at 1000, 1534 nm. The 1000 nm band corresponding to the combination of 4I11/2 → 4I15/2, 2F5/2 → 2F7/2 transitions of Er3+, Yb3+ ions, respectively and the 1534 nm band is due to 4I13/2 → 4I15/2 transition of Er3+. Surprisingly, the emission intensity of 1000 nm band is much higher when compared to the 1534 nm band and the intensity of former band decreases with increasing the Er3+ concentration whereas the intensity of later increases. However, the rate at which former decrease is very high while the increment in later is marginal. It can be explained based on two things. First one is the competitive energy transfer from host to Yb3+ and Er3+ simultaneously. Second, the energy transferred from host to the Yb3+ leads to emission at 1000 nm only whereas it is distributed in different ‘f’ energy levels of Er3+ and gives several emission bands at 530, 552, 656, 890, 1000 and 1534 nm. Excitation spectra are monitored at 1000 nm emission for these nanomaterials and shown in Fig. 2(d). These spectra consists of strong excitation band at 290 nm with shoulder at 380 nm and very week peaks at 522, 656 nm. The broad band is ascribed to host absorption and its intensity decreases with increase in the Er3+ concentration. This might be because of the competitive energy transfer from host to the Yb3+ and Er3+ ions. Contour plots of emission and excitation for NaBi0.85Er0.05Yb0.1(MoO4)2 nanomaterials are shown in the Fig. 3. It gives possible excitation wavelengths and corresponding emission intensities in a qualitative way. It shows that the relative emission intensities in the NIR region are highly dependent on the excitation wavelength.
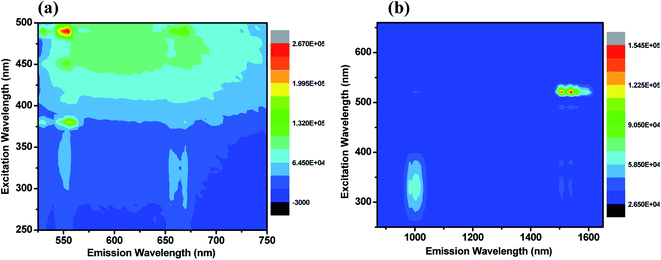 | ||
| Fig. 3 Contour plot of emission–excitation of NaBi0.85Er0.05Yb0.1(MoO4)2 nanomaterials for corresponding emission in the (a) visible, (b) NIR regions. | ||
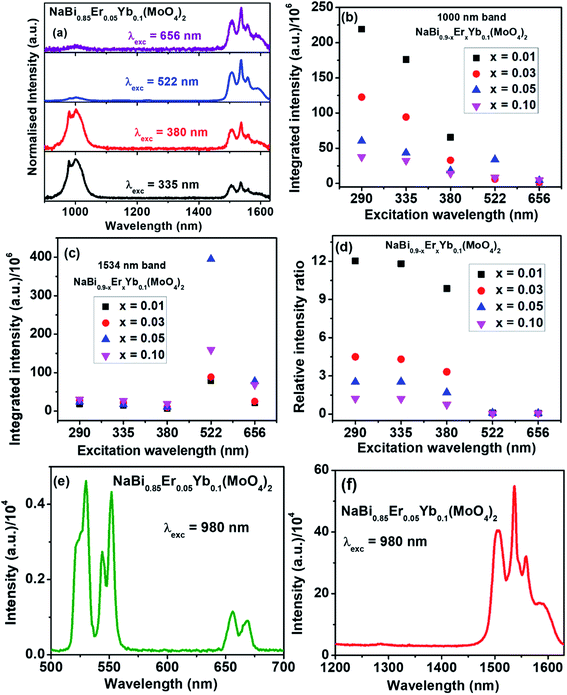
For better quantitative understanding of NIR emission properties, NaBi0.85Er0.05Yb0.1(MoO4)2 nanomaterials are excited through host (335, 380 nm) as well as Er3+ ions (522, 656 nm) directly and results are shown in Fig. 4(a). When the sample excited directly to Er3+ ion (522, 656 nm), very strong emission at 1534 nm and weak band at 1000 nm are observed. However, the trend is just reversed when excited to host material. It reveals that the Er3+ ion has very low contribution to the 1000 nm emission and the emission is majorly resulted from 2F5/2 → 2F7/2 transition of Yb3+ ions. Similar results are also observed from all NaBi0.9−xErxYb0.1(MoO4)2, (0.01 ≤ x ≤ 0.1) nanomaterials (Fig. S10–S12, ESI†). Integrated area of 1000, 1534 nm bands and their relative intensity ratios are measured for all these samples at different excitation wavelengths (Table TS2, ESI†) and corresponding plots are shown in Fig. 4(b–d). The ratio of 1000 nm band to 1534 nm band is maximum for samples excited at 290 nm followed by 335, 380 nm and is least for 522 nm excitation. The ratio decreases with increasing the Er3+ concentration in the host matrix. As Yb3+ is a good sensitizer for upconversion luminescence properties, to know the possibility of the upconversion emission from these samples, NaBi0.85Yb0.1Er0.05(MoO4)2 nanomaterials are excited with 980 nm laser light having 2.75 W cm−2 power density at room temperature and emission is recorded in the range of 500–750 nm. The emission spectrum is shown in Fig. 4(e). This material shows excellent upconversion properties with emission peaks at 530, 552, 656 nm. These bands are corresponding to 2H11/2 → 4I15/2 (530 nm), 4S3/2 → 4I15/2 (552 nm) and 4F9/2 → 4I15/2 (656 nm) transition of Er3+ ion. Emission properties are also measured in the NIR region at 980 nm laser excitation and is shown in Fig. 4(f). The sample gives very strong emission at 1534 nm. It reveals that only part of the 980 nm laser light is converted into upconversion emission and remaining energy converted into NIR emission while decay to ground state.
Based on the photoluminescence properties observed in visible, NIR regions, a possible energy level diagram for NaBi0.9−xErxYb0.1(MoO4)2 nanomaterials is proposed as illustrated in the Fig. 5. When the host material is excited, it decays non-radiatively to the trap states present in it. From there it may decay radiatively to the valence band by emitting very broad emission centered at 570 nm or it may transfer its energy to Yb3+ and Er3+ ions. In case of energy transfer from host to the Yb3+ ions, they decay to ground state by emitting 1000 nm emission. In the event of the energy transfer to Er3+ ions, part of these ions decay to ground state by giving visible emission and part of the ions decay non-radiatively to lower energy levels and subsequently they decay to the ground state by emitting NIR light. If these nanomaterials are excited directly to Er3+, they give only Er3+ emission.
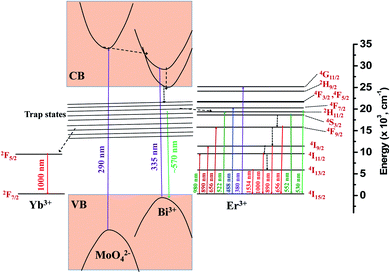 | ||
| Fig. 5 Energy level diagram of NaBi0.9−xErxYb0.1(MoO4)2 nanomaterials and possible energy transitions. | ||
3. Conclusions
Nanomaterials of NaBi0.9−xErxYb0.1(MoO4)2 exhibit excellent photoluminescence properties in both visible and NIR regions by exciting with UV, visible and NIR light. These nanomaterials show broad emission in visible region by exciting host material along with Er3+ emission. Strong energy transfer from host to Er3+, Yb3+ and Yb3+ to Er3+ has been observed. The luminescence properties of these nanomaterials depends on the excitation wavelength. The relative intensity ratio between green to red emission and 1000 nm to 1534 nm emission peaks are highly depend on the direct or indirect excitation of Er3+ ions. The broad host emission in visible region and excitation dependent difference in relative intensities of emission peaks shows that these nanomaterials may have potential applications in anti-counterfeiting ink as security labels.Conflicts of interest
There are no conflicts to declare.Acknowledgements
P, RKK and RK are grateful to INST, Mohali for the fellowship. BSN acknowledges the DST-SERB, India (File number: ECR/2015/000333) for financial assistance.References
- G. Blasse and B. C. Grabmaier, Luminescent Materials, Springer-Verlag Berlin Heidelberg, 1994 Search PubMed.
- S. Wen, J. Zhou, K. Zheng, A. Bednarkiewicz, X. Liu and D. Jin, Nat. Commun., 2018, 9, 2415 CrossRef PubMed.
- Y. Hu, Q. Shao, X. Deng, D. Song, S. Han, Y. Dong and J. Jiang, J. Mater. Chem. C, 2019, 7, 11770–11775 RSC.
- J. Zhou, Q. Liu, W. Feng, Y. Sun and F. Li, Chem. Rev., 2015, 115, 395–465 CrossRef CAS PubMed.
- J. Zhao, J. Gao, W. Xue, Z. Di, H. Xing, Y. Lu and L. Li, J. Am. Chem. Soc., 2018, 140, 578–581 CrossRef CAS PubMed.
- E. Downing, L. Hesselink, J. Ralston and R. Macfarlane, Science, 1996, 273, 1185–1189 CrossRef CAS.
- F. Vetrone, R. Naccache, A. Zamarrón, A. J. De La Fuente, F. Sanz-Rodríguez, L. M. Maestro, E. M. Rodriguez, D. Jaque, J. G. Sole and J. A. Capobianco, ACS Nano, 2010, 4, 3254–3258 CrossRef CAS PubMed.
- Z. Gu, L. Yan, G. Tian, S. Li, Z. Chai and Y. Zhao, Adv. Mater., 2013, 25, 3758–3779 CrossRef CAS PubMed.
- M. T. Berry and P. S. May, J. Phys. Chem. A, 2015, 119, 9805–9811 CrossRef CAS PubMed.
- A. Baride, P. S. May Jr and M. T. Berry, J. Phys. Chem. C, 2020, 124, 2193–2201 CrossRef CAS.
- F. Auzel, Chem. Rev., 2004, 104, 139–173 CrossRef CAS PubMed.
- M. Haase and H. Schäfer, Angew. Chem., Int. Ed., 2011, 50, 5808–5829 CrossRef CAS PubMed.
- J. Andres, R. D. Hersch, J.-E. Moser and A.-S. Chauvin, Adv. Funct. Mater., 2014, 24, 5029–5036 CrossRef CAS.
- W. Yao, Q. Tian, J. Liu, Z. Wu, S. Cui, J. Ding, Z. Daia and W. Wu, J. Mater. Chem. C, 2016, 4, 6327–6335 RSC.
- Y. Zhang, L. Zhang, R. Deng, J. Tian, Y. Zong, D. Jin and X. Liu, J. Am. Chem. Soc., 2014, 136, 4893–4896 CrossRef CAS PubMed.
- J. Liu, H. Rijckaert, M. Zeng, K. Haustraete, B. Laforce, L. Vincze, I. V. Driessche, A. M. Kaczmarek and R. V. Deun, Adv. Funct. Mater., 2018, 28, 1707365 CrossRef.
- R. Mohan, Nat. Chem., 2010, 2, 336 CrossRef CAS PubMed.
- M. Back, E. Trave, N. Mazzucco, P. Riello and A. Benedetti, Nanoscale, 2017, 9, 6353–6361 RSC.
- P. Lei, R. An, S. Yao, Q. Wang, L. Dong, X. Xu, K. Du, J. Feng and H. Zhang, Adv. Mater., 2017, 29, 1700505 CrossRef PubMed.
- B. S. Naidu, B. Vishwanadh, V. Sudarsan and R. K. Vatsa, Dalton Trans., 2012, 41, 3194–3203 RSC.
- S. Sarkar, A. Dash and V. Mahalingam, Chem.–Asian J., 2013, 9, 447–451 CrossRef PubMed.
- Y. Gan, W. Liu, W. Zhang, W. Li, Y. Huang and K. Qiu, J. Alloys Compd., 2019, 784, 1003–1010 CrossRef CAS.
- W. Li, W. Zhang, W. Li, Y. Gan and P. Zhang, J. Mater. Sci.: Mater. Electron., 2019, 30, 658–666 CrossRef CAS.
- Pushpendra, R. K. Kunchala, S. N. Achary, A. K. Tyagi and B. S. Naidu, Cryst. Growth Des., 2019, 19, 3379–3388 CrossRef CAS.
- Pushpendra, R. K. Kunchala, S. N. Achary and B. S. Naidu, ACS Appl. Nano Mater., 2019, 2, 5527–5537 CrossRef CAS.
- M. Rico, V. Volkov and C. Zaldo, J. Alloys Compd., 2001, 323–324, 806–810 CrossRef CAS.
- K. Li and R. V. Deun, Inorg. Chem., 2019, 58, 6821–6831 CrossRef CAS PubMed.
- J. Cao, L. Li, L. Wang, X. Li, Z. Zhang, S. Xu and M. Peng, J. Mater. Chem. C, 2018, 6, 5384–5390 RSC.
- J. Cao, L. Wondraczek, Y. Wang, L. Wang, J. Li, S. Xu and M. Peng, ACS Photonics, 2018, 5, 4393–4401 CrossRef CAS.
- J. Cao, S. Xu, Q. Zhang, Z. Yang and M. Peng, Adv. Opt. Mater., 2018, 6, 1801059 CrossRef.
- J. Hanuza and M. Maczka, Vib. Spectrosc., 1994, 7, 85–96 CrossRef CAS.
- J. Hanuza, A. Haznar, M. Maczka, A. Pietraszko, A. Lemiec, J. H. van der Maas and E. T. G. Lutz, J. Raman Spectrosc., 1997, 28, 953–963 CrossRef CAS.
- L. Li, X. Zhang, Z. Bai, W. Dong, H. Shi and Q. Xue, Infrared Phys. Technol., 2015, 73, 49–53 CrossRef CAS.
- V. R. Prasad, B. Haritha, S. Damodaraiah and Y. C. Ratnakaram, Infrared Phys. Technol., 2018, 94, 184–190 CrossRef.
Footnote |
| † Electronic supplementary information (ESI) available: Details of synthesis and characterization techniques, FTIR and Raman Spectra, XRD patterns, PL spectra of as synthesized nanomaterials. See DOI: 10.1039/d0ra01272f |
| This journal is © The Royal Society of Chemistry 2020 |

