
 Open Access Article
 This Open Access Article is licensed under a Creative Commons Attribution-Non Commercial 3.0 Unported Licence
Adaptation mechanism of mango fruit (Mangifera indica L. cv. Chaunsa White) to heat suggest modulation in several metabolic pathways†
Zainab Khanumac,
Martín E. Tiznado-Hernández b,
Arslan Alia,
Syed Ghulam Musharrafac,
Muhammad Shakeela and
Ishtiaq Ahmad Khan*a
b,
Arslan Alia,
Syed Ghulam Musharrafac,
Muhammad Shakeela and
Ishtiaq Ahmad Khan*a
aJamil-ur-Rahman Center for Genome Research, Dr Panjwani Center for Molecular Medicine and Drug Research, International Center for Chemical and Biological Sciences, University of Karachi, Karachi-75270, Pakistan. E-mail: ishtiaqchemist@gmail.com
bCoordinación de Tecnología de Alimentos de Origen Vegetal, Centro de Investigación en Alimentación y Desarrollo, A. C. Hermosillo, Sonora, Mexico
cH.E.J. Research Institute of Chemistry, International Center for Chemical and Biological Sciences, University of Karachi, Karachi-75270, Pakistan
First published on 25th September 2020
Abstract
Climate change is becoming a global problem because of its harmful effects on crop productivity. In this regard, it is crucial to carry out studies to determine crops' response to heatwave stress. Response molecular mechanisms during the development and ripening of mango fruit (Mangifera indica L. cv. Chaunsa White) under extreme heatwaves were studied. Mango flowers were tagged and fruits 18, 34, 62, 79, 92 days after flowering (DAF) as well as fruits on 10 and 15 days of postharvest shelf life were studied through RNA-Seq and metabolome of the fruit mesocarp. The environmental temperature was recorded during the experiment. Roughly, 2![[thin space (1/6-em)]](https://www.rsc.org/images/entities/char_2009.gif) 000000 clean reads were generated and assembled into 12876 redundant transcripts and 2674 non-redundant transcripts. The expression of genes playing a role in oxidative stress, circadian rhythm, senescence, glycolysis, secondary metabolite biosynthesis, flavonoid biosynthesis and monoterpenoid biosynthesis was quantified as well as reactive oxygen species. Higher expressions of six abiotic stress genes and a senescent associated gene was found at 79 DAF (recorded temperature 44 °C). Higher expressions of nucleoredoxin and glutathione S-transferase 1 family protein were also recorded. Activation of the GABA-shunt pathway was detected by the glutamate decarboxylase transcript expression at 79 DAF. Larger energy demands at the beginning of fruit ripening were indicated by an increase in fructose-bisphosphate aldolase gene expression. Finally, the radical-scavenging effect of mango fruit inflorescence and fruit pulp extracts showed decline upon heatwave exposure. We recorded a broad genetic response of mango fruit suggesting the activation of several metabolic pathways which indicated the occurrence of genetic and metabolic crosstalks in response to intense heatwaves. Collectively, this study presents experimental evidence to help in the elucidation of the molecular mechanism of crops response to heat stress which in turn will help in the designing of protocols to increase crop productivity in the face of climate change.
000000 clean reads were generated and assembled into 12876 redundant transcripts and 2674 non-redundant transcripts. The expression of genes playing a role in oxidative stress, circadian rhythm, senescence, glycolysis, secondary metabolite biosynthesis, flavonoid biosynthesis and monoterpenoid biosynthesis was quantified as well as reactive oxygen species. Higher expressions of six abiotic stress genes and a senescent associated gene was found at 79 DAF (recorded temperature 44 °C). Higher expressions of nucleoredoxin and glutathione S-transferase 1 family protein were also recorded. Activation of the GABA-shunt pathway was detected by the glutamate decarboxylase transcript expression at 79 DAF. Larger energy demands at the beginning of fruit ripening were indicated by an increase in fructose-bisphosphate aldolase gene expression. Finally, the radical-scavenging effect of mango fruit inflorescence and fruit pulp extracts showed decline upon heatwave exposure. We recorded a broad genetic response of mango fruit suggesting the activation of several metabolic pathways which indicated the occurrence of genetic and metabolic crosstalks in response to intense heatwaves. Collectively, this study presents experimental evidence to help in the elucidation of the molecular mechanism of crops response to heat stress which in turn will help in the designing of protocols to increase crop productivity in the face of climate change.
1. Introduction
Abiotic stresses, such as heatwaves, directly reduce crop productivity by affecting plant growth and development. Climate change, water shortage and food security are the main concerns around the world.1 Plants and fruits usually respond to heat stress by modulating their antioxidant mechanisms at the genomic, transcriptomic, metabolomic and proteomic levels.2 Heat stress tolerance is acquired in plants by the synthesis or increase of antioxidant compounds and through crosstalks at genomic and metabolomic levels.3Mango (Mangifera indica L.) is a tropical fruit known as the “King of fruits”, for its delicious taste, and belongs to the order Sapindales of the Anacardiaceae family.4 Several studies have been carried out in mango to understand the composition and metabolism of mango leaf,5 mango metabolic pathways,6,7 epidermal peel transcriptome8 and mango fruit development from inflorescence up to the ripe stage.9 In Pakistan, Sindh province is characterized by the hot semi-arid environment and moderate drought conditions.10 During the last 5 years, South Asia has been experiencing high summer temperatures (http://www.pmd.gov.pk and http://accuweather.com) during the mango fruit growing and harvesting months, with recurrent intense heatwaves ranging from 41 to 49 °C ± 2 °C from April till June. Recent studies show that in mango (Mangifera indica L.), eukaryotic initiation factors (eIFs) confer abiotic stress tolerance.11
The objective of this study was to understand the role of enzymatic and non-enzymatic antioxidant defense response mechanisms in mango fruit concerning climate change and fruit quality. Identification of genes and metabolic pathways playing a role in the molecular mechanism to heat was carried out by next-generation RNA sequencing (RNA-Seq) and transcriptome profiling of ripe mango mesocarp. Differential gene expression analysis of orthologous abiotic stress genes for Arabidopsis thaliana during the development of mango fruit was evaluated. The role of the genes studied in the present work during the development of mango fruit is largely unknown. The genes studied in this work are known to regulate oxidative stress, circadian rhythm control, senescence, glycolysis, secondary metabolite biosynthesis, flavonoid biosynthesis and monoterpenoids biosynthesis in model plant Arabidopsis thaliana12 as well as in fleshy fruits such as Solanum lycopersicum13 and Citrus sinensis.14 The working hypothesis of this work sustain that mango fruit shows unique molecular and metabolic adaptations in response to high-temperature stress. Furthermore, throughout fruit development and ripening beginning from the inflorescence, gene expression patterns of putative abiotic stress genes were also correlated with metabolome and radical scavenging activity for validation of the stress response mechanism. Here we discuss the putative roles of these genes in the reactive oxygen species homeostasis during fruit development.
2. Results and discussion
2.1. SOLiD sequencing, de novo assembly, transcript annotation and SSR mining
RNA-Seq was performed for cDNA libraries from the mRNA of mango fruit cultivar Chaunsa White. Raw reads were filtered and assembled into transcripts for annotation. After filtering raw reads, a total of 2000000 clean reads were generated. These reads were assembled into 12876 redundant transcripts and 2674 non-redundant transcripts. The non-redundant transcripts showed a GC content of 50%. BLASTx database annotation of the non-redundant transcripts characterized 4169 predicted, 3807 characterized, 3217 hypothetical proteins and uncharacterized proteins (Fig. 1a). BLASTx database annotation also revealed a maximum number of hits was from Citrus sinensis and Citrus clementine followed by Glycine max, Vitis vinifera and Jatropha curcas with more than 85% sequence similarity (Fig. 1b). The transcripts were assigned with Enzyme Commission numbers to characterize their role in biological processes. Pathway analysis using the KEGG database (https://www.genome.jp/kegg/pathway.html) represented a total of 80 metabolic pathways in Chaunsa White mango fruit. Several transcripts were annotated into pathways including glycolysis, Krebs cycle, pentose phosphate pathway, fructose, and mannose metabolism and oxidative phosphorylation.
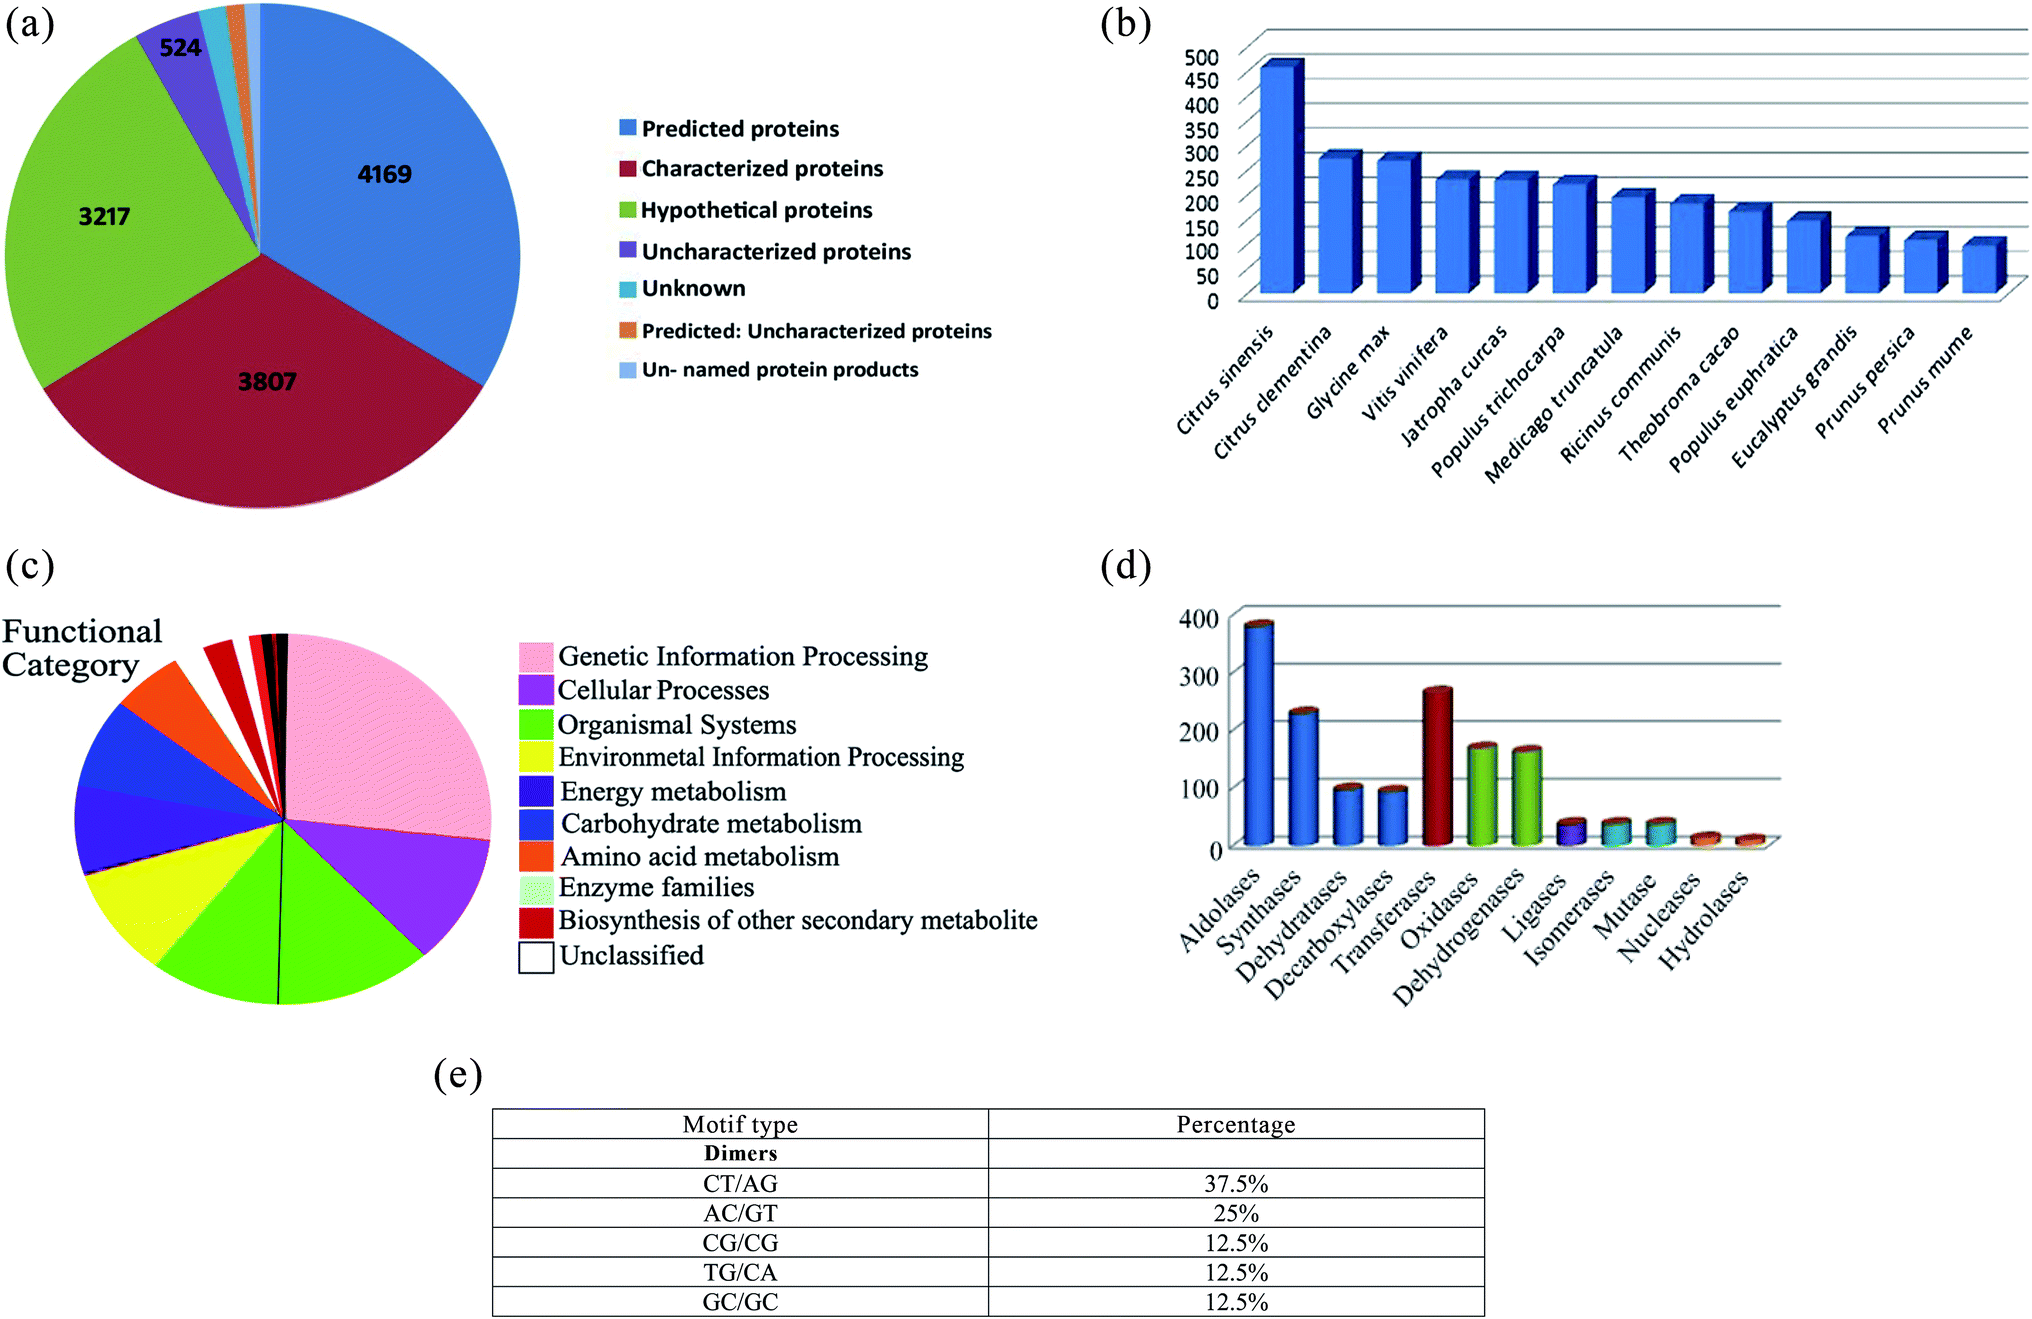 | ||
| Fig. 1 (a) Pie chart representing BLASTx probability of the annotated non-redundant Chaunsa mango fruit transcripts. The numbers indicate the number of annotated transcripts. Highest number of transcripts was annotated as predicted proteins followed by characterized proteins and hypothetical proteins. (b) BLASTx statistics of Chaunsa mango fruit transcriptome including the species showing 85% sequence similarity or more. Number of mapped transcripts is represented on Y-axis while X-axis represents the most similar plant species to Chaunsa mango fruit. In this way, Y-axis indicates that Chaunsa mango fruit transcripts were most similar to Citrus sinensis followed by Citrus clementine. (c) Top gene ontology distribution of Chaunsa mango fruit transcripts as annotated by BlastKOALA. Pie chart represents the annotated biological processes and functions of the Chaunsa mango fruit transcripts. Highest number of transcripts code for genetic information processes followed by cellular processes, organismal systems and environmental information processing. (d) Enzyme classes distribution in the annotated Chaunsa mango fruit transcripts. X-Axis represents the different enzyme classes while the Y-axis represents the number of transcripts encoding the different classes of enzymes found in Chaunsa mango fruit. (e) Presence of simple sequence repeats in Chaunsa mango fruit transcripts. | ||
A total of 71% of non-redundant transcripts were annotated by BlastKOALA to various biological processes such as genetic information, cellular processes, environmental information processing, energy metabolism, carbohydrate metabolism, amino acid metabolism and enzyme families (Fig. 1c). Enzyme class distribution indicated that the highest number of transcripts in Chaunsa mango fruit encodes for aldolases followed by transferases, synthases, oxidases and dehydrogenases (Fig. 1d). GMATA tool identified monomeric and dimeric simple sequence repeats (SSR) in the non-redundant transcripts of Chaunsa mango fruit. The abundant dimeric simple sequence repeats were found to be (CT/AG) with 37.5% (Fig. 1e).
These SSR represent markers that can be utilized to calculate the genetic diversity in the different mango cultivars available and also to assist in the development of new mango cultivars using a marker-assisted selection Mendelian program. To the best of our knowledge, this study is the first comprehensive gene characterization of mango fruit cultivar Chaunsa White that will provide genetic based evidence of Chaunsa White mango longer shelf life and the reason of the health benefits upon consumption of this fruit.
2.2. Characterization of antioxidant and metabolic pathways in Chaunsa White mango
Transcriptome studies on different mango cultivars have shown differential expression of pathways regulating the primary and secondary metabolism, such as carbohydrate metabolism, fatty acid metabolism, terpenoid backbone biosynthesis and ethylene biosynthesis.5,9In Arabidopsis thaliana plant, Solanum lycopersicum L., Citrus, Carrizo citrange and Cleopatra mandarin fruits, heat stress tolerance is acquired through antioxidant metabolites biosynthesized during heat stress response.3 These antioxidant metabolites include: carbohydrates, branched-chain amino acids, fatty acids and secondary metabolites such as polyphenols, terpenoids, triterpenoids and sesquiterpenoids.15,16
In the present study, gene transcripts playing a role in secondary metabolism biosynthesis pathways were characterized, such as chalcone synthase (2.3.1.74) which plays a role in polyphenols (flavonoid, anthocyanins, flavonols) biosynthesis, caffeoyl-CoA O-methyltransferase (2.1.1.104) which plays a role in furanone biosynthesis and flavonol synthase (1.14.20.6) which catalyses the synthesis of galangin (3,5,7-trihydroxyflavone), a distinct flavonol known to have antioxidative, antibacterial, antitumor and other properties.17 Transcripts related to lipid biosynthesis pathways were also identified in Chaunsa mango fruit transcriptome, including: linoleate 13S-lipoxygenase (1.13.11.12) and 6-phosphogluconolactonase (3.1.1.31). 6-Phosphogluconolactonase is known to catalyze the synthesis of the monosaccharide phosphate called 6-phosphogluconic acid or gluconic acid by hydrolysis of 6-phosphogluconolactone.18 Gluconic acid gives a refreshing sour taste to Chaunsa mango fruit.
2.3. Abiotic and biotic stress genes regulating detoxification in plants
High temperatures induce negative effects for plant growth and development.19 Also, high light stress had been shown to induce a dwarf phenotype in cucumber (Cucumis sativus) plants.20 When plants are exposed to intense heatwaves, they respond by increasing the reactive oxygen species (ROS) levels. The oxidative damage by high ROS levels is mitigated by enzymatic and non-enzymatic antioxidants in order to ensure ROS homeostasis, as the ROS levels are maintained within a defined range.21 Catalases, peroxidase and glutathione S-transferase are enzymes well known to play a role in reactive oxygen species scavenging.22 These enzymes degrade stress-induced hydrogen peroxide to water and oxygen. Likewise heat stress, the stress induced by high light also increases the ROS amount and induce the synthesis of the ROS scavenging enzymes.23 Little is known about the role of these genes regulating abiotic and biotic stress during the development of mango fruit. In this study, the differential expression of genes regulating abiotic stress was analyzed during the development of Chaunsa mango fruit. Several genes (MiGAD, MiNRX1, MiGI, MiGSTF6, MiWun1, MiCAT1 and MiPER42) regulating abiotic stress showed significant up-regulation at stage 5 which corresponds with 79 DAF, when the fruit still is at the immature green stage (Fig. 2b). We found very low antioxidant activity at 79 DAF suggesting an increase in the production of damaging reactive oxygen species such as superoxide anion and hydrogen peroxide which may have induced their increased expression and their expression level can also be correlated with the higher expression levels of flavor, pigment and aroma regulating genes such as MiFBA6, MiCHS1 and MiTPS14 and MiGSTF6 at stage 5 (79 DAF) in mango fruit. In the case of high light stress, it had been shown the induction of anthocyanins biosynthesis24,25 which confers resistance to the plant by stabilizing the ROS chemical species.26 Our results also demonstrated that MiFBA6 gene expression at stage 5 (79 DAF) was also correlated with the up-regulated pathways of galactose metabolism, malate-aspartate shuttle and fructose and mannose degradation (Fig. 2a).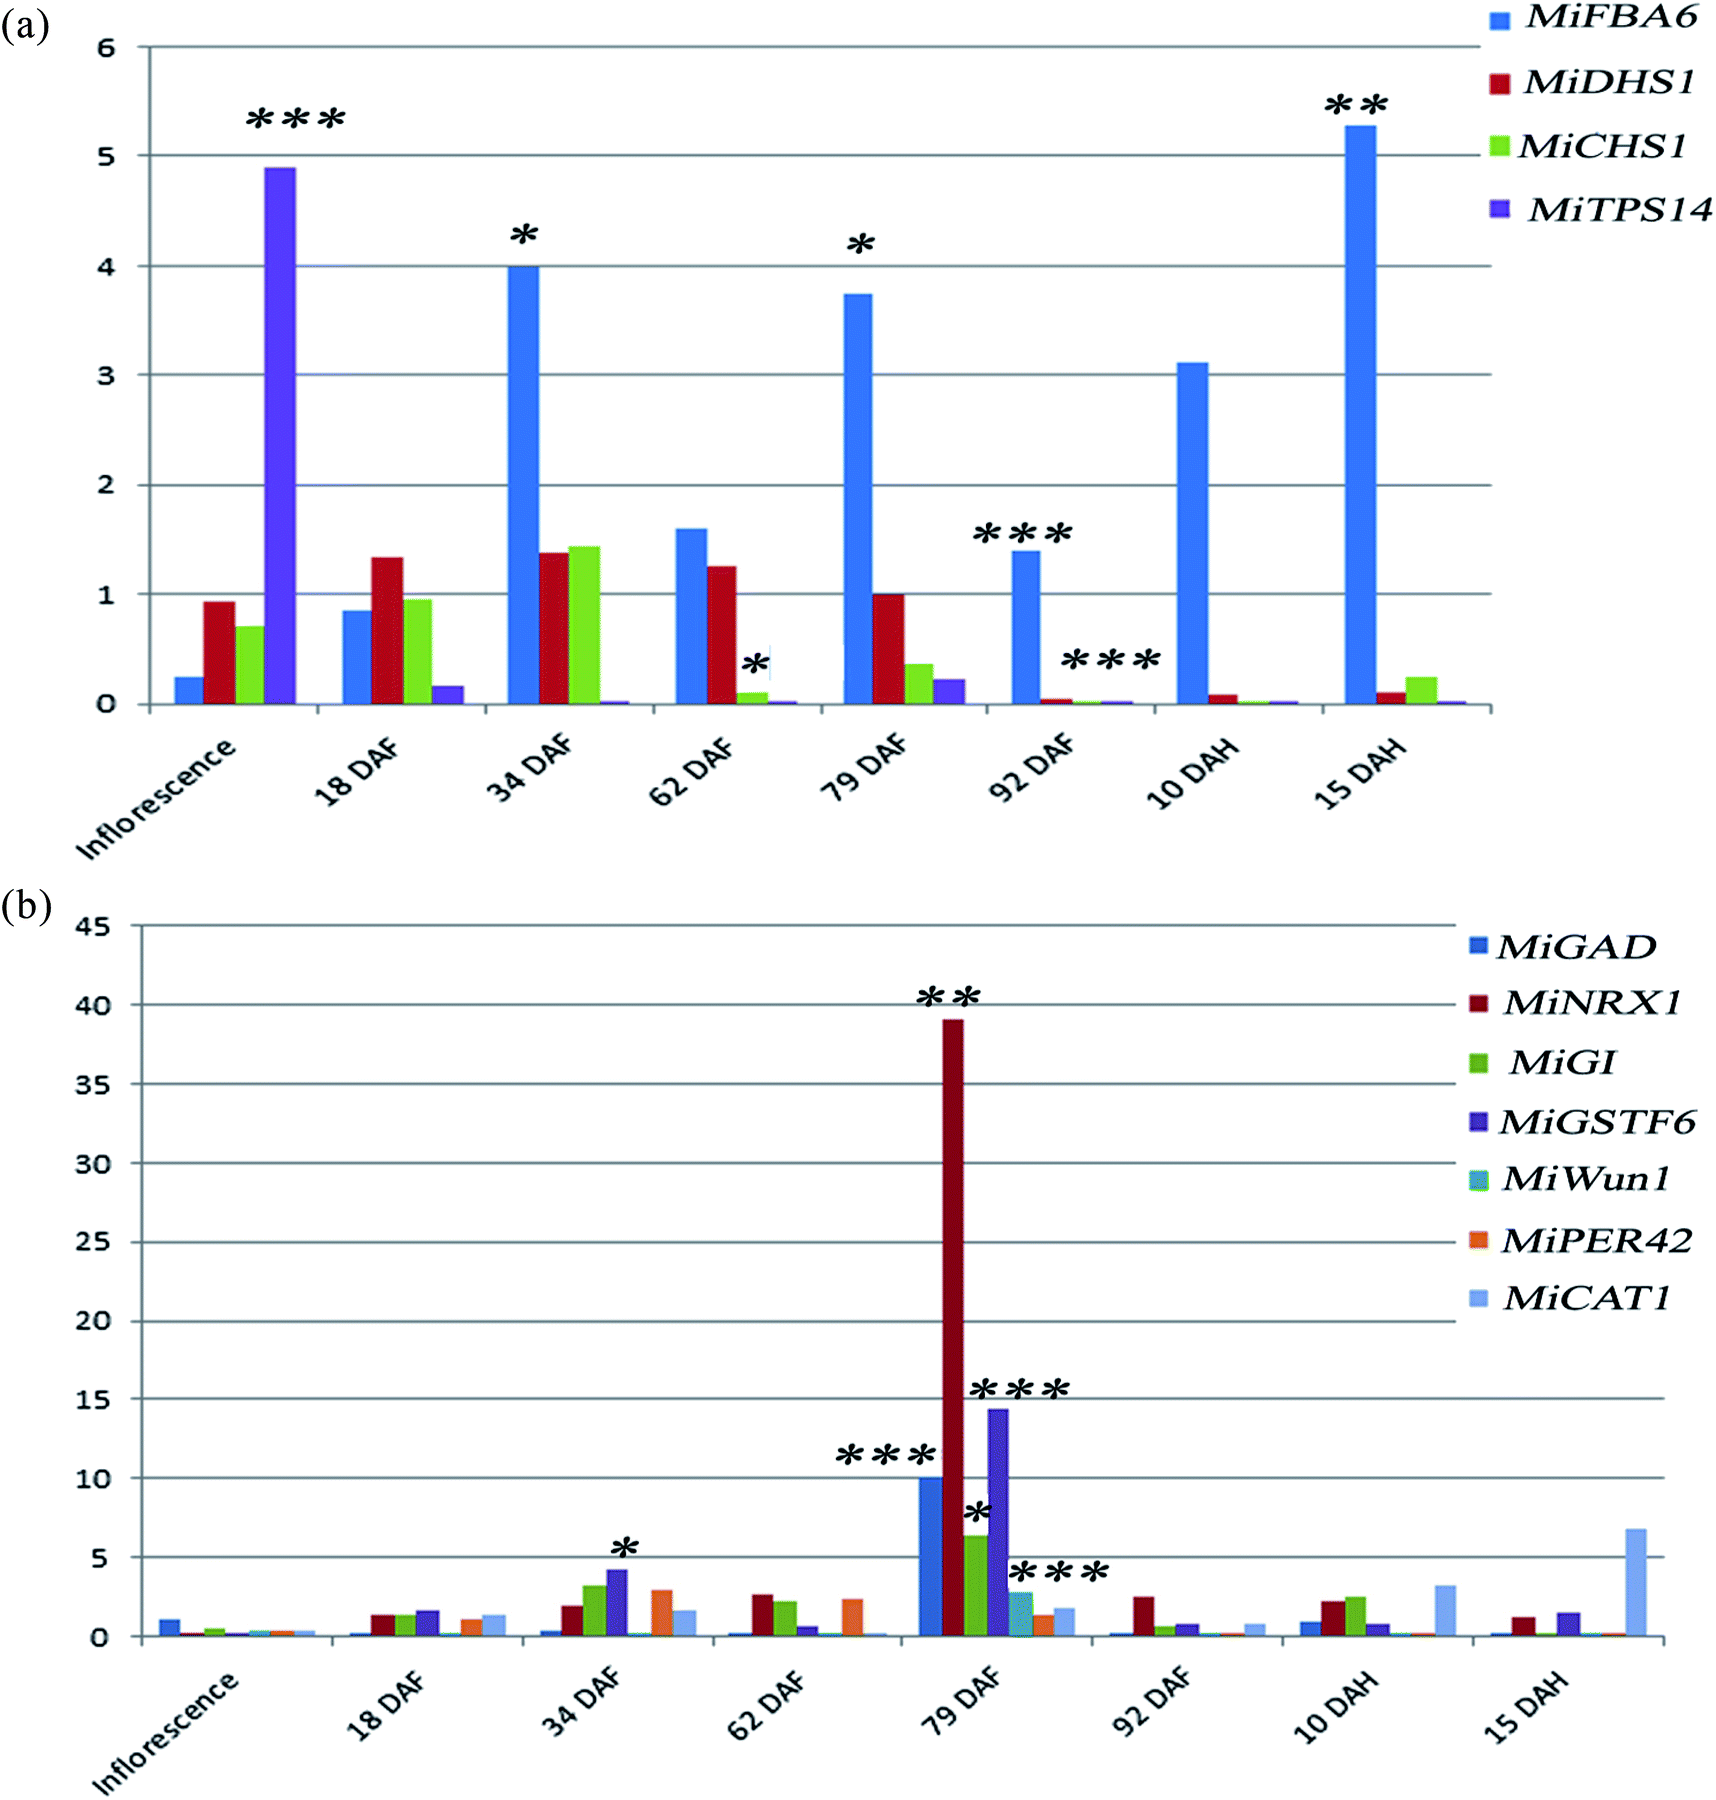 | ||
| Fig. 2 (a) Gene expression pattern of 4 genes playing a role in glycolysis and gluconeogenesis (MiFBA6, fructose-bisphosphate aldolase), shikimate pathway (MiDHS1, 3-deoxy-D-arabino heptulosonate 7-phosphate (DAHP) synthase), flavonoid biosynthesis pathway (MiCHS1, chalcone synthase) and terpenoid biosynthesis pathway (MiTPS14, linalool synthase) at inflorescence, seven stages of mango fruit development: 18 DAF, 34 DAF, 62 DAF, 79 DAF, 92 DAF and two stages of postharvest shelf life: 10 DAH and 15 DAH. The gene expression was calculated by quantitative real time PCR. DAF: days after flowering and DAH: days after harvest. Data represents the average standard deviation (as mean ± SE) of eight fruit for each developmental stage. Statistical significance in gene expression between the developmental stages is indicated by asterisks. *, **, *** significant at p < 0.1, p < 0.01 and p < 0.001, respectively. X-Axis represents fruit development stage with recorded temperature while Y-axis represents fold induction. (b) Gene expression pattern of seven genes regulating abiotic and biotic stresses. (MiGAD1, glutamate decarboxylase; MiNRX1, nucleoredoxin; MiGI, gigantea; MiGSTF6, glutathione S-transferase 1 family protein; MiWun1, wound-induced protein; MiPER42, peroxidase and MiCAT1, catalase) at inflorescence, seven stages of mango fruit development: 18 DAF, 34 DAF, 62 DAF, 79 DAF, 92 DAF and two stages of postharvest shelf life: 10 DAH and 15 DAH. The gene expression was calculated by quantitative real time PCR. DAF: days after flowering and DAH: days after harvest. Data represents the average of eight fruits. Statistical significance in gene expression between the developmental stages is indicated by asterisks. *, **, *** significant at p < 0.1, p < 0.01 and p < 0.001, respectively. X-Axis represents fruit development stage while Y-axis represents fold induction. | ||
Glutamate decarboxylase involved in GABA shunt in plants plays a vital role in the TCA cycle under both normal and stress conditions during plant growth. In tomato fruit, the expression of glutamate decarboxylase increases from the inflorescence stage until the mature green stage followed by a drastic decline during the ripening stages.27 Our data agree with the results reported in tomato and guava. At 79 DAF, the expression level of MiGAD, MiNRX1, MiGI were higher which may suggest a transition to fruit ripening and increased ROS production. In agreement with this statement, no antioxidant activity in mango fruit was recorded at this stage of development which suggests that the amount of ROS generated was too large and the antioxidant compounds were depleted.
In climacteric fruits like guava (Psidium guajava L.), it was observed that the peroxidase activity was highest at the turning stage followed by the gradual decline in activity at the ripe and over-ripe stages.28 Similar results were found in the present study, in which the MiPER42 gene was up-regulated at stage 3 (34 DAF), stage 4 (62 DAF) and stage 5 (79 DAF) followed by significant down-regulation at stage 6 (92 DAF), stage 7 (10 DAH) and stage 8 (15 DAH) in Chaunsa mango fruit (Fig. 2b). MiCAT1 gene expression was up-regulated at post-harvest stage 7 (10 DAH) and stage 8 (15 DAH). MiCAT1 expression pattern correlated with the catalase activity observed in apple (Malus pumila) fruit which shows an activity increase after harvest.29 It was also observed that MiCAT1 expression was also up-regulated at stage 5 (79 DAF) during the development of Chaunsa mango fruit which may indicate the need for a higher catalase enzyme in the presence of increased ROS concentrations. MiNRX1 gene was also observed to be significantly up-regulated at stage 5 (79 DAF) which may indicate that oxidoreductase nucleoredoxin 1 (NRX1) enzyme activity was maintained the catalase enzyme in a reduced state and promoted its H2O2 scavenging activity at the middle developmental stage of Chaunsa mango fruit ripening.30 MiWun1, a senescence-associated gene, was significantly up-regulated at stage 5 (79 DAF) during the development of Chaunsa mango fruit, perhaps as part of the mango fruit response to the abiotic stress. In agreement with this statement, it had been shown that senescence-associated genes are part of the response to drought stress in barley during crop development.31
Gamma-aminobutyric acid (GABA) is a non-proteinogenic amino acid. Further, GABA is known to enhance the catabolism of carbohydrates and increase several antioxidant enzyme activities thereby reducing the level of reactive oxygen species.32 In agreement with this statement, in Citrus seeds the exogenous application of GABA and BABA (beta-aminobutyric acid) on Citrus seeds also induced their germination under saline conditions by eliciting the expression of redox-regulated enzymes.33 Furthermore, the GABA priming of three maize cultivar seeds also promoted the efficient growth of the crop by inducing the biosynthesis of chlorophyll, increase the gas exchange rate and the overall rate of photosynthesis in all maize cultivar.34 In the present study, MiGAD was found to be significantly up-regulated at the middle stage during the development of mango fruit (79 DAF/immature fruit). This stage was characterized by a ROS rich environment, triggering the activity of other enzymatic antioxidant defense pathways in mango fruit.35 Moreover, during tomato fruit enlargement, SlGAD3, the orthologous of MiGAD was highly expressed in fruit's placenta tissue. Mango fruit expands from 65 to 95 days after flowering.27 Considering the SlGAD3 up-regulation during tomato fruit expansion, the significant increase in MiGAD at 79 DAF in our study may correspond to the initiation of the Chaunsa mango fruit expansion stage.
Cold storage is the best-known technique to extend the shelf life of post-harvest fleshy fruits and vegetables. But the application of cold storage during transportation of mango from orchard to the consumer countries is limited by the chilling injury physiological disorder.36 Low temperature, stress induced a cascade of molecules (ROS and Ca2+) which up-regulates the genes playing a role in the plant stress response, phenylalanine and phenylpropanoid biosynthesis, starch–sucrose–galactose metabolism and glycerophospholipid metabolism in mango resulting in accumulation of oxidized phenols, discoloration and unacceptable quality.18 Exogenous application of GABA on banana fruit resulted in the reduction of chilling injury disorder probably due to the increase in antioxidant defense mechanisms and proline accumulation, which ultimately extended its quality and shelf life.37 Similarly, in peach fruit, where GABA priming retarded chilling stress and amino acids, valine and/or isoleucine, were also characterized in the primed fruits.33 In mango fruit, our results showed that L-alanine was identified as an exclusive metabolite at stage 5 (75 DAF). Alanine is a sweet-tasting amino acid. In the GABA-shunt pathway, L-alanine is formed as an intermediate compound when γ-aminobutyric acid is converted to succinyl semialdehyde by GABA transaminase (GABA-TP). This may further suggest the transition to ripening and sweet flavor development in Chaunsa mango fruit. Considering the induction of tolerance to chilling stress by GABA in higher plants, it is plausible to suggest GABA priming of post-harvest mangoes will be a good approach to increase the chilling stress tolerance in export-quality mangoes and quality maintenance.
The IC50 values of the acidic methanol–acetone extracts for DPPH were 451.4 ± 1.9 μg mL−1 for inflorescence (0 day) and 345 ± 1.9 μg mL−1 for stage 2 (18 DAF). IC50 values of the standard gallic acid was 3.2 ± 0. 1 μg mL−1 and that of N-acetyl-L-cysteine was 14 ± 0.1 μg mL−1.
ROS rapidly increases when a plant is exposed to environmental stress such as exposure to intense UV light.41 This mechanism is known as reactive oxygen burst.42 Several antioxidant compounds absorb the UV radiation and protect the plant. Interestingly in our studies, the unique UV-absorbing pigments characterized at the Chaunsa mango inflorescence stage included: ascorbic acid (vitamin C)43 and tetracosan-1-ol, which is a lignoceryl alcohol.44 These compounds belong to ascorbate, aldarate and fatty acid metabolism pathways, respectively. While at stage 2 (18 DAF), the unique non-enzymatic antioxidants characterized were: 4-carene45 and trans-caryophyllene.46 These metabolites belong to terpenoids, sesquiterpenoid and triterpenoid biosynthesis pathways.
2.4. Metabolic profiles using GC-MS analysis
The changes in the metabolome of Chaunsa mango fruit tissues collected at eight stages of mango fruit development were studied with the GC-MS approach. A total of 284 metabolites were identified with NIST mass spectral library search (ESI Table S1 and Fig. S1†). Out of these, 13 metabolites were identified only at stage 1 (inflorescence), 131 metabolites were identified only at stage 2 (18 DAF), 87 metabolites were identified only at stage 3 (34 DAF) and one metabolite was identified at stage 5 (79 DAF). Furthermore, 129 metabolites were found to be present all the time during the development of mango fruit Chaunsa. The compounds that are found in at least in two stages are summarized in the form of a heat map (Fig. 5). These putative metabolites belonged to various classes of compound families, including monoterpene alcohols, aroma volatiles, glycoside, monosaccharides, disaccharides, trisaccharides, oligosaccharides, sugar alcohols, sugar acids, essential oils, amino acids, ketone bodies, phytohormones and fatty acids. Furthermore, they play a role in several metabolic pathways, such as galactose metabolism, malate-aspartate shuttle, fructose and mannose degradation, plasmalogen metabolism and ethanol degradation (Fig. 3). In plants, during heat stress, aerobic respiration is impaired and ethanol is produced.47,48 We observed that several metabolites were mapped to the ethanol degradation pathway (Fig. 3).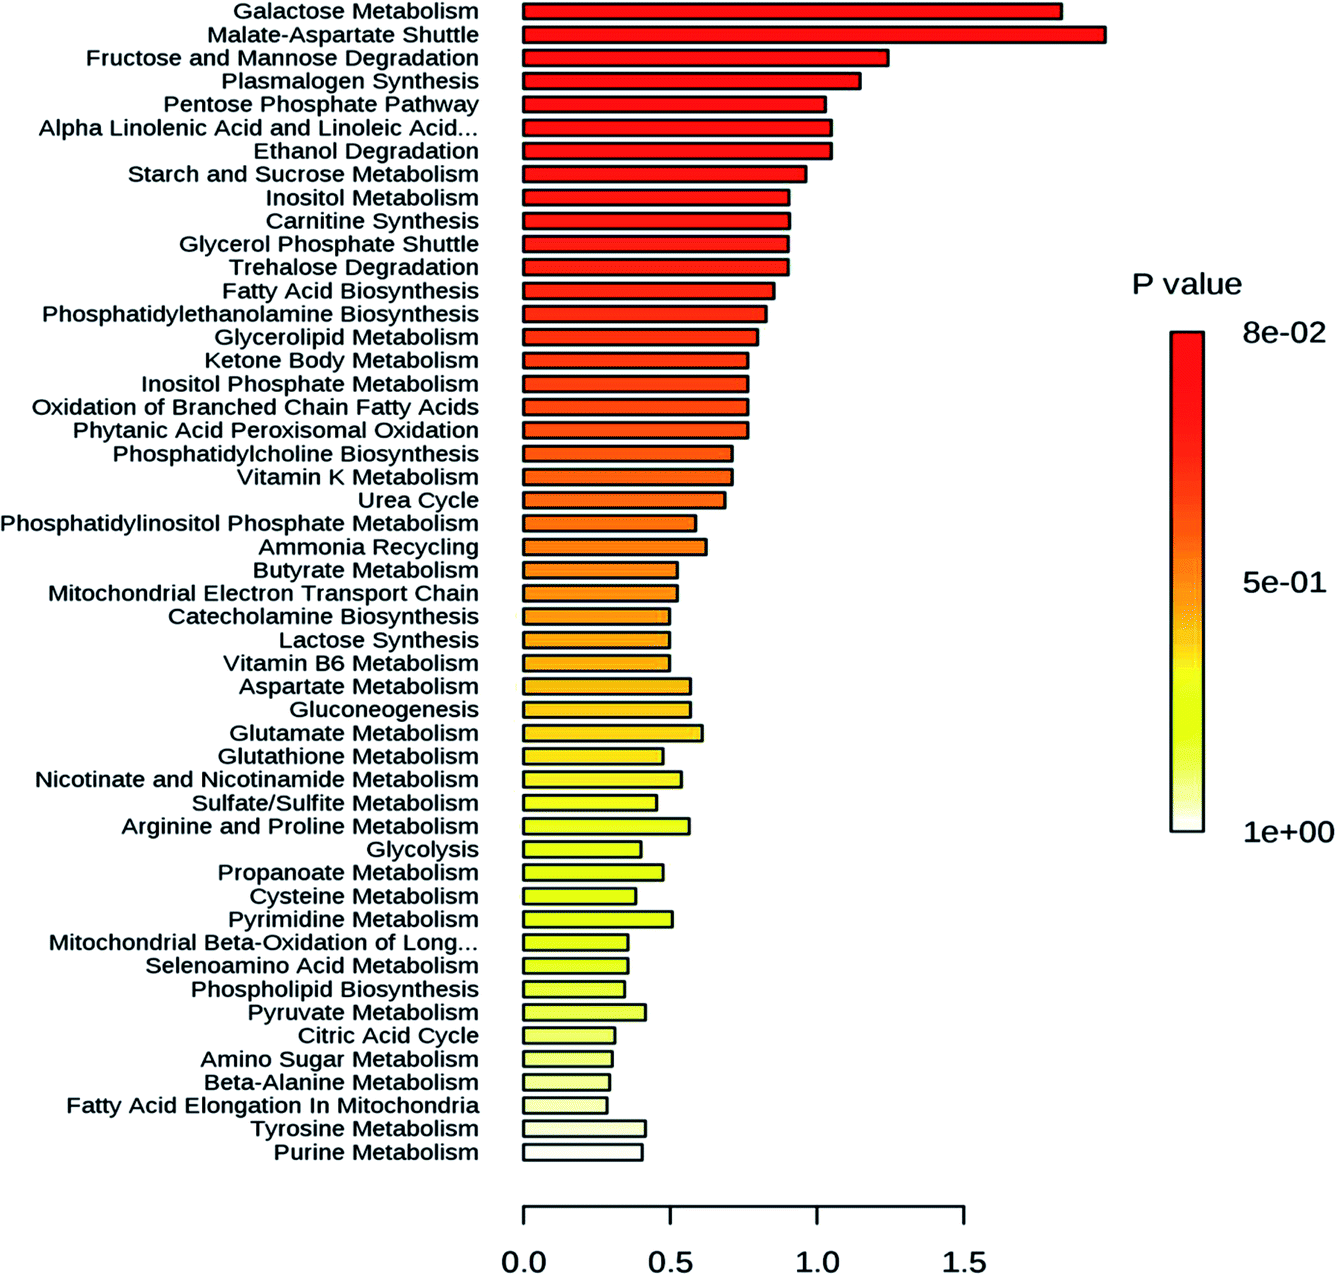 | ||
| Fig. 3 Graphical representation of major metabolic pathways recognized based in the metabolites found in mango fruit in response to heat waves (44 °C) at 49 days after flowering. Highest number of metabolites was mapped to carbohydrate metabolism pathways followed by polyunsaturated fatty acid metabolism pathways and ethanol metabolism pathway, indicating abiotic stress response mechanism which is consistent with mango abiotic stress gene expression. | ||
Linalool is acyclic monoterpene alcohol which imparts a sweet floral note. In this study, MiTPS14 (linalool synthase; MIN034233) gene expression was also studied during the development of Chaunsa mango fruit and GC/MS analysis validates the qualitative abundance of (3S)-linalool at Rt 15.44/peak no. 27, with the highest qualitative abundance, observed at stage 3 (34 DAF) and stage 4 (62 DAF). While the expression level of MiTPS14 was observed to be significantly up-regulated at the inflorescence stage in Chaunsa mango which strongly suggests its role in the biosynthesis of linalool and maybe in the induction of the characteristic flower scent of the mango flower.
In the mango inflorescence tissue, 14 exclusive metabolites including 5 aromatic volatiles, 4 fatty acids, 1 fatty alcohol, 2 aromatic oil compounds, 1 amino acid and 1 monosaccharide were identified. Among these metabolites, 5-isosylveterpinolene, a unique monocyclic monoterpenoid which is considered as a biomarker in black pepper oil (Piper nigrum L. Piperaceae) was also found.49 Gulose, a very rare sweet-tasting monosaccharide was detected.50 Tetracosan-1-ol is known to have antioxidant activity,51 eicosanoic acid is known to regulate tomato fruit development by the isoprenoid pathway.52 Besides, hexatriacontane, previously detected in pepper fruits,53 was also identified in Chaunsa fruit inflorescence. Guaiacol was also identified and has been reported to accumulate in grapevines in response to environmental stress such as bushfire.54 In the present study, we can suggest that 5-isosylveterpinolene (m-mentha-3(8),6-diene) may impart characteristic aroma to Chaunsa mango inflorescence and perhaps hexatriacontane plays a role in the mango response to the heatwaves.
At stage 2 (nascent fruitlets/18 DAF) we identified 10 exclusive metabolites including 7 aromatic volatiles, 1 phytohormone, 1 sugar acid and 1 monosaccharide. Terpene hydrocarbons are considered as major aromatic volatiles in mangoes.7 A dramatic switch in the composition of terpene hydrocarbons in the Chaunsa mango nascent fruitlets significantly marked the initiation of organ development. We also observed a gradual increase in gene expression of MiDHS1 (3-deoxy-D-arabinoheptulosonate 7-phosphate synthase), in Chaunsa mango from stage 2 (Nascent fruitlets/18 DAF) which strongly correlates with this shift in organic acid composition at the start of fruit development. The unique metabolites identified at nascent fruitlet stage included: 2-butenedioic acid (fumaric acid) which gives classical aroma to fleshy fruits,35 4-carene which gives mango-like notes in western and eastern mango cultivars, especially in mango cultivars of Venezuela, China, India and Sri Lanka7 and trans-caryophyllene which is a volatile compound abundant in the sap of 9 Pakistani mango cultivars.6 Hence the qualitative abundance of 4-carene and trans-caryophyllene in Chaunsa nascent fruitlets (18 DAF) marked the transference of photosynthates to the fruit from the leaves. 2,3,4,5-Tetrahydroxypentanoic acid-1,4-lactone (lactone of ribonic acid) was the flavor volatile identified at stage 2 (18 DAF). Ribonic acid was the sugar acid identified at stage 2 in Chaunsa mango. In sugar cane, the application of biostimulants such as humic acid to soil increased the concentration of metabolites involved in cellular growth. Ribonic acid was one such metabolite promoting cellular growth in sugar cane,55 it can be suggested that in mango, ribonic acid may be involved in cellular growth and differentiation. D-Mannose was the monosaccharide identified at the earliest stage during the development of Chaunsa mango fruit, which is known to be a common metabolite between the two metabolic pathways, ascorbate biosynthesis pathway and the primary cell wall synthesis pathway, during tomato fruit development. D-Mannose is converted to L-galactose by D-mannose epimerase.56 Interestingly, indole-3-acetic acid (IAA) was detected as the unique signaling phytohormones at the earliest fruit development stage. IAA induces cell expansion and plays a role in the development of the fruitlet from the ovary during fruit setting.57 Perhaps, the presence of this phytohormone is related to the fruit growth by active cell expansion.
The stage 3 (34 DAF) during the development of Chaunsa mango fruit was characterized by the presence of one unique aroma volatile: benzaldehyde which can contribute with the almond-like aroma to the fruitlets and one carbocyclic sugar myo-inositol, which during Vaccinium corymbosum fruit development is known to undergo simultaneous biosynthesis and oxidation58 and serves as the precursor for major carbohydrate biosynthesis pathways.
At stage 4 (fruitlet/62 DAF) during the development of Chaunsa mango fruit, 2 metabolites, threonic acid and octadecanoic acid, were found only at this stage of development. The presence of threonic acid, a sugar acid, marked the degradation of ascorbic acid building up at previous stages.59 The fatty acid octadecanoic acid marked the initial stages of ripening in Chaunsa mango fruit as previously reported in the mango cultivars Alphonso, Pairi and Kent.9
At stage 5 (un-ripe fruit/79 DAF) during the development of Chaunsa mango fruit, L-alanine was the main free amino acid identified, which indicated the transition to active ripening and sweet flavor development. It may be suggested that the presence of L-alanine at this stage may be due to the subsequent catabolism of γ-aminobutyric acid to L-alanine by pyruvate-dependent GABA transaminase (GABA-TP) in Chaunsa mango fruit.27 In agreement with this finding, a study in Prunus persica60 also indicated the quantitative abundance and up-regulation of L-alanine at the initiation of fruit ripening during development. During tomato fruit ripening, it was observed that there was an increase in peptidases activity which ultimately increased the content of free amino acids in pulp such as L-glutamate and conferred “Umami” flavor to the fruit.61 It is interesting that at this particular stage of development, the gene MiGAD1 encoding for a glutamate decarboxylase, which plays a role in the metabolic pathway of GABA biosynthesis, showed a large increase in expression.
Stage 6 was characterized by the presence of 2 exclusive metabolites, 2-pyrrolidone-5-carboxylic acid which is a volatile compound and an anhydro_sugar, levoglucosan. 2-Pyrrolidone-5-carboxylic acid (pyroglutamic acid) is a cyclic lactam of glutamic acid and can be converted to free amino acid L-glutamate by 5-oxoprolinase.62 This may indicate the subsequent catabolism of γ-aminobutyric acid to L-glutamate by α-ketoglutarate-dependent GABA transaminase (GABA-TK) giving the characteristic ‘Umami’ flavor to un-ripe Chaunsa mango fruit and the initiation of the animal attraction phenomena for seed dispersal.63
Post-harvest Chaunsa mango stages included stage 7 (10 DAH) and stage 8 (15 DAH). Stage 7 (10 DAH/partially ripened mango fruit) was characterized by 2 exclusive metabolites, acetoxyacetic acid (glycolic acid, acetate) and (4,5-trans)-3-methylene. Acetoxyacetic acid plays a role as an intermediate the in glyoxylate and dicarboxylate metabolism pathway. Stage 8 (15 DAH/fully ripened mango fruit) was characterized by 4 discriminating metabolites including 2 saturated fatty acids: 2-monopalmitin and myristic acid, 1 sugar acid: galactonic acid and 1 sugar alcohol: pentitol. Further, these metabolites can be playing a role as intermediates in secondary metabolite biosynthesis. Myristic acid characterized at this stage suggests the active biosynthesis of different fatty acids.9 Galactonic acid identified at this stage suggest the activation of galacturonate reductase and aldonolactonase which increase the ascorbate (vitamin C) level thereby regulating detoxification of ROS.64,65
3. Material and methods
3.1. Plant materials and growth conditions
| Mango stages of development | Sample collection dates |
|---|---|
| Inflorescence | 12 Feb 2018 |
| Nascent fruitlets | 3 March 2018 |
| Fruitlets | 19 March 2018 |
| Un-ripe fruit | 16 April 2018 |
| Un-ripe fruit | 3 May 2018 |
| Post-harvest mango | 16 May 2018 |
| Harvested un-ripe mango | 27 May 2018 |
| Harvested ripe mango, artificially ripened | 1 June 2018 |
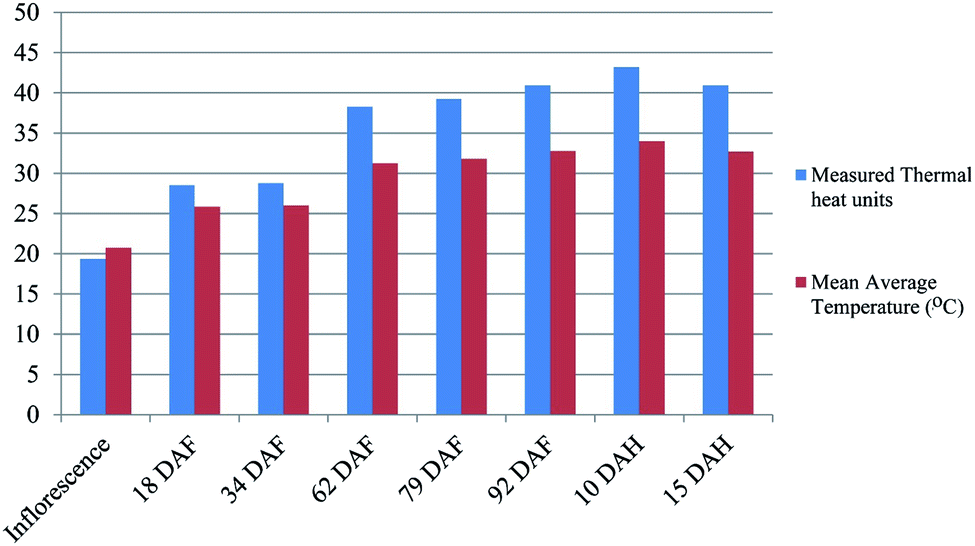 | ||
| Fig. 4 Thermal heat unit (TU) accumulated during ‘Chaunsa’ mango fruit development. Thermal heat unit accumulation during mango fruit ontogeny. The X-axis indicate the different stages of mango fruit development in days after flowering (DAF) and the Y axis shows the amount of thermal units (TU) accumulated with respect to mean average temperature in Celsius degree. The minimum basal temperature for mango tree growth was considered as 10 °C, given as the temperature threshold before the plant growth shutdown. The graphical representation indicate that heat thermal units significantly accumulated at 79 days after flowering (DAF) in mango fruit during development. Thermal heat units were calculated based in a free software (https://hort.purdue.edu/rhodcv/hort410/csheatuj.htm). | ||
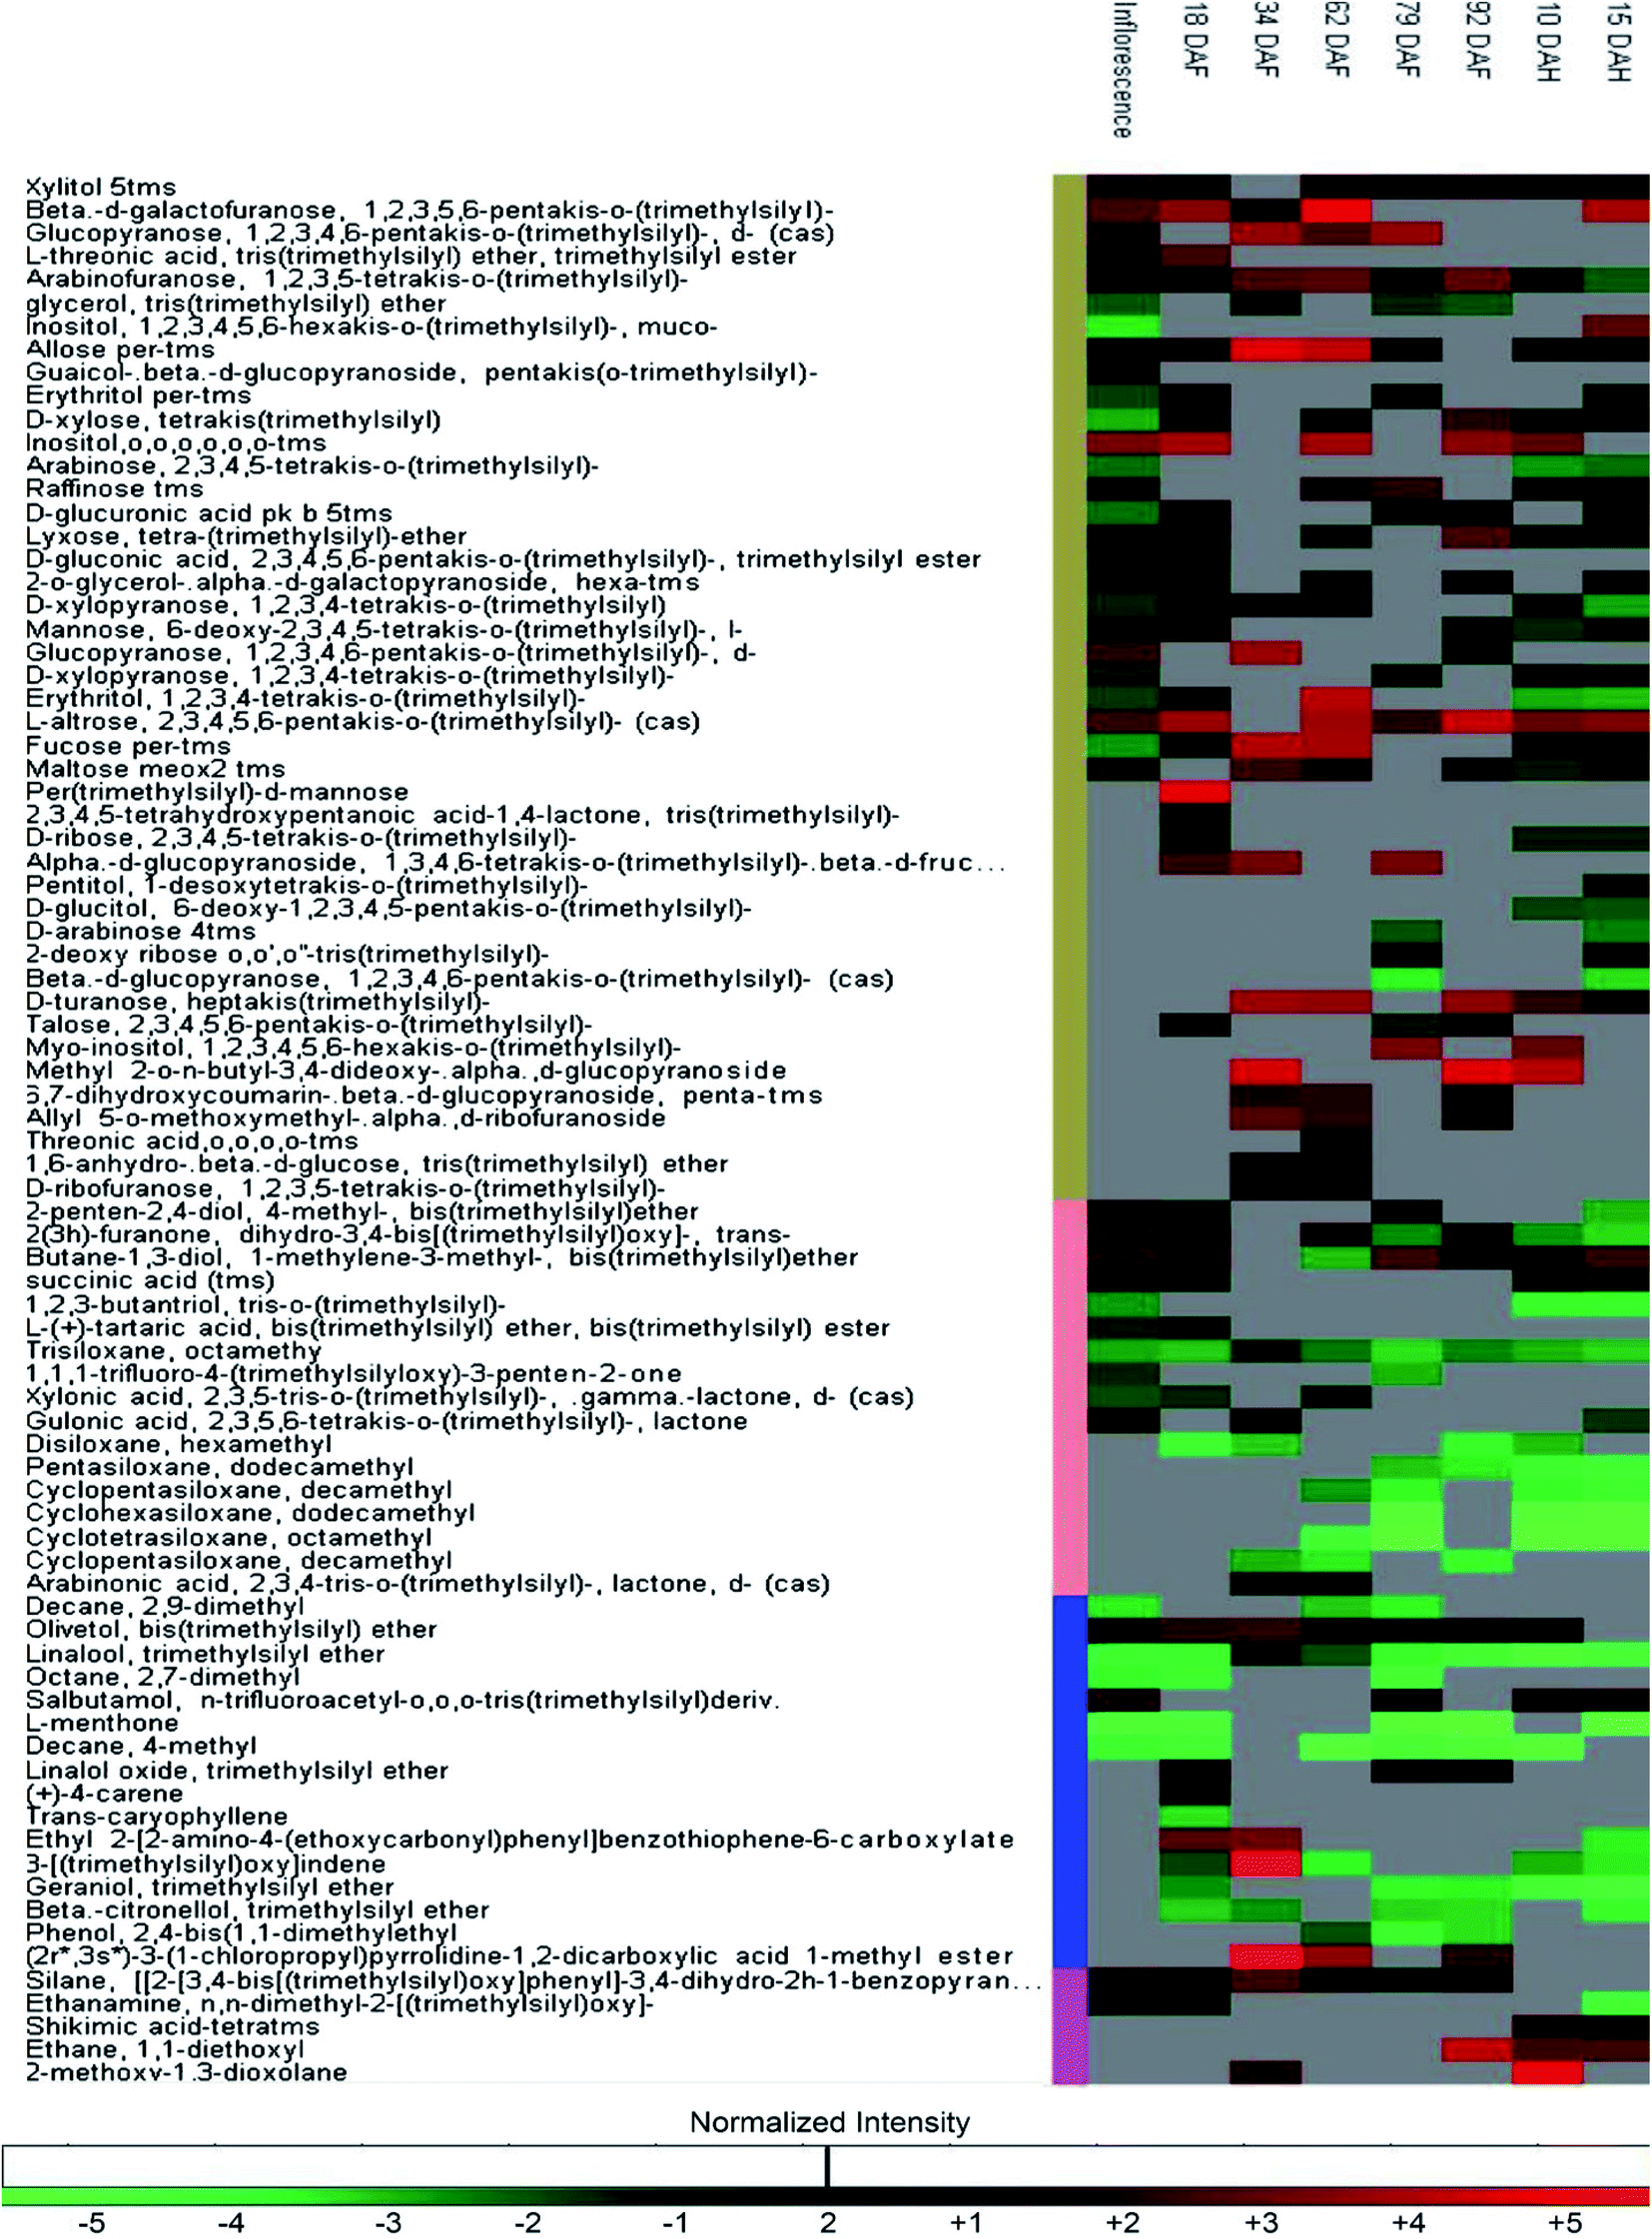 | ||
| Fig. 5 Heat map showing the changes in qualitative abundance of volatile metabolites in Chaunsa mango fruit at inflorescence, 18 DAF, 34 DAF, 62 DAF, 79 DAF, 92 DAF, 10 DAH and 15 DAH. The log2 fold change ratios are shown in the results. Qualitative abundance of a particular metabolite at each stage is represented by red for higher qualitative abundance, green for lower qualitative abundance and grey for absence of the particular metabolite at the specific stage. DAF: days after flowering and DAH: days after harvest. | ||
3.2. RNA extraction, cDNA library construction and sequencing
Three biological replicates of mango pulp were sequenced. Each sample consisted of 10 mesocarp discs. Samples were separately ground into fine powder in liquid nitrogen and thoroughly mixed for extraction. Mango (Mangifera indica L. cv. Chaunsa White) mesocarp tissue was ground in liquid nitrogen using a mortar and pestle and 10 mg of sample was prepared for total RNA extraction by following the CTAB method.66 The total RNA quality was evaluated by measuring 260 nm/280 nm and 260 nm/230 nm ratios by using a Nanodrop 2000 (Thermo Fisher Scientific, Waltham, Massachusetts, USA). The RNA integrity was checked using Bioanalyzer 2100 (Agilent Technologies, Santa Clara, USA). For cDNA library construction, 1 μg/10 μL of total RNA per sample was used to construct a single cDNA library. 1 μg/10 μL of total RNA amount was calculated by Qubit® 2.0 Fluorometer (Thermo Fisher Scientific, Waltham, Massachusetts, USA). mRNA was purified using oligo(dT) magnetic beads for cDNA synthesis using the SENSE mRNA-Seq library Prep kit for SOLiD™ by Lexogen (Vienna BioCenter, Vienna, Austria) according to the manufacturer's instructions. Random hexamers were used for cDNA synthesis. The barcoded cDNA library was enriched using 15 PCR cycles and was validated on the Bioanalyzer 2100 (Agilent Technologies, Santa Clara, USA). The average fragment size of the cDNA library was 270 bp. The final volume of the library was calculated according to the SOLiD™ EZ 80 Bead™ calculator before using SOLiD™ EZ 80 Beads (catalog no.: 4452722) followed by SOLiD™ emulsion PCR and enrichment. The resulting cDNA library was sequenced in a single end run by using the 5500 SOLiD™ system (Applied Biosystems, Carlsbad, CA, USA) according to the manufacturer's recommended protocols at Jamil-ur-Rahman Center for Genome Research, International Center for Chemical and Biological Sciences (University of Karachi, Karachi, Pakistan).3.3. RNA-Seq data processing, de novo assembly and annotation
RNA-Seq was carried out to characterize the mango fruit transcriptome and to identify the transcripts conferring stress resistance in mango fruit. The 5500 SOLiD™ sequencer generated raw data in XSQ format.67 The XSQ format file was splitted and converted to csFASTA and Qual format files using SOLiD™ LifeScope software XSQ tool. Low-quality raw reads were removed and filtered by SOLiD_preprocess_filter v2.pl Perl script.68 The pre-processing of raw reads generated high-quality clean reads in color-space FASTq format. More than 2 million filtered reads were then assembled by SATRAP (SOLiD Assembler TRAnslation Program) de novo assembler,69 by using k-mers set of 31, 29, 27 and 25. SATRAP is a RNA-Seq de novo assembly pipeline that integrates the short read assemblers, Oases and Velvet, for de novo assembly and translation of color-space sequences into a base-space format and finally, into accurate transcripts. Non-redundant transcripts were extracted by CD-HIT-EST program70 at a 90% similarity threshold.These transcripts were submitted for alignment and comparison using BLASTx with a significant E-value threshold ≤10−5 through DIAMOND program,71 to protein databases including the non-redundant protein database (https://blast.ncbi.nlm.nih.gov/), SWISS-PROT (https://web.expasy.org/), Kyoto Encyclopedia of Genes and Genomes (KEGG) database (https://www.genome.jp/kegg/) and BlastKOALA tool (https://www.kegg.jp/blastkoala/) for classification and annotation of transcripts into biological terms such as molecular function, biological processes, and cellular components.72 GMATA tool73 was used for the identification of the most abundant monomer and dimer motifs in transcripts. RSEM software74 was used for abundance estimation of gene transcripts based on their expected counts in the high throughput short single-end read based RNA-Seq transcripts.
3.4. Identification of gene transcripts regulating abiotic stress and metabolic biosynthesis pathways in mango fruit cv. Chaunsa White
Orthologous gene transcripts for Arabidopsis thaliana3,12 catalyzing abiotic stress regulation (glutamate decarboxylase: MiGAD1, nucleoredoxin: MiNRX1, catalase: MiCAT1, peroxidase: MiPER42 and glutathione S-transferase 1 family protein: MiGSTF6), circadian rhythm control (gigantea: MiGI and wound-induced protein: MiWun1), carbohydrate metabolism (fructose-bisphosphate aldolase: MiFBA6), shikimate pathway (3-deoxy-D-arabino heptulosonate 7-phosphate synthase: MiDHS1), flavonoid biosynthesis (chalcone synthase: MiCHS1) and monoterpenoid biosynthesis (linalool synthase: MiTPS14) were selected and identified in Chaunsa mango transcriptome for real-time quantitative PCR. The pathways were identified using the SOLiD sequencing data based on the candidate gene name. Each transcript sequence was confirmed using the Basic Local Alignment Search Tool (BLAST) program in the National Center for Biotechnology Information (NCBI) GenBank database (https://blast.ncbi.nlm.nih.gov/Blast). Transcript IDs and their functions were further annotated by querying the mango RNA-Seq Database of mango exocarp genes including 107744 annotated unigenes (http://bioinfo.bti.cornell.edu/cgi-bin/mango/index.cgi).8 Primers for quantitative real-time PCR analysis were designed using transcripts from an available public database mango gene transcript.8 Gene-specific primers for quantitative real-time PCR were designed by using the Primer-BLAST tool (https://www.ncbi.nlm.nih.gov/tools/primer-blast/). Genes selected for quantitative real-time PCR are represented in (Table 2). Primer sequences are provided in ESI Table S1.†
| Mango gene ID | Transcript ID (Mi ID) mango RNA-Seq database | BLASTx acc. no. (best hit NCBI ID/E_value) | Protein identity/query cover (%) | Gene product | Physiological role of a gene product |
|---|---|---|---|---|---|
| MiFBA6 | Fructose-bisphosphate aldolase (MIN045720) | XP_020884244.1 (0.0) | 315/358 | D-Glyceraldehyde 3-phosphate | Glycolysis/gluconeogenesis pathway |
| MiDHS1 | 3-Deoxy-D-arabino heptulosonate 7-phosphate (DAHP) synthase (MIN101907) | OAO98609.1 (0.0) | 423/524 | 3-Deoxy-D-arabino-hept-2-ulosonate 7-phosphate | Shikimate pathway |
| MiCHS1 | Chalcone synthase (MIN008659) | AIB06737.1 (5 × 10−101) | 144/144 | Naringenin chalcone | Flavonoid metabolism |
| MiTPS14 | Linalool synthase (MIN034233) | BAP75559.1 (0.0) | 368/574 | (3S)-Linalool | Mono-terpenoid biosynthesis |
| MiGAD1 | Glutamate decarboxylase, putative (MIN030549) | NP_197235.1 (0.0) | 428/503 | 4-Aminobutanoate (GABA) | Alanine, aspartate and glutamate metabolism |
| MiWun1 | Wound-induced protein (MIN012085) | EOY17640.1 (4 × 10−76) | 124/176 | Cellular senescence pathway regulation protein | Cellular senescence |
| MiGI | Gigantea (MIN091141) | XP_006473104.1 (0.0) | 1013/1171 | Nuclear protein gigantea | Plant circadian rhythm control, photoperiodic flowering and cell differentiation |
| MiNRX1 | Nucleoredoxin, putative (MIN030177) | XP_006438373.1 (0.0) | 424/562 | Probable nucleoredoxin 1 | Oxidative stress control |
| MiCAT1 | Catalase (MIN013296) | XP_006435361.1 (0.0) | 429/493 | Catalase | Oxidative stress control |
| MiPER42 | Peroxidase (MIN049184) | XP_006467438 (0.0) | 276/309 | Peroxidase 42 | Oxidative stress control |
| MiGSTF6 | Glutathione S-transferase 1 family protein (MIN073310) | XP_006444273.1 (6 × 10−119) | 163/213 | Glutathione S-transferase F6 | Detoxification |
| Stage of development | Putative metabolites | No. of exclusive metabolites | Exclusive metabolites |
|---|---|---|---|
| Inflorescence (stage 1, day 0) | 129 | 14 | Aromatic volatiles: (E)-3-prop-2-en-1-ol, 4-trimethylphenethyl-n,n-bis-amine, 1′-hydroxymethyl benzenesulfonyl, hexatriacontane, guaiacol |
| Fatty alcohol: tetracosan-1-ol | |||
| Fatty acid and oils: docosanoic acid, butanoic acid, eicosanoic acid, Tetracosanoic acid | |||
| Amino acid: L-valine | |||
| Monosaccharide: gulose | |||
| Aromatic oil: 5-isosylveterpinolene, hexatriacontane | |||
| Nascent fruitlets (stage 2, 18 DAF) | 131 | 10 | Phytohormone: 1H-indole-3-acetic acid |
| Aromatic volatiles: 2-butenedioic acid, carene, trans-caryophyllene, 2,3,4,5-tetrahydroxypentanoic acid-1,4-lactone, [(3E)-methylidene] octahydroinden-4-one, 4-cyano-4-methyltetralone, decane (sesquiterpenoid) | |||
| Sugar acid: ribonic acid | |||
| Monosaccharide: D-mannose | |||
| Fruitlets (stage 3, 34 DAF) | 87 | 2 | Aromatic volatiles: benzaldehyde (almond like aroma) |
| Carbocyclic sugar: inositol | |||
| Un-ripe fruit (stage 4, 62 DAF) | 99 | 2 | Sugar acid: threonic acid |
| Fatty acid: octadecanoic acid | |||
| Un-ripe fruit (stage 5, 79 DAF) | 106 | 1 | Amino acid: L-alanine |
| Post-harvest mango (stage 6, 92 DAF) | 103 | 2 | Volatile compound: 2-pyrrolidone-5-carboxylic acid |
| Anhydrosugar: levoglucosan | |||
| Harvested un-ripe mango (stage 7, 10 DAH) | 115 | 2 | Volatile compound: acetoxyacetic acid, (4,5-trans)-3-methylene |
| Harvested ripe mango (stage 8, 15 DAH) | 122 | 4 | Fatty acid and oils: 2-monopalmitin, myristic acid |
| Sugar Alcohol: pentitol | |||
| Sugar Acid: galactonic acid |
3.5. Transcriptional level analysis by reverse transcription-quantitative real-time PCR (RT-qPCR)
RT-qPCR experiment was performed in three biological replicates per stage to calculate the expression level of each transcript. High-quality RNA was extracted from the different tissues of mango and cDNA synthesis for quantitative PCR was carried out using the Revert Aid First Strand cDNA synthesis kit (Thermo Fisher Scientific, Waltham, Massachusetts, USA). The reaction mixture contained 4 μL of cDNA (from 20-fold diluted resulting cDNA), 10 μL of SYBR® Green 1 qPCR Master Mix (Promega, Wisconsin, United States), 1 μL (10 μM) of each sense and anti-sense primer, and DEPC-treated water to a final volume of 20 μL per well. Thermal cycling conditions consisted of 10 min at 95 °C, followed by 40 cycles at 95 °C for 15 s, 60 °C for 1 min and 72 °C for 30 s. The quantitative real-time PCR analysis was performed in a Stratagene Real-Time PCR system (Agilent Technologies, Santa Clara, CA, USA). High-resolution melt curve analysis was used to determine the specificity of the amplicon. The PCR products were also purified and their concentration was measured to calculate the number of cDNA copies. The expression level of all genes was calculated by the relative quantification method75 by using MiActin1 gene (GenBank accession no. JF737036) as a housekeeping gene based on its previous selection as an endogenous control gene for eight mango tissue samples.83.6. Antioxidant activity analysis by DPPH free radical-scavenging assay
Experiments were performed in three biological replicates per stage to analyze the free radical-scavenging capacity of fruit's antioxidants per stage. The antiradical activity of mango fruit inflorescence and fruit pulp extracts were determined based on the radical-scavenging effect of the stable 1,1-diphenyl-2-picrylhydrazyl (DPPH) free radical by performing DPPH assay.DPPH solution (95 μL, 300 μM) in ethanol was mixed with test solution (prepared extract, 5 μL, 500 μM) in DMSO. The reaction was allowed to progress for 30 min at 37 °C in dark. The absorbance was monitored by Tecan (Magellan, Tecan Trading AG, Switzerland) instrument. Upon reduction, the color of the solution fades (violet to pale yellow) at which the percent radical scavenging activity (% RSA) was determined by comparison with a DMSO treated control. The concentration which caused a decrease in the initial DPPH concentration by 50% was defined as IC50 values. N-Acetyl-L-cysteine and gallic acid were used as positive controls. The % radical scavenging activities of compounds were calculated by using the following equation:
| % RSA of test compound = (1 − absorbance of the test sample)/(absorbance of the DMSO treated control) × 100 |
The IC50 values for DPPH radical scavenging assay were analyzed by using the EZ-fit enzyme kinetics software program (Perrella Scientific Inc. Amherst, MA, USA) and the data obtained from in vitro experiments were expressed as mean ± standard error.
3.7. GC-MS analysis to characterize Chaunsa White mango metabolites
Samples were prepared for gas chromatography-mass spectrometry (GC-MS) from freeze-dried mango tissue samples as described previously with slight modifications in biological replicates per stage.76 GC-MS analysis was carried out to understand the changes in metabolites profile due to heat exposure to further support transcriptomic data. Briefly, 1 g of the samples were weighed and crushed in liquid nitrogen. 50 mg of finely crushed material was extracted with 1 mL of methanol and 50 μL of ribitol (1 mg mL−1 in water) was added as an internal standard, followed by sonication for 30 min at 25 °C. The sample was centrifuged at 11000 × g for 15 min at 4 °C. The supernatant was transferred to a fresh tube and mixed with 0.5 mL of chloroform, followed by the addition of 1 mL of water and 10 s vortex. The sample was centrifuged at 3000 × g for 10 min at 4 °C and the upper phase was transferred to a fresh 2 mL tube and dried using speed vacuum before derivatization step. Next, 50 μL of methoxyamine hydrochloride (10 mg mL−1 in pyridine) was added to the sample followed by 1 h incubation at 70 °C. 50 μL of N-methyl-n-(trimethylsilyl)trifluoroacetamide was added to sample and incubated for 30 min at 37 °C. The sample was centrifuged at 12000 rpm for 10 min to remove precipitates. 100 μL of the supernatant was transferred to the autosampler vial (Innotech, Japan). 1 μL of sample volume was injected for GC-MS analysis on 7000C triple quadrupole mass spectrometer, coupled to a gas chromatograph 7890 (Agilent Technologies, Santa Clara, CA, USA) equipped with an auto sampler. The GC column used was silica capillary column OPTIMA®, 30 m × 0.25 mm i.d. of film thickness 5–0.50 μm (MACHEREY-NAGEL, Germany). The pressure of the carrier gas (helium) was 9.05 pounds per square inch at the initial oven temperature with a flow rate of 3 mL min−1. All the samples and standards were injected in split mode (split/column flow ratio 10:1). The injector temperature was at 250 °C; the oven temperature was 50 °C for 2 min initially, rise to 250 °C at the rate of 10 °C min−1 for a total run time of 80 min. The mass spectrometer was operated in the electron impact (EI) mode at 70 eV in the scan range of 50–700 m/z. The temperature of the transfer line and the ion source was set to a value of 320 °C and 280 °C. Metabolites were identified by comparing to library entries of purified standards and also by extracting the features by using Mass Hunter software (Agilent) for further processing. Compounds were identified by searching obtained mass spectra in the Wiley and NIST 2008 libraries (Wiley Registry™, 8th Edition Mass Spectral Library, and the NIST 09 Mass Spectral Library [NIST/EPA/NIH] 2008 version), with an acceptance criterion of a score match ≥70%. The relative percentage contents of all compounds were calculated by normalizing the peak areas to the sum of intensities.
3.8. Statistical analysis
The qRT_PCR was performed using three biological replicates per stage, each consisting of 10 mesocarp discs. For real-time quantitative PCR results, statistical analysis of the whole data was performed by a two-way ANOVA test with one discriminating factor being mango fruit developmental stage. For each gene at a particular developmental stage, the highest expression at a particular mango fruit development stage was considered as 1 for normalization. The normalized gene expression data were used for graphical presentation (Fig. 2a and b). The values were expressed as means ± standard deviation.The data acquired from GC-MS was subjected to functional analysis and metabolic pathways annotation by an online available MetaboAnalyst tool was used.77
GC-MS chromatograms supporting the results are all provided in ESI Table S1.†
4. Conclusion
Several metabolic pathways become active as part of the mango fruit response molecular mechanism to extreme heatwaves. It appears that heatwaves induce the synthesis of reactive oxygen species (ROS) and increase the rate of the ripening phenomena in mango fruits. ROS generation activated the antioxidant defense mechanism and altered the metabolome which is needed for systemic acclimation to heat stress in fruits. A large expression of glutamate decarboxylase, wound-induced protein, nucleoredoxin, gigantea and fructose bisphosphate aldolase genes was observed in response to heat stress. These genes regulate gamma aminobutyric acid metabolism, cellular senescence, reactive oxygen species homeostasis, circadian rhythm control and carbon and nitrogen flux, respectively. Moreover, several carbohydrates, amino acids, fatty alcohols, steroids, terpenoids, triterpenoids and sesquiterpenoids play a role in heat stress protection in mango fruit. These metabolites are known to serve as antioxidants, osmolytes, development precursors and membrane protectants in Arabidopsis thaliana under heat stress. It can be suggested that there is an interplay of several major metabolic pathways in response to heatwaves. From the data, it can also be stated that 79 days after flowering corresponds with a time of development in which the mango fruit begins actively the ripening phenomena. The identification of antioxidant gene cascade and antioxidant pathways in Chaunsa mango fruit explains the adaptation of the fruit to various stresses by the activation of enzymatic and non-enzymatic defense systems, respectively. Furthermore, the identification of exclusive metabolites at each developmental stage suggests the presence of unique metabolic pathways that could be related to the characteristic mango organoleptic properties. It can be suggested that these metabolites can be used as markers for cultivar identification and selection.Abbreviations
| SOLiD | Sequencing by oligonucleotide ligation and detection |
| DAF | Days after flowering |
| DAH | Days after harvest |
| DPPH | 1,1-Diphenyl-2-picrylhydrazyl radical |
| GC-MS | Gas chromatography-mass spectrometry |
| ROS | Reactive oxygen species |
| BABA | Beta-aminobutyric acid |
| GABA | Gamma aminobutyric acid |
| DMSO | Dimethyl sulfoxide |
| RPM | Revolutions per minute |
Author contributions
Zainab Khanum, Martín E. Tiznado-Hernández and Ishtiaq Ahmad Khan conceived and designed the experiments. Zainab Khanum and Arslan Ali performed the bioinformatics analysis, RT-qPCR and GC/MS experiments, analyzed the data and wrote the manuscript. Zainab Khanum and Muhammad Shakeel performed RNA-Seq library preparation experiments. All the authors have read and approved the final manuscript.Conflicts of interest
This research work was supported by SEARLE pharmaceutical Private Ltd. research grant for International Center for Chemical and Biological Sciences, University of Karachi, Pakistan, in order to support good agriculture practices and promote food security. The authors declare no competing financial interest.Acknowledgements
We are thankful to Prof. Dr M. Iqbal Choudhary and Prof. Dr Darakshan Jabeen Haleem (International Center for Chemical and Biological Sciences, University of Karachi, Pakistan) for providing the laboratory facilities. The research work was funded by SEARLE Pharmaceuticals Pakistan Ltd., USA.References
- M. Islam and A. Wong, Environments, 2017, 4, 38 CrossRef.
- Q. L. Wang, J. H. Chen, N. Y. He and F. Q. Guo, Int. J. Mol. Sci., 2018, 19, 849 CrossRef.
- N. Serrano, Y. Ling, A. Bahieldin and M. M. Mahfouz, Sci. Rep., 2019, 9, 181 CrossRef.
- R. N. Tharanathan, H. M. Yashoda and T. N. Prabha, Food Rev. Int., 2006, 22, 95–123 CrossRef CAS.
- M. K. Azim, I. A. Khan and Y. Zhang, Plant Mol. Biol., 2014, 85, 193–208 CrossRef CAS.
- S. G. Musharraf, J. Uddin, A. J. Siddiqui and M. I. Akram, Food Chem., 2016, 196, 1355–1360 CrossRef CAS.
- L. Li, X. W. Ma, R. L. Zhan, H. X. Wu, Q. S. Yao, W. T. Xu and S. B. Wang, PLoS One, 2017, 12, e0187487 CrossRef.
- J. C. Tafolla-Arellano, Y. Zheng, H. Sun, C. Jiao, E. R. May, M. A. Hernández-Oñate and J. K. Rose, Sci. Rep., 2017, 7, 46163 CrossRef CAS.
- A. B. Deshpande, K. Anamika, V. Jha, H. G. Chidley and V. S. Gupta, Sci. Rep., 2017, 7, 8711 CrossRef.
- M. A. Haroon, J. Zhang and F. Yao, Nat. Hazards, 2016, 84, 1349–1366 CrossRef.
- L. Li, C. Luo, F. Huang and X. He, Sci. Hortic., 2019, 248, 274–281 CrossRef CAS.
- L. S. Moshe, S. Hübner and Z. Peleg, BMC Plant Biol., 2015, 15, 111 CrossRef.
- D. D'Esposito, F. Ferriello and G. Giuliano, BMC Plant Biol., 2017, 17, 66 CrossRef.
- E. Katz, K. H. Boo and E. Blumwald, J. Exp. Bot., 2011, 62, 5367–5384 CrossRef CAS.
- N. M. Ponte, R. J. Mendes, S. Sario and C. Santos, J. Plant Physiol., 2018, 221, 32–42 CrossRef.
- S. I. Zandalinas, D. Balfagón, V. Arbona and A. G. Cadenas, Front. Plant Sci., 2017, 8, 953 CrossRef.
- M. J. Choi, E. J. Lee, J. S. Park and H. S. Kim, Biochem. Pharmacol., 2017, 144, 120–131 CrossRef CAS.
- V. Sivankalyani, N. Sela, O. Feygenberg and N. Alkan, Front. Plant Sci., 2016, 7, 1579 Search PubMed.
- R. Mittler, A. Finka and P. Goloubinoff, Trends Biochem. Sci., 2012, 37, 118–125 CrossRef CAS.
- M. J. Qian, E. Rosenqvist, A. M. Flygare, I. Kalbina, Y. W. Teng, M. A. K. Jansen and A. Strid, Sci. Hortic., 2020, 263, 109110 CrossRef CAS.
- R. A. Dixon and N. L. Paiva, Plant Cell, 1995, 7, 1085 CrossRef CAS.
- O. M. Ighodaro and O. A. Akinloye, Alexandria J. Med., 2018, 54, 287–293 CrossRef.
- R. Szymańska, I. Ślesak, A. Orzechowska and J. Kruk, Environ. Exp. Bot., 2017, 139, 165–177 CrossRef.
- S. Li, W. Wang, J. Gao, K. Yin, R. Wang, C. Wang, M. Petersen, J. Mundy and J. L. Qiu, Plant Cell, 2016, 28, 2866–2883 CrossRef CAS.
- S. Huyskens-Keil, I. Eichholz-Dundar, K. Hassenberg and W. B. Herppich, Postharvest Biol. Technol., 2020, 161, 111069 CrossRef CAS.
- R. Nakabayashi, K. Yonekura-Sakakibara, K. Urano, M. Suzuki, Y. Yamada, T. Nishizawa, F. Matsuda, M. Kojima, H. Sakakibara, K. Shinozaki, A. J. Michael, T. Tohge, M. Yamazaki and K. Saito, Plant J., 2014, 77, 367–379 CrossRef CAS.
- Y. Shinozaki, P. Nicolas, N. F. Pozo and E. Z. May, Nat. Commun., 2018, 9, 364 CrossRef.
- K. Mondal, S. P. Malhotra, V. Jain and R. Singh, Physiol. Mol. Biol. Plants, 2009, 15, 327 CrossRef CAS.
- A. Masia, Physiol. Plant., 1998, 104, 668–672 CrossRef CAS.
- S. Kneeshaw, R. Keyani, V. D. Hinoux and S. H. Spoel, Proc. Natl. Acad. Sci. U. S. A., 2017, 114, 8414–8419 CrossRef CAS.
- G. Wehner, C. Balko, K. Humbeck, E. Zyprian and F. Ordon, BMC Plant Biol., 2016, 16, 3 CrossRef.
- B. Cheng, Z. Li, L. Liang, Y. Cao, W. Zeng, X. Zhang and Y. Peng, Int. J. Mol. Sci., 2018, 19, 2520 CrossRef.
- V. Ziogas, G. Tanou, M. Belghazi, G. Diamantidis and A. Molassiotis, Plant Cell Rep., 2017, 36, 787–789 CrossRef CAS.
- W. Li, J. Liu, U. Ashraf, G. Li, Y. Li, W. Lu and J. Hu, Front. Plant Sci., 2016, 7, 919 Search PubMed.
- D. M. Kasote, S. S. Katyare, M. V. Hegde and H. Bae, Int. J. Biol. Sci., 2015, 11, 982 CrossRef CAS.
- D. Sivakumar, Y. Jiang and E. M. Yahia, Food Res. Int., 2011, 44, 1254–1263 CrossRef.
- Y. Wang, Z. Luo, X. Huang, K. Yang, S. Gao and R. Du, Sci. Hortic., 2014, 168, 132–137 CrossRef CAS.
- F. X. Liu, S. F. Fu, X. F. Bi and J. H. Wu, Food Chem., 2013, 138, 396–405 CrossRef CAS.
- M. K. Ediriweera, K. H. Tennekoon and S. R. Samarakoon, J. Evidence-Based Complementary Altern. Med., 2017, 2017, 6949835 Search PubMed.
- G. V. Rodríguez, H. T. Moreno, M. V. Ochoa and G. G. Aguilar, Molecules, 2018, 23, 695 CrossRef.
- M. C. Dias, D. C. G. A. Pinto, H. Freitas, C. Santos and A. M. S. Silva, Phytochemistry, 2020, 170, 112199 CrossRef CAS.
- S. Bhattacharjee, Curr. Sci., 2005, 1113–1121 CAS.
- X. Ma, H. Xia, Y. Liu and L. Luo, Front. Plant Sci., 2016, 7, 1886 Search PubMed.
- T. J. Makhafola, E. E. Elgorashi, L. J. McGaw and J. N. Eloff, BMC Complementary Altern. Med., 2017, 17, 446 CrossRef.
- C. E. Quijano, G. Salamanca and J. A. Pino, Flavour Fragrance J., 2007, 22, 401–406 CrossRef CAS.
- A. D. Dehsheikh, M. M. Sourestani and J. Mottaghipisheh, Foods, 2019, 8, 52 CrossRef CAS.
- R. G. Kelsey and D. J. Westlind, BioScience, 2017, 67, 443–451 CrossRef.
- E. A. Cossins and H. Beevers, Plant Physiol., 1963, 38, 375 CrossRef CAS.
- C. Nussbaumer, R. Cadalbert and P. Kraft, Helv. Chim. Acta, 1999, 82, 53–58 CrossRef CAS.
- M. Swain, J. R. Brisson, G. D. Sprott, F. P. Cooper and G. B. Patel, Biochim. Biophys. Acta, Lipids Lipid Metab., 1997, 1345, 56–64 CrossRef CAS.
- C. Luo, X. H. He, Y. Hu, H. X. Yu, S. J. Ou and Z. B. Fang, Gene, 2014, 548, 182–189 CrossRef CAS.
- M. R. Concepción and W. Gruissem, Plant Physiol., 1999, 119, 41–48 CrossRef.
- A. Wesolowska, D. Jadczak and M. Grzeszczuk, Acta Scientiarum Polonorum Hortorum Cultus, 2011, 10, 171–184 Search PubMed.
- A. I. Garcia, K. L. Wilkinson and M. R. Salinas, Food Chem., 2017, 217, 782–789 CrossRef.
- N. O. Aguiar, F. L. Olivares, E. H. Novotny and L. P. Canellas, PeerJ, 2018, 6, e5445 CrossRef.
- L. M. Gilbert, M. Dumont, C. Ferrand, C. Bournonville, A. Monier, J. Jorly, M. C. Chamley, K. Mori, I. Atienza, M. Hernould and R. Stevens, J. Exp. Bot., 2016, 67, 4767–4777 CrossRef.
- L. Mariotti, P. Picciarelli, L. Lombardi and N. Ceccarelli, J. Plant Growth Regul., 2011, 30, 405 CrossRef CAS.
- F. Song, H. Su, N. Yang, L. Zhu, J. Cheng, L. Wang and X. Cheng, Food Chem., 2016, 210, 381–387 CrossRef CAS.
- V. Truffault, S. C. Fry, R. G. Stevens and H. Gautier, Plant J., 2017, 89, 996–1008 CrossRef CAS.
- V. A. Lombardo, S. Osorio, J. Borsani, M. A. Lauxmann, C. A. Bustamante, C. O. Budde, C. S. Andreo, M. V. Lara, A. R. Fernie and M. F. Drincovich, Plant Physiol., 2011, 157, 1696–1710 CrossRef CAS.
- A. Sorrequieta, G. Ferraro, S. B. Boggio and E. M. Valle, Amino Acids, 2010, 38, 1523–1532 CrossRef CAS.
- A. Kumar and A. K. Bachhawat, Curr. Sci., 2012, 102, 288–297 CAS.
- M. Takayama and H. Ezura, Front. Plant Sci., 2015, 6, 612 Search PubMed.
- A. A. Badejo, K. Wada, Y. Gao, T. Maruta, Y. Sawa, S. Shigeoka and T. Ishikawa, J. Exp. Bot., 2011, 63, 229–239 CrossRef.
- V. Locato, S. Cimini and L. D. Gara, Front. Plant Sci., 2013, 4, 152 Search PubMed.
- K. Ouyang, J. Li, H. Huang, Q. Que, P. Li and X. Chen, Biotechnol. Biotechnol. Equip., 2014, 28, 1008–1013 CrossRef.
- J. Zhang, D. Thomas, P. Suri and C. Yang, J. Biomol. Tech., 2011, 22, S28 Search PubMed.
- A. Sasson and T. P. Michael, Bioinformatics, 2010, 26, 849–850 CrossRef CAS.
- D. Campagna, F. Gasparini, N. Franchi, L. Manni and G. Valle, PLoS One, 2015, 10, e0137436 CrossRef.
- Y. Huang, B. Niu, Y. Gao, L. Fu and W. Li, Bioinformatics, 2010, 26, 680–682 CrossRef CAS.
- B. Buchfink, C. Xie and D. H. Huson, Nat. Methods, 2015, 12, 59 CrossRef CAS.
- M. Kanehisa, Y. Sato and K. Morishima, J. Mol. Biol., 2016, 428, 726–731 CrossRef CAS.
- X. Wang and L. Wang, Front. Plant Sci., 2016, 7, 1350 Search PubMed.
- B. Li and C. N. Dewey, BMC Bioinf., 2011, 12, 323 CrossRef CAS.
- K. J. Livak and T. D. Schmittgen, Methods, 2001, 25, 402–408 CrossRef CAS.
- S. Lim, J. G. Lee and E. J. Lee, Food Chem., 2017, 234, 81–92 CrossRef CAS.
- J. Chong, O. Soufan, C. Li and J. Xia, Nucleic Acids Res., 2018, 46, 486–494 CrossRef.
Footnote |
| † Electronic supplementary information (ESI) available. See DOI: 10.1039/d0ra01223h |
| This journal is © The Royal Society of Chemistry 2020 |