
 Open Access Article
 This Open Access Article is licensed under a Creative Commons Attribution-Non Commercial 3.0 Unported Licence
Molecular dynamics study of the frictional properties of multilayer MoS2
Chengzhi Hu *,
Changli Yi,
Minli Bai*,
Jizu Lv and
Dawei Tang
*,
Changli Yi,
Minli Bai*,
Jizu Lv and
Dawei Tang
Laboratory of Ocean Energy Utilization of Ministry of Education, School of Energy and Power Engineering, Dalian University of Technology, Dalian, 116024, China. E-mail: huchengzhi@dlut.edu.cn
First published on 5th May 2020
Abstract
To reveal the friction mechanism of molybdenum disulfide (MoS2), the frictional properties of multilayer MoS2 lubrication film were studied under variable loads and shearing velocities by the molecular dynamics (MD) method. The results showed irreversible deformation of MoS2 was caused by heavy load or high shear velocity during the friction process and the interlayer velocity changed from a linear to a ladder-like distribution; thus, the number of shear surfaces and the friction coefficient decreased. The low friction coefficient caused by heavy load or high velocity could be maintained with a decrease in load or velocity. For a solid MoS2 lubrication film, the number of shearing surfaces should be reduced as much as possible and the friction pair should be run under heavy load or high shear velocity for a period of time in advance; thus, it could exhibit excellent frictional properties under other conditions. The proposed friction mechanism provided theoretical guidance for experiments to further improve the frictional properties of MoS2.
1. Introduction
MoS2 is one of the two-dimensional materials, in addition to graphene, that has attracted considerable interest from scientists in recent years. It is a representative of the transition metal dichalcogenides (TMDs) with a Buck band gap of 1.2 eV (ref. 1) between layers that gives it unique and incomparable advantages in transistors,2 lubricants,3 flexible electronic components4,5 and other applications. It has a lamellar structure connected by only weak van der Waals forces6 and is easy to shear between layers. The sandwich structure of S–Mo–S within the layer and the more than 50 GPa (ref. 7) stiffness along its thickness direction render its excellent bearing capacity. The sulfur (S) atoms outside the layer have a strong adhesion to the metal substrate, thus effectively avoiding adhesion between the metal substrates. MoS2 exhibits excellent frictional properties as both a nano-additive in lubricant and a solid lubricant.6,8Compared with traditional fluid lubrication, solid lubrication has incomparable advantages under high velocity, heavy load, vacuum, high impact, extreme temperature and other conditions. MoS2 is the preferred material for vacuum mechanical lubrication because the lubricity and wear resistance of MoS2 in vacuum are better than in an atmospheric environment.9 Although solid lubricants do not have the fluidity of liquid lubricants, MoS2 can be transferred to the metal surface during the friction process and form a continuous film to cover the entire friction surface; thus, the shearing process only occurs between MoS2.3
Load is an important factor affecting the friction state. For liquid lubrication films, the reduction in oil film thickness and solidification of oil film under heavy load lead to a sharp increase in friction coefficient.10 By preparing MoS2/C composite film, Cai et al.11 showed a visible friction film between the friction pairs and reduction in the friction coefficient under heavy load. The magnitude of the shear velocity directly affected the temperature, deformation and even wear of the friction pair. Hu et al.12 showed that the lubrication mechanisms of nanoparticles were different at low or high shear velocities under boundary lubrication. Sun et al.13 showed that the greater the velocity, the greater the sliding distance of the friction surface and the less energy change of the entire system, with the friction force correspondingly reduced.
Owing to the special structure of MoS2, its composition features two kinds of chirality, armchair and zigzag, as shown in Fig. 1. Due to its intrinsic properties, pure MoS2 is easily oxidized in wet conditions. To improve the lubrication performance of MoS2 film, MoS2 composite films have been prepared by doping other elements.14,15 By preparing multilayer composite film and changing the growth direction of MoS2 film, the comprehensive properties of MoS2 composite film, such as compactness, oxidation resistance and anti-wear, were enhanced. The lubrication modification of MoS2 in the laboratory could only explain the lubrication properties from a macroscopic view and the specific lubrication process was difficult to observe due to limitations in the experiment. MoS2 is a nano lubricant with prominent lamellar structure and strong stiffness, but research on its anti-wear mechanism is not complete. In particular, the frictional properties of MoS2 under different conditions are still unclear, which means experimental research on the modification of MoS2 lubrication films lacks theoretical guidance.
 | ||
| Fig. 1 Atomic structure of single-layer MoS2. | ||
The MD method, based on Newton's laws, solves the equations of motion and simulates the basic path of atoms. The entire process of friction and displacement between atoms can be observed using the MD method and the properties of MoS2 seen in conventional experiments can be explained theoretically. Chen et al.16 pre-defined S atoms as the upper and lower substrates and filled large particles of MoS2 in the middle and the results showed that the nanoparticles changed from a sliding to rolling state. In addition to nanoparticles, Morita et al.3 filled irregular-block MoS2 between ferrum (Fe) substrates under a certain load and shear and a lamellar MoS2 friction film was formed with a minimum friction coefficient of less than 0.1 in a stable state. Lahouij et al.17 verified that the hollow structure of inorganic fullerene-like MoS2 was more prone to surface spalling under heavy load than the solid structure.
Most simulation studies have focused on the stretching process,18,19 thermal conductivity,20,21 the phase transition process22,23 and other aspects of single-layer MoS2, but few have considered the motion process and frictional property of multilayer MoS2 between the friction pairs. In this paper, the MD method was used to study the frictional properties of multilayer MoS2 under variable loads and shears and to explore the coupling effects of load and shear velocity on shear morphology. The main factors affecting the friction coefficient were clarified and the effects of load, shear velocity and shear morphology on the frictional properties were explored. Furthermore, the frictional mechanism of solid MoS2 lubrication film was proposed to provide theoretical guidance for improving the frictional properties of MoS2 lubrication film.
2. Model and simulation details
2.1 Model setup
The results of Morita et al.3 showed that when MoS2 is filled between Fe substrates as a lubricant, MoS2 layers adjacent to the upper and lower substrates are adhered to the surface of the substrate and hardly slide, indicating that shear occurred only within the MoS2 layer. In order to reduce the computational cost, the model was simplified to a lamellar structure with only MoS2 and the upper and lower layers of MoS2 replaced the empirical friction pair. The physical model is shown in Fig. 2. Layer 1 and Layer 5 were rigid layers, each consisting of a single-layer of MoS2, equivalent to the substrates. Layer 2, Layer 3, and Layer 4 represented free layers. The system was composed of 5 layers of MoS2 in total and shear could occur simultaneously between any two layers. Periodic boundaries were applied in the x and y directions and an aperiodic boundary was applied in the z direction. The size of the model was 101 Å × 97 Å × 30 Å. The load was added to Layer 1 and Layer 1 and Layer 5 slid in opposite directions with velocity ν. | ||
| Fig. 2 The physical model. | ||
2.2 Simulation details
In this paper, the Stillinger–Weber (SW) potential24 was chosen as the intra-layer potential. The SW potential contains two-body and three-body potentials between atoms, which are expressed as
 | (1) |
 | (2) |
 | (3) |
Because the SW potential only describes the potential of single-layer MoS2, the potential of Mo–Mo, S–S and Mo–S between layers was represented by the Lennard-Jones (L-J) potential as in the work of Ding et al.25 The L-J potential is a typical non-bonded pair potential, expressed as
 | (4) |
| Atom | ε/eV | σ/Å |
|---|---|---|
| Mo–S | 0.02489 | 3.157 |
| S–S | 0.01187 | 3.595 |
| Mo–Mo | 0.00243 | 2.719 |
To study the frictional properties of multilayer MoS2, the canonical ensemble (NVT, where the number of particles N, volume V, and temperature T of the system are constant) was used to simulate the free layers of Layer 2, Layer 3 and Layer 4 and the Nose–Hoover thermostat method26 was used to maintain the system temperature at 300 K. For rigid Layer 1 and Layer 5, the micro-canonical ensemble (NVE, where the number of particles N, volume V, and energy E of the system are constant) was used. The system was fully relaxed for 200 ps after the energy minimization stage, then load P was gradually added to Layer 1 and the system was relaxed again for 200 ps. Finally, opposite velocities ν were applied to both Layer 1 and Layer 5 and the relevant data were obtained after the system was stabilized. The cutoff distance was 12 Å and the time step was 0.002 ps.
3. Results and discussion
Load and shear velocity are two important parameters affecting the friction coefficient. In this paper, the lateral force along the shearing direction of Layer 1 was taken as the friction force and the ratio of it to the load applied along the z direction was the friction coefficient Fx/Fz. The default shearing direction was the armchair configuration.3.1 Effects of load on frictional properties
To study the effects of load on the friction coefficient, Layer 1 and Layer 5 were controlled to slide in opposite directions at a velocity of 20 m s−1 and the range of the load was 0.1–5.0 GPa. According to Fig. 3(a), as the load increased, the friction coefficient decreased rapidly and fell below 0.1 at a load of 1.0 GPa. As load increased further, the rate of reduction of the friction coefficient slowed and the friction coefficient remained at a low value. This indicates that the solid MoS2 lubrication film formed a better lubrication environment on the surface of the friction pair under higher load and the friction coefficient was effectively reduced. | ||
| Fig. 3 Effects of (a) constant load and (b) variable loads on the friction coefficient at ν = 20 m s−1. | ||
Considering that most friction pairs are under variable loads, loads of 1.5 GPa, 4.0 GPa and 5.0 GPa were applied to Layer 1 during 0–2.0 ns and then the load was reduced to 0.5 GPa in a short time and the simulation was continued for 2 ns. Meanwhile, the opposite shear velocities of Layer 1 and Layer 5 were controlled at 20 m s−1 during the entire process. The effects of the variable loads on the friction coefficient are shown in Fig. 3(b). The friction coefficient and fluctuation amplitude decreased with the increasing load at times less than 2.0 ns. At 0.25–1.25 ns, when the load was 4.0 GPa or 5.0 GPa, a sharp drop in the friction coefficient could be observed and the friction coefficient remained at a lower level after. Note that when the load was reduced from heavy (P ≥ 4.0 GPa) to 0.5 GPa, the friction coefficient increased, but it was prominently lower than that under a constant load of 0.5 GPa and the max drop was about 82%. In contrast, when the load was reduced from 1.5 GPa to 0.5 GPa, the friction coefficient increased prominently and was similar to that under the constant load of 0.5 GPa. It could be inferred that under the action of heavy load, the structure of the friction system had undergone some changes (detailed in Section 3.3) and these changes remained after unloading and the system maintained a lower friction coefficient when it was converted to a light load; however, this was not the case when the system was always under light load. Therefore, a method of reducing friction could be proposed: under the premise of ensuring normal operation of the lubrication system, the solid MoS2 lubrication system should be run in under heavy load for a period of time in advance for the system to reach the optimal state as soon as possible.
Note that the load was changed from heavy to light to study the frictional properties of multilayer MoS2 under the condition of variable loads to analyze whether the low friction coefficient under heavy load could appear under the condition of light load. The time between heavy load to light had no significant effect on the simulation results. The same is true when the shear velocity changes from high to low.
3.2 Effects of shear velocity on frictional properties
To avoid intra-layer deformation caused by excessive load (P > 4.0 GPa), the effects of shear velocities on the friction coefficient were studied when the load was 0.5 GPa, 1.0 GPa and 1.5 GPa. Critical velocities existed in all loads and they were 70 m s−1, 50 m s−1 and 40 m s−1, respectively, as shown in Fig. 4(a). When the shear velocity was lower than the critical velocity, the friction coefficient under heavy load was prominently lower than that under light load. However, when the shear velocities were greater than the critical velocities, the friction coefficients under the three loads were similar. A sharp drop of the friction coefficient could be observed when the shear velocity was greater than the critical velocity. Examining the structure of MoS2, the intermediate layer was deformed, which might be the reason the system exhibited a stage of low friction coefficient at high shear velocity. The effects of deformation within MoS2 on the friction state will be detailed in Section 3.3. | ||
| Fig. 4 Effects of (a) constant and (b) variable shear velocities on the friction coefficient. | ||
Considering that most friction pairs are at variable velocities, we also studied the friction coefficient when the system changed from high to low velocities with the load controlled at 0.5 GPa for the entire process, as shown in Fig. 4(b). When the shear velocity ν = 50 m s−1, the friction coefficient was about 0.13. The friction coefficient decreased to 0.11 as the shear velocity decreased to 20 m s−1, which was the same as seen in Fig. 4(a). The friction coefficients decreased sharply during the initial stage (T < 1.2 ns) at high shear velocities (ν = 100 m s−1, 150 m s−1). Moreover, when the shear velocities decreased to 20 m s−1 (T > 2.0 ns), the friction coefficients did not rebound and remained at a low level, which was prominently lower than that at the constant shear velocity of 20 m s−1. This indicates that the deformation within the layer caused by the high shear velocity could be maintained after the shear velocity decreased; the friction coefficient could still be maintained at a low value at low shear velocity. Based on the results of this section, this paper proposes a second method to improve the lubrication performance of solid MoS2 lubrication film: the lubrication system should be run in under a high shear velocity for a period of time in advance, then the shear velocity should be gradually reduced to the expected value.
3.3 Effect of shear morphology on frictional properties
It was shown in Section 3.1 that the friction coefficient dropped suddenly under high load (P > 4.0 GPa) and a sudden drop of friction coefficient was also observed in Section 3.2. The reason for the above phenomena was the structural deformation of MoS2 within the layer.Taking the conditions of P = 1.0 GPa and ν = 70 m s−1 as an example, the deformation within the layer during the shear process is shown in Fig. 5. Layer 2 was partially deformed and the atomic distribution on the surface of S changed from hexagonal to pentagonal (red atoms in the figure). The sandwich structure of S–Mo–S was no longer maintained and Mo atoms were divided into two parts along the z-axis direction and arranged alternately with the S atoms at both sides, as shown in Fig. 5(c) and (d). The direct effect of the deformation was that the friction coefficient dropped suddenly by 0.056 (in a time span less than 0.2 ns), as shown in Fig. 6. Meanwhile, the potential of Layer 2 and the force between adjacent layers along the shear direction also dropped abruptly and the distribution of interlayer velocity was thus changed. It is clear that the deformation of Layer 2 directly led to the decrease in potential which affected the force between adjacent layers of MoS2 and ultimately led to the change of interlayer velocity and the decrease in friction coefficient.
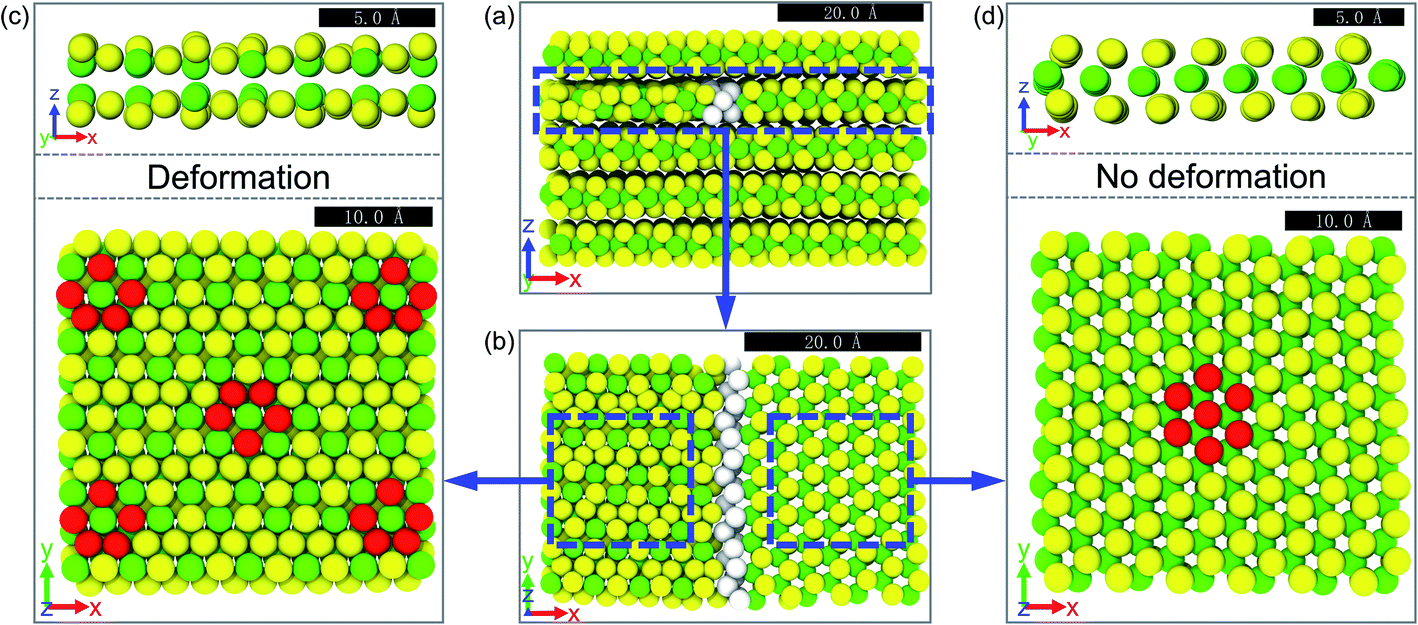 | ||
| Fig. 5 The enlarged detail of deformation at P = 1.0 GPa and ν = 70 m s−1. (a and b) are bounded by white atoms; the structure of the left layer was deformed and that of the right was not. (c and d) are the details of (b) from different perspectives and some S atoms were marked red to show the distribution characteristics of surface atoms more clearly. All blue dashes and arrows in the figure are for identification only and the black rectangles represent different sizes. | ||
 | ||
| Fig. 6 Effects of deformation on the friction system at P = 1.0 GPa and ν = 70 m s−1. The abscissa is the time of the shear process and the ordinates are, from top to bottom, the friction coefficient, the velocity distribution, the force between layers along the shear direction, and the potential in the layer. The gray filled area indicated that the deformation occurred during this period. | ||
Note that as the load and velocity increase, deformation may occur in any one or more layers of Layer 2, Layer 3 and Layer 4. Due to limitations on the length of this paper, the velocity and force distribution under each load are not given, but the effects of deformation on the velocity distribution and force are similar. Fig. 6, 9 and 12 show the velocity distributions of typical simulation examples. In this paper, shear morphology is defined as the shear properties of solid lubrication materials between friction pairs under a certain load and shear and it features the distribution of velocity and the number of shear surfaces between layers. The next part will analyse the factors that affect the structural deformation within the layer to further reveal the changing shear morphology of solid MoS2 lubrication film.
The shear morphology of multilayer MoS2 varied with load at the same velocity, as shown in Fig. 7. For convenience in observation, atoms of 40 Å < x < 60 Å were marked in red or white. Fig. 7(a) shows the initial state when no load or shear was applied. At the initial moment, the shear occurred in each layer and there were four shear surfaces in total; the S–Mo–S structure was also maintained well during this period, as shown in Fig. 7(b). When the shear velocity remained unchanged (ν = 20 m s−1) and the load was less than 4.0 GPa, the shear state could be maintained for a long time. When the load P ≥ 4.0 GPa, the intermediate layers of MoS2 (Layer 2, Layer 3) were deformed and no longer conformed to the sandwich structure of S–Mo–S. At this time, the shear occurred only between the deformed layer and its adjacent upper and lower layers and there were two shear surfaces in total, as shown in Fig. 7(c) and (d). Note that after the deformation occurred, it could not be recovered even if the load was reduced. This indicates the failure of structure was an irreversible process and could not be recovered with unloading and the friction coefficient remained at a low value, which is consistent with what is shown in Fig. 3(b).
 | ||
| Fig. 7 Effects of load on shear morphology. (a) The initial morphology, (b) the morphology at P < 4.0 GPa and ν = 20 m s−1, (c) the deformation of Layer 2 at P = 4.0 GPa and ν = 20 m s−1, and (d) the deformation of Layer 4 at P = 5.0 GPa and ν = 20 m s−1. For convenience of observation, atoms of 40 Å < x<60 å were marked with different colors. White indicates the structure is intact and red indicates the structure has been deformed. The black rectangles represent 50 Å. | ||
The shear morphology of multilayer MoS2 varied with shear velocity under the same load, as shown in Fig. 8. According to Fig. 4(a), the critical velocity under a load of 1.0 GPa was 50 m s−1. When the shear velocity was less than the critical velocity, the intra-layer structure of MoS2 was maintained and there were four shear surfaces in total. When the velocity was greater than the critical velocity, the MoS2 intermediate layers (Layer 2, Layer 3, and Layer 4) were respectively structurally deformed, the shear occurred only between the deformation layer and its adjacent upper and lower layers, and there were two shear surfaces in total, as shown in Fig. 8(b)–(d). Similar to the deformation caused by heavy load, the structural failure was irreversible and could not be recovered with a decrease of shear velocity and the friction coefficient remained at a low value, which is consistent with what is shown in Fig. 4(b).
 | ||
| Fig. 8 Effects of shear velocity on shear morphology. (a) The morphology at P = 1.0 GPa and ν ≤ 50 m s−1, (b) the deformation of Layer 3 at P = 1.0 GPa and ν = 60 m s−1, (c) the deformation of Layer 4 at P = 1.0 GPa and ν = 80 m s−1, and (d) the deformation of Layer 2 at P = 1.0 GPa and ν = 100 m s−1. For convenience of observation, atoms of 40 Å < x < 60 Å were marked with different colors. White indicates the structure is intact and red indicates the structure has been deformed. The black rectangles represent 50 Å. | ||
Therefore, regardless of heavy load or high shear velocity, the shear morphology transformation was reflected in the irreversible deformation within the layer and a reduction in the number of shear surfaces. The effects of shear morphology on the distribution of interlayer velocity are shown in Fig. 9. Before the shear morphology was transformed, the closer to the top layer, the greater the velocity was, and the interlayer velocity showed a linear distribution. Taking the conditions of P = 1.0 GPa and ν = 60 m s−1 as an example, the deformation within Layer 3 caused the velocities of Layer 2 and Layer 4 to sharply increase and decrease, respectively, and Layer 2 and Layer 4 slid together with Layer 1 and Layer 5, respectively. According to the distribution of interlayer velocity, it was clear that shear only occurred between Layer 2 and Layer 3 and between Layer 3 and Layer 4; thus, the number of shear surfaces was reduced from four to two after deformation. When Layer 4 (P = 1.0 GPa, ν = 80 m s−1) or Layer 2 (P = 1.0 GPa, ν = 100 m s−1) was deformed, there was an observable velocity difference between the deformed layer and its two adjacent layers and the velocities of the undeformed parts on both sides remained similar. This indicates that the transformation of shear morphology led to a prominent velocity difference between the deformed layer and its two adjacent layers and the interlayer velocity changed from a linear to a ladder-like distribution.
 | ||
| Fig. 9 Effects of shear morphology on distribution of interlayer velocity. | ||
Heavy load and high shear velocity are two causes of the irreversible deformation of multilayer MoS2 during the shearing process. To explore the coupling effects of load and shear velocity on shear morphology, Fig. 10 shows the friction coefficients under different loads and shear velocities, with red representing irreversible deformation within the layer. The shear velocity ranged from 10 m s−e edν ≤ 200 m s−1 and the load ranged from 0.1GPa ≤ P ≤ 1.5 GPa. When the shear velocity was less than 50 m s−1, the structure was maintained even if the load reached a maximum value of 1.5 GPa. As the shear velocity increased, the critical load corresponding to structural deformation decreased. For example, the critical load was 1.0 GPa when the shear velocity was 50 m s−1, then it gradually decreased to 0.5 GPa when the velocity was 70 m s−1. When the shear velocity reached 100 m s−1, the structure was deformed as soon as the load was greater than 0.1 GPa. This indicates that there is a mutually beneficial relationship between the critical load and the critical velocity: when the critical load is heavy, the critical velocity is low and when the critical velocity is high, the critical load is light. Once the critical load or critical velocity was reached, the structure of MoS2 deformed and the shear morphology was transformed accordingly.
 | ||
| Fig. 10 The coupling effects of load and shear velocity on shear morphology. | ||
Effects of load and shear velocity on shear morphology are shown in Fig. 7 and 8, indicating that when shear velocity exceeded the critical velocity or load exceeded the critical load, the internal structure underwent irreversible deformation. However, the above conditions were all in the vicinity of critical velocity or critical load and there is a relationship between critical velocity and critical load; thus, it is necessary to explore the effects of high shear velocity and heavy load on the shearing process, as shown in Fig. 11. When the velocity far exceeded the critical velocity, irreversible deformation occured in Layer 3 and Layer 4 or Layer 2 and Layer 3 simultaneously (as shown in Fig. 11(b) and (c)). When the velocity and load both far exceeded the corresponding critical velocity and critical load, such as when P = 4.0 GPa and ν = 200 m s−1, Layer 2, Layer 3 and Layer 4 underwent irreversible deformation at the same time. Regardless of whether the deformed layer is a single-layer or multilayers, the common characteristic was that the shear occurred between the deformed layer and its adjacent upper and lower layers and the number of shearing surfaces reduced from four to two.
 | ||
| Fig. 11 Effects of heavy load and high shear velocity on shear morphology. (a) The morphology without deformation, (b) the deformation of Layer 3 and Layer 4 at P = 1.0 GPa and ν = 150 m s−1, (c) the deformation of Layer 2 and Layer 3 at P = 1.0 GPa and ν = 200 m s−1, and (d) the deformation of Layer 2, Layer 3 and Layer 4 at P = 4.0 GPa and ν = 200 m s−1. For convenience of observation, atoms of 40 Å < x < 60 Å were marked with different colors. White indicates the structure is intact and red indicates the structure has been deformed. The black rectangles represent 50 Å. | ||
According to Fig. 9, the deformation of single-layer MoS2 led to transformation of shear morphology and resulted in a prominent velocity difference between the deformation layer and its adjacent layers. The same phenomenon was observed after the shear morphology transformation caused by the deformation of multilayer MoS2, as shown in Fig. 12. Taking the condition when P = 1.0 GPa and ν = 150 m s−1 as an example, the transformation of the shear morphology was divided into two steps. The first step was the deformation of Layer 3, for which the shear morphology can be seen in Fig. 8(b) and the distribution of interlayer velocity was similar to when P = 1.0 GPa and ν = 70 m s−1. The second step was the deformation of Layer 4, making two layers of MoS2 deformed in total, with Layer 3 and Layer 4 similar in velocity; thus, shear occurred between Layer 2 and Layer 3 and between Layer 4 and Layer 5. Similarly, when the load was 1.0 GPa and the shear velocity increased to 200 m s−1, Layer 3 and Layer 2 were successively deformed and the shear occurred both between Layers 1 and 2 and between Layers 3 and 4. When the velocity and load far exceeded the corresponding critical velocity and critical load (P = 4.0 GPa, ν = 200 m s−1), three layers of MoS2 were deformed and the velocities of Layer 2, Layer 3 and Layer 4 were basically the same. The above results show that the deformation of MoS2 led to the transformation of shear morphology regardless of the number of deformation layers, interlayer velocity changed from a linear to a ladder-like distribution and there was a prominent velocity difference between the deformation layer and its adjacent layers.
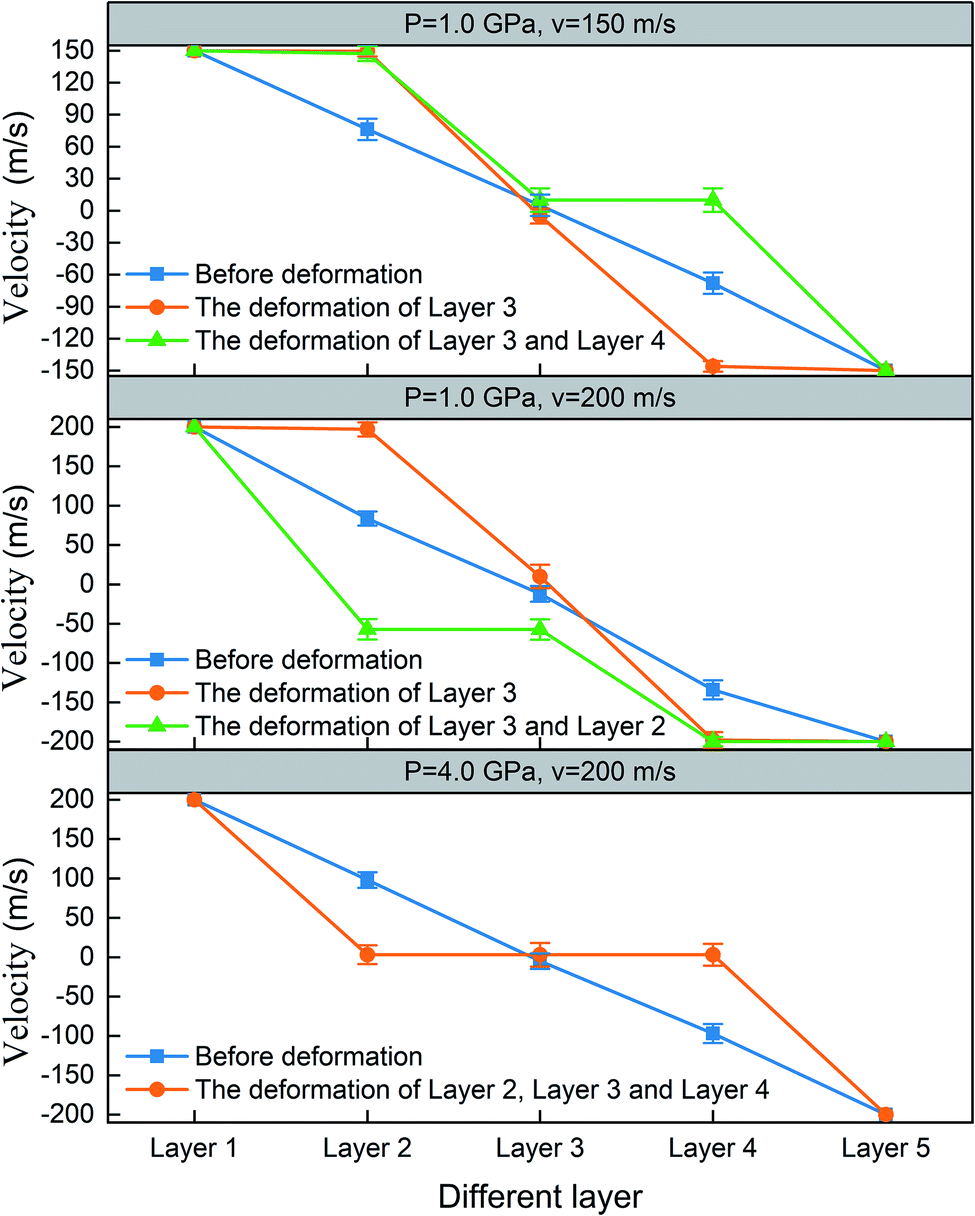 | ||
| Fig. 12 Effects of deformation of multilayer MoS2 on the distribution of interlayer velocity. | ||
Fig. 13 shows the effects of shear morphology on the friction coefficient. For example, when P = 1.0 GPa and ν = 150 m s−1, in the initial stage of shearing (0.1–0.4 ns), the friction coefficient fluctuated around 0.093 and the shear occurred in each layer, corresponding to the shear morphology of Fig. 11(a) or Fig. 8(a). The first shaded part in Fig. 13(a) shows the deformation of Layer 3. During this stage, the shear morphology transformed with a sudden drop of friction coefficient (ΔCOF = 0.053). The second shaded part in Fig. 13(a) indicates that Layer 4 deformed during this stage and the friction coefficient was further lowered (ΔCOF = 0.015). After these two steps, the friction coefficient maintained a low level for a long time, corresponding to the shear morphology of Fig. 11(b). When the shear velocity and load far exceeded the critical velocity and critical load, the friction coefficient dropped three times with time, representing the successive deformations of three layers of MoS2, as shown in Fig. 13(c).
 | ||
| Fig. 13 Effects of shear morphology on the friction coefficient at (a) P = 1.0 GPa and ν = 150 m s−1, (b) P = 1.0 GPa and ν = 200 m s−1, and (c) P = 4.0 GPa and ν = 200 m s−1. | ||
This shows that the deformation of MoS2 changed the interlayer velocity from a linear to a ladder-like distribution and reduced the number of shear surfaces, thus reducing the friction coefficient of the system. The specific frictional law is as follows: the fewer shear surfaces exist, the lower the friction coefficient. Therefore, a mechanism for reducing friction could be proposed: for the solid MoS2 lubrication film, the number of shear surfaces between the friction pairs should be reduced as much as possible, which is consistent with the theory of enhancing the adhesion between layers of MoS2 film to improve the anti-wear property and reduce the friction coefficient in the laboratory.
Note that, regardless of the number of layers, structural deformation and sudden drop of friction coefficient existed under heavy load or high shear velocity. The above rules are applicable to cases where the number of layers is greater than or less than 5 layers; in view of calculation cost, this paper selected 5 layers.
4. Conclusion
The molecular dynamics method was used to study the frictional properties of multilayer MoS2 under variable loads, velocities and shear morphologies and to explore the coupling effects of load and shear velocity on shear morphology. The results showed that MoS2 is more suitable for solid lubrication under heavy load and high shear velocity. There is a mutually promoting relationship between the critical load and the critical velocity: once the critical load or critical velocity is reached, the structure of MoS2 is deformed and the shear morphology transforms accordingly. The transformation of the shear morphology leads to a prominent velocity difference between the deformation layer and its adjacent layers and the interlayer velocity changes from a linear to a ladder-like distribution; thus, the number of shear surfaces is reduced from four to two. The deformation within the layer directly leads to the decrease in potential that affects the force between adjacent layers and ultimately leads to the decrease in friction coefficient. The low friction coefficient was maintained even when the load or shear velocity was reduced. For a lubrication system using solid MoS2, the entire system could obtain better lubrication performance if it was run in under heavy load and high shear velocity in advance. The frictional mechanism proposed in this paper provides a microscopic basis for increasing the adhesion force between MoS2 layers and reducing the friction coefficient.Conflicts of interest
There are no conflicts to declare.Acknowledgements
This work is supported by National Natural Science Foundation of China (Grant No. 51806028 and 51876027) and the Fundamental Research Funds for the Central Universities (DUT19JC09).References
- K. F. Mak, C. Lee, J. Hone, J. Shan and T. F. Heinz, Phys. Rev. Lett., 2010, 105, 136805 CrossRef PubMed.
- B. Radisavljevic, A. Radenovic, J. Brivio, V. Giacometti and A. Kis, Nat. Nanotechnol., 2011, 6, 147–150 CrossRef CAS PubMed.
- Y. Morita, T. Onodera, A. Suzuki, R. Sahnoun, M. Koyama and H. Tsuboi, Appl. Surf. Sci., 2008, 254, 7618–7621 CrossRef CAS.
- C. Ataca, H. Ahin, E. Aktürk and S. Ciraci, J. Phys. Chem. C, 2011, 115, 3934–3941 CrossRef CAS.
- Y. Li, Z. Zhou, S. Zhang and Z. Chen, J. Am. Chem. Soc., 2008, 130, 16739–16744 CrossRef CAS PubMed.
- P. D. Fleischauer, Thin Solid Films, 1987, 154, 309–322 CrossRef CAS.
- N. Ghobadi, 2017 Iranian Conference on Electrical Engineering, 2017, pp. 334–338 Search PubMed.
- Z. Y. Xu, K. H. Hu, C. L. Han, X. G. Hu and Y. F. Xu, Tribol. Lett., 2013, 49, 513–524 CrossRef CAS.
- V. R. Johnson and G. W. Vaughn, J. Appl. Phys., 1956, 27, 1173–1179 CrossRef.
- C. Hu, M. Bai, J. Lv, P. Wang and X. Li, Tribol. Int., 2014, 78, 152–159 CrossRef.
- S. Cai, P. Guo, J. Liu, D. Zhang, P. Ke and A. Wang, Tribol. Lett., 2017, 65, 79 CrossRef.
- C. Hu, M. Bai, J. Lv, H. Liu and X. Li, Appl. Surf. Sci., 2014, 321, 302–309 CrossRef CAS.
- F. Sun, Y. Hou, L. Wang, L. Huang and Z. Qian, Int. J. Pavement Res. Technol., 2017, 10, 343–351 CrossRef.
- H. Singh, K. C. Mutyala, H. Mohseni, T. W. Scharf, R. D. Evans and G. L. Doll, Tribol. Trans., 2015, 58, 767–777 CrossRef CAS.
- X. Z. Ding, X. T. Zeng, X. Y. He and Z. Chen, Surf. Coat. Technol., 2010, 205, 224–231 CrossRef CAS.
- C. S. Chen, H. J. Cian, C. H. Yu and C. W. Huang, Procedia Eng., 2014, 79, 617–621 CrossRef CAS.
- I. Lahouij, E. W. Bucholz, B. Vacher, S. B. Sinnott, J. M. Martin and F. Dassenoy, Nanotechnology, 2012, 23, 375701 CrossRef CAS PubMed.
- S. Xiong and G. Cao, Nanotechnology, 2015, 26, 185705 CrossRef PubMed.
- J. Zhao, J. W. Jiang and T. Rabczuk, Appl. Phys. Lett., 2013, 103, 231913 CrossRef.
- H. Farahani, A. Rajabpour, M. Khanaki and A. Reyhani, Comput. Mater. Sci., 2018, 142, 1–6 CrossRef CAS.
- L. M. Sandonas, R. Gutierrez, A. Dianat and G. Cuniberti, RSC Adv., 2015, 5, 54345–54351 RSC.
- K. Q. Dang, J. P. Simpson and D. E. Spearot, Scr. Mater., 2014, 76, 41–44 CrossRef CAS.
- J. W. Jiang and H. S. Park, Appl. Phys. Lett., 2014, 105, 33108 CrossRef.
- J. W. Jiang, H. S. Park and T. Rabczuk, J. Appl. Phys., 2013, 114, 64307 CrossRef.
- Z. Ding, Q. X. Pei, J. W. Jiang, W. Huang and Y. W. Zhang, Carbon, 2016, 96, 888–896 CrossRef CAS.
- W. G. Hoover, Phys. Rev. A, 1985, 31, 1695–1697 CrossRef PubMed.
| This journal is © The Royal Society of Chemistry 2020 |