 Open Access Article
Sonochemical synthesis of polyoxometalate-stabilized gold nanoparticles for point-of-care determination of acetaminophen levels: preclinical study in an animal model†
Tahereh Rohani Bastami *ab,
Abolphazl Ghaedic,
Scott G. Mitchell
 d,
Aida Javadian-Sarafe and
Mohammad Karimif
aDepartment of Chemical Engineering, Quchan University of Technology, Quchan 94771-67335, Iran. E-mail: t.rohani@qiet.ac.ir; tahereh.rohani@gmail.com
bResearch and Technology Center of Biomolecules, Faculty of Science, Ferdowsi University of Mashhad, Mashhad, 9177948974, Iran
cDepartment of Chemical Engineering, Quchan University of Technology, Quchan 94771-67335, Iran
dInstituto de Ciencia de Materiales de Aragón (ICMA), Consejo Superior de Investigaciones Científicas (CSIC)-Universidad de Zaragoza and CIBER-BBN, C/Pedro Cerbuna 12, 50009 Zaragoza, Spain
eSchool of Engineering, University of British Columbia, Kelowna, BC V1V 1V7, Canada
fDepartment of Emergency Medicine, Faculty of Medicine, Ahvaz Jundishapur University, Ahvaz, Iran
First published on 29th April 2020
Abstract
The aim of this study is the accurate and rapid detection of acetaminophen (AP) for point-of-care (POC) clinical diagnosis. Acetaminophen overdose causes acute liver failure and currently there is a lack of rapid quantitative detection methods for this drug in the emergency room. Here, low-frequency sonication (20 kHz) in the presence of phosphomolybdic acid (PMo12) was used to reduce Au3+ to Au0 and stabilize the resulting spherical Au0 nanoparticles (herein AuNPs). These AuNPs@PMo12 were used as nano-probes for the selective detection of acetaminophen in the presence of other commercial drugs. The optical sensing method we describe is based on the aggregation of AuNPs@PMo12 in the presence of acetaminophen, which produces a red-shift in the absorption spectrum of the AuNPs@PMo12, which is characterised by a color change from red to purple that is visible to the naked eye. Furthermore, the quantitative determination of acetaminophen concentrations can be carried out using the eyedropper function in Microsoft's PowerPoint or open access ImageJ software, using RGB (red, green, and blue) values. To prove the feasibility of this novel nanosensor, the concentration of acetaminophen was measured in over-the-counter pharmaceutical tablets and in serum samples taken from mice. This simple sensing approach offers high stability, selectivity, rapid detection time, and cost saving compared to other detection methods, which therefore opens the way for the development of quantitative POC acetaminophen detection using polyoxometalate-stabilized metal nanoparticles.
Introduction
Acetaminophen (AP), also known as paracetamol, is one of the most commonly used medicinal compounds in the world.1 According to the Food and Drug Administration (FDA) guidelines, taking up to 4 grams of AP per 24 hours is safe.2 Although the toxic dose of the drug that can cause liver failure is usually greater than 15 grams in a single dose, studies have reported that lower doses may also cause acute liver injury and liver failure.3 The only clinically effective antidote against AP-induced liver injury is NAC (N-acetylcysteine), which has the greatest effect when administered within the first 8 hours after overdose.4 Currently, the Rumack–Matthew nomogram (plot of serum AP concentration vs. time after acute ingestion) is used to determine patients who require NAC and patients who have serum AP levels below the treatment line will not need treatment.5This study aimed to develop a sensitive, rapid, low cost, and green nanosensor for the quantitative determination of toxic levels of AP in blood serum in the early hours after ingestion. Recently, the detection of AP has received much attention from the analytical chemistry field where a variety of analytical methods have been developed, including titrimetric methods,6 high-performance liquid chromatography (HPLC),7 spectrophotometry,8 chemiluminescence,9 and electrochemical analysis.10 One promising technology for clinical and personalized point-of-care (POC) diagnostics is colorimetric sensing of target analytes. Because of their unique optical properties, plasmonic nanomaterials, such as gold nanoparticles (AuNPs) have been introduced into colorimetric sensing systems to provide high selectivity and sensitivity in different biosensing applications.11,12
Polyoxometalates (POMs) are an important class of inorganic compounds that are well-known due to the broad range of applications in biochemistry13 and sensing.14 They can be applied as both reducing and stabilizing agents in aqueous solutions at room temperature.15 Furthermore, the ability of the multi-electron redox reaction of POMs make them particularly useful for the synthesis of noble metal nanoparticles.16–18
In recent years, it has become increasingly clear that there is a critical need for green-chemistry-type synthetic routes to new materials.19 In 2009, Zhang et al.20 introduced the one-pot, aqueous preparation of AuNPs with mixed-valence polyoxometalates. Liu et al.21 presented the method to synthesize AuNP@POM composites on graphene. To improve the electrocatalytic activities electrodes for the reduction of H2O2, Suo et al.22 synthesized core–shell POM-stabilized AuNPs as part of a composite assembly with graphene oxide.
To date, the most common technique used to obtain POM-stabilized metal(0) NPs involves using UV irradiation.23 However, few studies have investigated alternative approaches for the reduction of the metal precursor. Sonochemistry has emerged as one of the more promising and scalable methods to obtain metal NPs,24 whereby the chemical effects of ultrasonic irradiation can be tailored due to the acoustic cavitation phenomenon. When the liquid is exposed to ultrasonic irradiation, air bubbles are generated and then collapse, leading to the release of the ultrasonic energy during a very short time. The extremely high local temperature (>5000 K), pressure (>20 MPa) and very high cooling rates (>1010 K s−1) are suitable conditions for reducing metal ions and polyoxometalates.25–27
The present research explores, for the first time, the eco-friendly and practical synthesis of polyoxometalate-stabilized gold nanoparticles (AuNPs@PMo12) using ultrasonication. Sono-synthesized samples were kept at room temperature and remained stable for more than three months. The synthesized AuNPs@PMo12 were used as optical nanosensors for the highly selective naked-eye detection and quantitative determination of acetaminophen (AP). Our results show that AP molecules induced a strong and selective aggregation of the AuNPs@PMo12 which can be detected by naked eye and verified by conventional UV-vis spectroscopy. It is worth mentioning that a combination of quantitative and qualitative approaches was used in this research project. To achieve the optimization of the AuNPs@PMo12 nano-hybrids for sensing application, acoustic intensity, reaction temperature, and Au![[thin space (1/6-em)]](https://www.rsc.org/images/entities/char_2009.gif) :
:![[thin space (1/6-em)]](https://www.rsc.org/images/entities/char_2009.gif) POM ratios were investigated. This project provided an important opportunity to advance the understanding of the detection of AP in mice serum by using AuNPs@PMo12 nano-hybrids.
POM ratios were investigated. This project provided an important opportunity to advance the understanding of the detection of AP in mice serum by using AuNPs@PMo12 nano-hybrids.
Experimental
Materials
All reagents were purchased and used without further purification. Phosphomolybdic acid, H3PMo12O40, (PMo12), sodium hydroxide and hydrochloric acid (37%) were purchased from Merck Company and were used without further treatment. 1-Propanol (C3H7OH), was purchased from Sigma-Aldrich. HAuCl4 solution (0.1 M, 3.4% w/v) was freshly purchased from Kimia next Company, Iran. Acetaminophen (C8H9NO2), methadone (C21H27NO), methylphenidate (C14H19NO2), and tramadol (C16H25NO2) were obtained from Temad Pharmaceutical Company in Iran. The physicochemical properties of AP are shown in Table S1†.28 Mili-Q water was used with minimum resistivity of 18.2 MΩ cm−1.Ultrasonication synthesis of AuNPs@PMo12 nano-hybrid (US method)
The ultrasonic synthesis (US method) of AuNPs@PMo12 was carried out using ultrasonic equipment at various temperatures for 30 min with different ratios of Au![[thin space (1/6-em)]](https://www.rsc.org/images/entities/char_2009.gif) :
:![[thin space (1/6-em)]](https://www.rsc.org/images/entities/char_2009.gif) POM (1
POM (1![[thin space (1/6-em)]](https://www.rsc.org/images/entities/char_2009.gif) :
:![[thin space (1/6-em)]](https://www.rsc.org/images/entities/char_2009.gif) 2, 1
2, 1![[thin space (1/6-em)]](https://www.rsc.org/images/entities/char_2009.gif) :
:![[thin space (1/6-em)]](https://www.rsc.org/images/entities/char_2009.gif) 1, 2
1, 2![[thin space (1/6-em)]](https://www.rsc.org/images/entities/char_2009.gif) :
:![[thin space (1/6-em)]](https://www.rsc.org/images/entities/char_2009.gif) 1). In this experiment, the effect of acoustic intensity, Au
1). In this experiment, the effect of acoustic intensity, Au![[thin space (1/6-em)]](https://www.rsc.org/images/entities/char_2009.gif) :
:![[thin space (1/6-em)]](https://www.rsc.org/images/entities/char_2009.gif) POM ratio, and reaction temperature on colorimetric detection of AP have been investigated. The resulting liquid in every synthesis was ready for the characterization and detection of AP. The synthesis process was as follows: Briefly, 16.5 mL of 1 mM HAuCl4 solution was added to 33 mL of 1 mM PMo12 and stirred at room temperature. After magnetic stirring, the resulting solution poured into 100 mL Dewar cell, and 1.2 mL of propanol added into this solution. The resulting solution was exposed to ultrasonication through an ultrasonic horn (20 kHz, Branson Digital Sonifier-USA, W-450 D). Various acoustic amplitudes (40%, 50%, and 60%) were used to provide different acoustic power of 20 W, 25 W, and 29 W, respectively. After sono-reaction, the aqueous solution turned wine red, indicating gold nanoparticle formation. Finally, the prepared AuNPs@PMo12 nano-hybrid was kept at room temperature and remained stable for more than three months.
POM ratio, and reaction temperature on colorimetric detection of AP have been investigated. The resulting liquid in every synthesis was ready for the characterization and detection of AP. The synthesis process was as follows: Briefly, 16.5 mL of 1 mM HAuCl4 solution was added to 33 mL of 1 mM PMo12 and stirred at room temperature. After magnetic stirring, the resulting solution poured into 100 mL Dewar cell, and 1.2 mL of propanol added into this solution. The resulting solution was exposed to ultrasonication through an ultrasonic horn (20 kHz, Branson Digital Sonifier-USA, W-450 D). Various acoustic amplitudes (40%, 50%, and 60%) were used to provide different acoustic power of 20 W, 25 W, and 29 W, respectively. After sono-reaction, the aqueous solution turned wine red, indicating gold nanoparticle formation. Finally, the prepared AuNPs@PMo12 nano-hybrid was kept at room temperature and remained stable for more than three months.
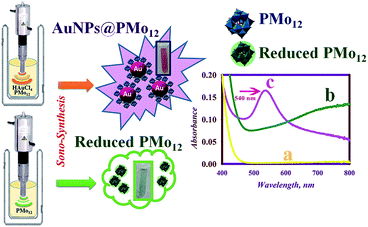
One reaction was conducted as follows to determine the effect of ultrasonic irradiation on the reduction of PMo12: 33 mL of 1 mM PMo12 solution was added to 16.5 mL of distilled water and stirred at room temperature. After magnetic stirring, the resulting solution poured into 100 mL Dewar cell, and 1.2 mL of propanol added into the solution. This solution was sonicated using an ultrasonic horn (20 kHz, Branson Digital Sonifier-USA, W-450D). The acoustic amplitude of 50% was applied to deliver acoustic power of 25 W. After 30 min sonication, the aqueous solution turned pale green (Scheme 1).
Synthesis of AuNPs@PMo12 nano-hybrid without ultrasonic irradiation (UV-method)
In this experiment, UV-lamp was used instead of ultrasonic irradiation but, no change in the color of the solution was observed under the same condition of US method up to 100 min. So, it is concluded that no product was obtained under the same condition. However, in the less volume of chemicals, AuNPs@PMo12 nano-hybrids were produced according to the following procedure:29 5 mL of an aqueous solution of PMo12 (0.001 M), 2.5 mL HAuCl4 (0.001 M), and 2 mL 1-propanol were placed into a beaker. The final solution was then irradiated by UV light (125 W high-pressure mercury vapor lamp) under magnetic stirring. The solution color changed from colorless to wine red, confirming the formation of AuNPs. The time of reaction fixed at 35 min. Finally, the prepared AuNPs@PMo12 was kept at room temperature and remained stable for less than one week. The same results reported by other kinds of literature.29Detection of acetaminophen (AP)
Colorimetric detection of AP was performed by using AuNPs@PMo12 as a nano-probe. Briefly, 0.9 mL of an aqueous solution with different concentrations of AP (from 0 to 120 mg L−1) were added separately into 0.9 mL of AuNPs@PMo12 solution. After mixing the above solution, the change of color of the solution was investigated by UV-visible spectroscopy, and photographs were recorded with a digital camera. The high-angle annular dark field-scanning transmission electron microscopy (HAADF-STEM) was used to measure the diameters and morphological changes of AuNPs@PMo12 in the presence of AP, which confirms the aggregation of AuNPs@PMo12 induced by AP.Quantitative determination of acetaminophen by the RGB value
The extraordinary development of smartphones and tablets has made a great opportunity for researchers to develop their methods by using smartphones as a chemical detector. These highly reliable portable devices which have a digital camera and internal microprocessor for image processing, reduce using external computers and expensive devices. In this work, to obtain the calibration curve by analyzing the average RGB (red, green, and blue) value, the pictures of different concentrations of AP samples were taken. To verify the reliability of the smartphone as a chemical detector, we used two methods for analyzing the color changes. The RGB values were obtained by eyedropper function in the Microsoft Office PowerPoint 2016 software and ImageJ software. The quantitative determination was made by transforming the RGB value to AP concentration. The trend of RGB values of ImageJ is consistent with the eyedropper.Acetaminophen assay in mice serum
After a therapeutic dose, AP is changed to pharmacologically inactive glucuronide (AP-gluc, 52–57% of urinary metabolites) and sulfate (AP sulfate, 30–44%) conjugates, with a minor fraction being oxidized to a reactive metabolite NAPQI (5–10%). Less than 5% of AP is excreted unchanged.30 At supratherapeutic doses of AP (more than 4 g per day), sulfation approach becomes saturated, while glucuronidation and oxidation increase, and a smaller amount is excreted unchanged. After a single highly toxic dose of AP, glucuronidation becomes saturated and high proportions of the drug are eliminated unchanged (∼10%) and are oxidized to NAPQI (>15%).30The serum acetaminophen (AP) concentration is the basis for diagnosis and treatment. As the dose of AP increase the amount of unchanged AP in the serum increased. So, the measurement of unchanged AP in the serum depends on the amount of AP adiminstration. The Rumack–Matthew nomogram uses the serum acetaminophen concentration, in relation to the time after ingestion, to assess potential hepatotoxicity after a single, acute ingestion of acetaminophen.
To establish the toxic serum AP level in the blood, 2 g kg−1 of AP was fed to mice (100 mice) via the feeding tube. Two hours after AP ingestion, blood samples were obtained from mice. Serum AP levels were recorded at three levels based on the color change of nanosensor and baseline liver tests. The mice were divided into three groups based on the serum AP level determined by the nanosensor. The first group (>100 μg mL−1), the second group (25–100 μg mL−1) and the third group (<25 μg mL−1) were considered as high risk, medium risk, and low-risk groups, respectively. Blood samples were obtained five h again after AP ingestion in mice. Changes in liver enzymes in each group were compared to baseline status.
To evaluate the accuracy of the nanosensor in another way, the researcher prepared three hundred solutions with different AP concentrations and recorded the number of the container and the concentration of dissolved AP in the container. The second researcher, who was unaware of the research protocol, was asked to use the nanosensor solution to detect the AP level in each test tube at one of the levels of (>100 μg mL−1), (25–100 μg mL−1) or (<25 μg mL−1). In the end, the levels determined by the nanosensor were compared with the actual concentration of the solution. This experimental study was conducted under approval of Ethics Committee of Ahvaz Jundishapur University of Medical Sciences. All animal experiments carried out in accordance with the European Communities Council Directive of 24 November 1986 (86/609/EEC) to minimize damage to the animals.
Characterization and apparatus
The crystal structure of the resulting product was carried out on a Bruker D8-Focus using Cu Kα radiation (λ = 0.154![[thin space (1/6-em)]](https://www.rsc.org/images/entities/char_2009.gif) 056 nm) in the range of 2θ = 10–80°. High-angle annular dark field-scanning transmission electron microscopy (HAADF-STEM) images were collected using a Tecnai S-Twin 30, 300 keV, GIF-TRIDIEM. Energy-dispersive X-ray spectroscopy (EDS) data were obtained on the same instrument. The UV-vis spectra were recorded by an Evolution 201 spectrophotometer (Thermo Fisher Scientific). IR spectra were recorded on a Thermo Nicolet Avatar-370-FTIR spectrometer (Thermo Fisher scientific, United states). Zeta-potential measurement performed by Zeta Compact (CAD instrumentation, France). Dynamic light scattering (DLS) was conducted on Vasco Particle Size Analyzer (Cordouan Technologies). Atomic force microscopy (AFM) images were obtained with a NAMA AFM nanotechnology system corporation (NATSYCO) machine. Electrochemical analysis were conducted using a μ-Autolab type III electrochemical workstation. The analysis were performed at room temperature using a conventional three-electrode set-up. Platinum wire (Azar Electrod Co.) served as the counter electrode and Ag/AgCl as the reference electrode (Azar Electrod Co.). Experiments under ultrasonic irradiation were performed with equipment operating at 20 kHz (Branson Digital sonifier, Model W-450 D). It includes a double cylindrical jacket with a volume of 100 mL to control of temperature. The 20 kHz ultrasonic irradiations were emitted from the tip with a diameter of 1.1 cm which is located at the end of the horn.
056 nm) in the range of 2θ = 10–80°. High-angle annular dark field-scanning transmission electron microscopy (HAADF-STEM) images were collected using a Tecnai S-Twin 30, 300 keV, GIF-TRIDIEM. Energy-dispersive X-ray spectroscopy (EDS) data were obtained on the same instrument. The UV-vis spectra were recorded by an Evolution 201 spectrophotometer (Thermo Fisher Scientific). IR spectra were recorded on a Thermo Nicolet Avatar-370-FTIR spectrometer (Thermo Fisher scientific, United states). Zeta-potential measurement performed by Zeta Compact (CAD instrumentation, France). Dynamic light scattering (DLS) was conducted on Vasco Particle Size Analyzer (Cordouan Technologies). Atomic force microscopy (AFM) images were obtained with a NAMA AFM nanotechnology system corporation (NATSYCO) machine. Electrochemical analysis were conducted using a μ-Autolab type III electrochemical workstation. The analysis were performed at room temperature using a conventional three-electrode set-up. Platinum wire (Azar Electrod Co.) served as the counter electrode and Ag/AgCl as the reference electrode (Azar Electrod Co.). Experiments under ultrasonic irradiation were performed with equipment operating at 20 kHz (Branson Digital sonifier, Model W-450 D). It includes a double cylindrical jacket with a volume of 100 mL to control of temperature. The 20 kHz ultrasonic irradiations were emitted from the tip with a diameter of 1.1 cm which is located at the end of the horn.
Determination of acoustic intensity
Acoustic power and intensity were determined by a colorimetric method.25,31 Since the ultrasonic irradiation of a liquid generates heat, recording the temperatures as a function of time causes to the acoustic power calculation by the following equation (eqn (1)):
 | (1) |
Results and discussions
Sonochemical synthesis of AuNPs@PMo12 nano-hybrid
The sono-reduction process of PMo12 and Au ions was carried out using ultrasonic irradiation (US) which is shown in Scheme 1. Before US irradiation of PMo12 solution, no significant absorption band was observed in the visible region (curve (a) in Scheme 1). After sonication of the PMo12 solution, a broad absorption band centered at 750 nm was obtained and the solution became pale green (curve (b) in Scheme 1).28 The observation of a new metal-to-metal intervalence charge transfer (IVCT) band confirmed the electron transfer between the organic substrate (1-propanol) and heteropolyanions (PMo12O403−) which produced the reduced form of PMo12 (PMo12O404−) (pale green solution). Furthermore, the sonication of PMo12 solution in the presence of Au ions led to the synthesis of AuNPs@PMo12 (pink solution, curve c in Scheme 1). In water media, PMo12 dissociated as the following equation (eqn (2)):
 | (2) |
Before US irradiation the pH of the reactants in water media was measured at pH 3.5 ± 0.5. It is suggested that an association between the PMo12O403− and 1-propanol (S) occurred under US irradiation in aqueous media. The sono-reduction of the PMo12 is shown as follows (eqn (3)–(5)):32,33
| PMo12O403− + S → PMo12O403−⋯S | (3) |
 | (4) |
 | (5) |
Electrons accumulated on the PMo12O404− can be withdrawn by different electron acceptors (eqn (6)):34
 | (6) |
In eqn (6), etc. refers to reducing form of oxidant, O2− and H2O due to reduction of O2 and H+. The reduced form of PMo12 is a strong reducing agent that leads to the reduction of metal ions into their corresponding metal nanoparticles. In the case of gold ion, the following reaction occurs (eqn (7)):35
 | (7) |
According to Okitsu et al.26 under ultrasonic waves, localized hotspots with a high temperature are produced due to the rapid collapse of cavitation bubbles. Under such conditions, the homolysis of water molecules gives rise to highly reactive H˙ and OH˙ radicals.26,34 The sono-reduction of Au(III) in the presence of an organic additive (1-propanol) can occure via the following reactions26 (eqn (8)–(10)):
RH + ˙OH![[thin space (1/6-em)]](https://www.rsc.org/images/entities/char_2009.gif) ![[thin space (1/6-em)]](https://www.rsc.org/images/entities/char_2009.gif) (H˙) → R˙ + H2O (H˙) → R˙ + H2O![[thin space (1/6-em)]](https://www.rsc.org/images/entities/char_2009.gif) (H2) (H2)
| (8) |
| RH → pyrolysis radicals ⋮ and unstable products | (9) |
| Au(III) + reducing pecies (˙H, ˙R, etc.) → Au(0) | (10) |
According to the reactions (8)–(10) the rate of Au(III) reduction stongly depends on the concentration of ther primary and secondary reducing radicals. However, the acoustic intensity also affects other reaction parameters, such as temperature and pressure inside the collapsing cavitation bubbles, the size, number and distribution of bubbles, and the effect of 1-propanol on bubble temperature, secondary radical formation, and so forth.26
In the case of synthesis procedure, the effect of various parameters like sonication time, ultrasonic amplitude (intensity), reaction temperature, and Au: POM ratio on the synthesis of AuNPs@PMo12 nano-hybrids and their sensor activity has also been studied. Scheme 1 represents the synthetic strategy for AuNPs@PMo12 preparation and reduction of PMo12 under ultrasonic irradiation.
Characterization of AuNPs@PMo12 nano-hybrid
After the reduction of Au3+ ions with PMo12 as a reducing and stabilizing agent, the AuNPs@PMo12 nano-hybrids were characterized by UV-visible, FT-IR, high angle annular dark-field scanning transmission electron microscopy (HAADF-STEM), Energy Dispersive X-ray Spectroscopy (EDS), zeta potential, Atomic Force Microscope (AFM), electrochemical measurements, and Dynamic Light Scattering (DLS), respectively.In Fig. 1a, XRD pattern of the AuNPs@PMo12 nano-hybrid reveals the face-centered cubic (FCC) structure of the Au crystals with distinguished peaks in 38.1°, 44.3°, 64.5° and 77.5°, which correspond to the (111), (200), (220) and (311) crystal faces of metallic gold nanoparticle in accordance with JCPDS-04-0784.36,37 As shown in Fig. 1a, the peak corresponding to the (111) planes of Au is much sharper in comparison with the other planes of Au, which approves the predominant orientation of Au (111). The average particle size calculated from the Au (111) peak according to the Scherrer equation was 22 nm. Also, no obvious diffraction peaks were observed related to the crystallized POMs or Mo oxides.38 Therefore, it can be assumed that the POMs are adsorbed onto the surface of AuNPs with no agglomeration.39
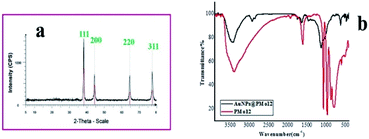 | ||
Fig. 1 (a) XRD pattern of AuNPs@PMo12 nano-hybrid, (b) FT-IR spectra of PMo12 and AuNPs@PMo12 nano-hybrid (synthesis condition: intensity = 26 W cm−2, T = 37 ± 1 °C, Au![[thin space (1/6-em)]](https://www.rsc.org/images/entities/char_2009.gif) : :![[thin space (1/6-em)]](https://www.rsc.org/images/entities/char_2009.gif) POM ratio (1 POM ratio (1![[thin space (1/6-em)]](https://www.rsc.org/images/entities/char_2009.gif) : :![[thin space (1/6-em)]](https://www.rsc.org/images/entities/char_2009.gif) 2)). 2)). | ||
FTIR spectroscopy was performed to verify the formation of AuNPs@PMo12 nano-hybrids. Fig. 1b shows the spectra and infrared transmission frequencies of PMo12 and AuNPs@PMo12. The characteristic peaks of PMo12 at 1060 cm−1 and 966 cm−1 are due to νas (P–O) and νas (Mo–Od), which appear in AuNPs@PMo12 at 1080 cm−1 with a shoulder in 1033 cm−1.38 This blue shift (shorter wavelength) approves the interaction between PMo12 and the surface of Au.40 The peak at 876 cm−1 is due to the vibration of (Mo–Ob–Mo), a stretch that disappears in the AuNPs@PMo12 sample.38 The peak around 796 cm−1 is attributed to the vibration of (Mo–Oc–Mo) and shows a red-shift (increase wavelength) in the AuNPs@PMo12 at 619 cm−1. These results suggest an interaction between PMo12 and Au via (Mo–Oc–Mo) group. Table S2† shows the most important IR vibrations for PMo12 and AuNPs@PMo12 nano-hybrid.
DLS analysis was used to measure the size distribution and hydrodynamic diameter of AuNPs@PMo12 in water. DLS data agrees well with the average particle size calculated from the Scherrer equation. The average size of AuNPs@PMo12 is found to be 19.8 ± 1.7 nm (synthesis condition: intensity = 26 W cm−2, T = 37 ± 1 °C, Au![[thin space (1/6-em)]](https://www.rsc.org/images/entities/char_2009.gif) :
:![[thin space (1/6-em)]](https://www.rsc.org/images/entities/char_2009.gif) POM ratio (1
POM ratio (1![[thin space (1/6-em)]](https://www.rsc.org/images/entities/char_2009.gif) :
:![[thin space (1/6-em)]](https://www.rsc.org/images/entities/char_2009.gif) 2)). A polydispersity index (PDI) of 0.17 was obtained indicating monodispersed AuNPs.
2)). A polydispersity index (PDI) of 0.17 was obtained indicating monodispersed AuNPs.
ζ-Potential measurements were used to characterize the surface potential of an as-prepared AuNPs@PMo12 colloidal solution. The measurement is crucial for studying the dispersion manners of the nanoparticles in a liquid media. The higher the ζ potential leads to a more stable suspension.41,42 The average ζ potential of suspensions was −2 mV. According to these results, the surface of NPs negatively charged due to the coating of PMo12 polyanions on the Au surface. Also, the results show high colloidal stability (for several months), and no precipitation was observed during this time.
The electrostatic repulsions between charged particles cause more dispersed particles and less coagulation.42 In our case, it seems that the ζ-potential is not sufficiently high to produce high colloidal stability of nanoparticles in the medium. It is proposed that the hydrogen bonding between OH groups in water and adsorbed PMo12 molecules on the surface of AuNPs is responsible for the observed stability. Besides, the greater stability of dispersion could be due to the solvation of adsorbed PMo12 molecules onto the surface of AuNPs.41 The FTIR results confirm this assumption. Also, results show that the AuNPs@PMo12 nano-hybrids which were synthesized under ultrasonic irradiation have higher stability than those synthesized with more conventional UV irradiation methods. There are two crucial factors about the PMo12 coating onto AuNPs surface: (1) increasing of mass transfer owing to shock waves action and microjets and (2) surface corrosion due to the collapse of a bubble near the surface.39 Therefore, the predominant factor determines the amount of PMo12 coating on the surface. The former leads to increasing of PMo12 coating onto the surface of AuNPs, and the later causes the desorption of coated PMo12 from the surface of AuNPs. In our case, it is assumed that the balance between the two parameters has occurred.
The existence of PMo12 in the AuNPs@PMo12 was further verified by electrochemical measurements. It should be noted that PMo12 can undergo a multi-electron reversible redox process without losing its integrity. The cyclic voltammograms (CVs) of PMo12 and AuNPs@PMo12 in 50% v/v water: DMF solution containing 1 M H2SO4 as an electrolyte are shown in Fig. 2. By comparing the CVs of PMo12 and AuNPs@PMo12, it can be concluded that voltammetric peaks at ca. −0.02, 0.18 and 0.4 V (vs. Ag/AgCl) in AuNPs@PMo12 electrode should be originated from the characteristic redox behavior of PMo12. Furthermore, PMo12 is adsorbed on Au during the synthesis of the AuNPs@PMo12.
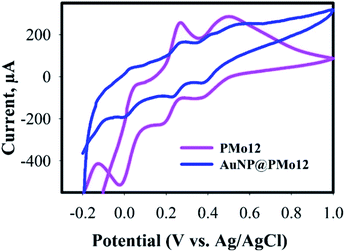 | ||
Fig. 2 Cyclic voltammograms (CVs) of AuNP@PMo12 and pure PMo12 in 50% (v/v) water–DMF solution containing 1 M H2SO4 (synthesis condition: intensity = 26 W cm−2, T = 37 ± 1 °C, Au![[thin space (1/6-em)]](https://www.rsc.org/images/entities/char_2009.gif) : :![[thin space (1/6-em)]](https://www.rsc.org/images/entities/char_2009.gif) POM ratio (1 POM ratio (1![[thin space (1/6-em)]](https://www.rsc.org/images/entities/char_2009.gif) : :![[thin space (1/6-em)]](https://www.rsc.org/images/entities/char_2009.gif) 2)). 2)). | ||
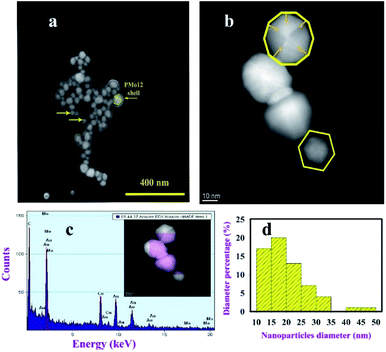
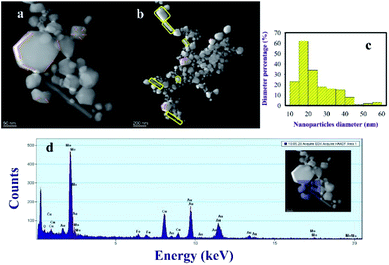
Scanning electron microscopy (SEM) and HAADF-STEM images were effectively applied to investigate the morphology of AuNPs@PMo12 (Fig. 3, 4 and 5). All figures show truncated tetrahedral and hexagonal shapes. Furthermore, the rod-like structure was observed by increasing of acoustic power. According to the results, the size of nanoparticles and length of nanorods increased with increasing of acoustic power. The average size of AuNPs@PMo12 nanoparticles was obtained 20 nm, 24 nm, and 34 nm for 21 W cm−2, 26 W cm−2, and 30.5 W cm−2 respectively. Also, the average length of the rod-like structure was obtained around 85 nm and 106 nm for 26 W cm−2 and 30.5 W cm−2, respectively. We propose that ultrasonic irradiation under these conditions led to corrosion of surface and desorption of capping agents (PMo12) from the surface of nanoparticle due to the collapse of cavitation. For this reason, the larger size of nanoparticles can be obtained under high-intensity ultrasonic waves.
Furthermore, in the growth process via a diffusion-controlled crystal, each crystal is surrounded by a diffusion sphere.31 It is suggested that ultrasonic waves enhance the mass transfer and diffusion of precursors from the bulk into the diffusion sphere, so the facets along the more active axis should be rapidly growing and led to the generation of faceted and 1D structure especially by increasing of acoustic intensity. Another key factor of the growth process is the diffusion sphere thickness, which is decreased by ultrasonic irradiation, and this phenomenon led to an increase in flux diffusion and rapid growth along the active axis.31
The chemical composition analysis of AuNPs@PMo12 was determined using EDS analysis (Fig. 3 and 4). A cross-sectional EDS line scan profiles extracted from the HAADF-STEM images confirmed the coverage of Mo in the immediate area surrounding the AuNPs, suggesting they are from the PMo12 structure. The Cu peaks are the signal detected from the SEM grid.
Optimization of acetaminophen (AP) detection conditions
To optimize the AuNPs@PMo12 for AP sensing,parameters such as the temperature of the reaction, acoustic intensity, Au![[thin space (1/6-em)]](https://www.rsc.org/images/entities/char_2009.gif) :
:![[thin space (1/6-em)]](https://www.rsc.org/images/entities/char_2009.gif) POM ratio, and sample pH value were investigated.
POM ratio, and sample pH value were investigated.
Effect of reaction temperature
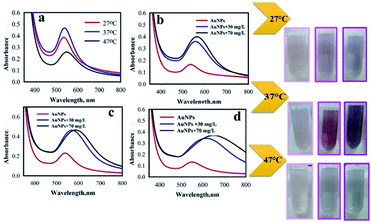
In the sonochemical reaction, the effect of temperature was investigated in 27 ± 1 °C, 37 ± 1 °C, and 47 ± 1 °C (Fig. 6). The conditions of sonochemical reaction were as follows: intensity, 26 W cm−2; and 1![[thin space (1/6-em)]](https://www.rsc.org/images/entities/char_2009.gif) :
:![[thin space (1/6-em)]](https://www.rsc.org/images/entities/char_2009.gif) 2 Au
2 Au![[thin space (1/6-em)]](https://www.rsc.org/images/entities/char_2009.gif) :
:![[thin space (1/6-em)]](https://www.rsc.org/images/entities/char_2009.gif) POM ratio. To investigate the effect of reaction temperature, AP aqueous solution (0.9 mL) was added to the AuNPs@PMo12 solution (0.9 mL). After 5 seconds the color of the solution was changed from light pink to dark pink (30 mg L−1), and purple (70 mg L−1). According to the results (Table S3†), the SPR peak of AuNPs@PMo12 is red-shifted by increasing temperature, which confirms the increase of particle size of AuNPs nanoparticles by increasing temperature. These results reveal that the maximum of SPR peak red-shifted by increasing AP concentration from 30 mg L−1 to 70 mg L−1. According to the results, the red-shift of the SPR peak confirmed that the NPs aggregated upon addition of AP.43 Based on the obtained results, the temperature of 37 ± 1 °C was selected as the optimum temperature.
POM ratio. To investigate the effect of reaction temperature, AP aqueous solution (0.9 mL) was added to the AuNPs@PMo12 solution (0.9 mL). After 5 seconds the color of the solution was changed from light pink to dark pink (30 mg L−1), and purple (70 mg L−1). According to the results (Table S3†), the SPR peak of AuNPs@PMo12 is red-shifted by increasing temperature, which confirms the increase of particle size of AuNPs nanoparticles by increasing temperature. These results reveal that the maximum of SPR peak red-shifted by increasing AP concentration from 30 mg L−1 to 70 mg L−1. According to the results, the red-shift of the SPR peak confirmed that the NPs aggregated upon addition of AP.43 Based on the obtained results, the temperature of 37 ± 1 °C was selected as the optimum temperature.
Effect of acoustic intensity
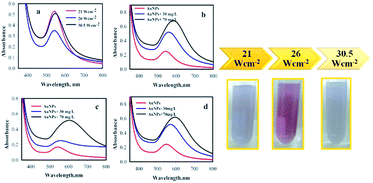
The amplitude of sonication was changed in the range of 40–60% (corresponding to an acoustic intensity of 21 W cm−2, 26 W cm−2, and 30.5 W cm−2, respectively), to better understand the effect of acoustic intensity on the AuNPs@PMo12 synthesis. The UV-visible absorbance spectra of AuNPs@PMo12 in different acoustic amplitudes and intensities are shown in Fig. 7. In this case, the conditions of sonochemical reaction were as follows; temperature; 37 ± 1 °C and Au![[thin space (1/6-em)]](https://www.rsc.org/images/entities/char_2009.gif) :
:![[thin space (1/6-em)]](https://www.rsc.org/images/entities/char_2009.gif) POM ratio of 1
POM ratio of 1![[thin space (1/6-em)]](https://www.rsc.org/images/entities/char_2009.gif) :
:![[thin space (1/6-em)]](https://www.rsc.org/images/entities/char_2009.gif) 2. The SPR peak of AuNPs@PMo12 is slightly red-shifted from 537 nm to 541 nm and 550 nm for 21 W cm−2, 26 W cm−2, and 30.5 W cm−2, respectively (Fig. 7 and Table S4†). This result confirms increasing acoustic intensity leads to increase in the size of particles.37 According to results, the change of color for 26 W cm−2 was significant. We therefore selected an amplitude of 50%, which corresponds to an intensity of 26 W cm−2 for other experiments.
2. The SPR peak of AuNPs@PMo12 is slightly red-shifted from 537 nm to 541 nm and 550 nm for 21 W cm−2, 26 W cm−2, and 30.5 W cm−2, respectively (Fig. 7 and Table S4†). This result confirms increasing acoustic intensity leads to increase in the size of particles.37 According to results, the change of color for 26 W cm−2 was significant. We therefore selected an amplitude of 50%, which corresponds to an intensity of 26 W cm−2 for other experiments.
Effect of Au![[thin space (1/6-em)]](https://www.rsc.org/images/entities/h3_char_2009.gif) :
:![[thin space (1/6-em)]](https://www.rsc.org/images/entities/h3_char_2009.gif) POM ratio
POM ratio
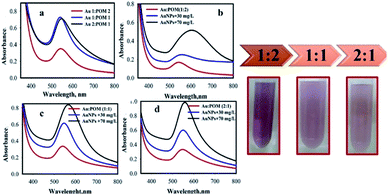
The UV-visible absorbance spectra of AuNPs@PMo12 in different Au![[thin space (1/6-em)]](https://www.rsc.org/images/entities/char_2009.gif) :
:![[thin space (1/6-em)]](https://www.rsc.org/images/entities/char_2009.gif) POM ratio is shown in Fig. 8. This condition of sonochemical reactions was as follows; temperature, 37 ± 1 °C; and intensity, 26 W cm−2. Comparing three different ratios, the SPR peaks for Au
POM ratio is shown in Fig. 8. This condition of sonochemical reactions was as follows; temperature, 37 ± 1 °C; and intensity, 26 W cm−2. Comparing three different ratios, the SPR peaks for Au![[thin space (1/6-em)]](https://www.rsc.org/images/entities/char_2009.gif) :
:![[thin space (1/6-em)]](https://www.rsc.org/images/entities/char_2009.gif) POM ratio of 1
POM ratio of 1![[thin space (1/6-em)]](https://www.rsc.org/images/entities/char_2009.gif) :
:![[thin space (1/6-em)]](https://www.rsc.org/images/entities/char_2009.gif) 2 shows more red-shifted by different concentration of AP (Fig. 8 and Table S5†). According to results, the change of color for Au
2 shows more red-shifted by different concentration of AP (Fig. 8 and Table S5†). According to results, the change of color for Au![[thin space (1/6-em)]](https://www.rsc.org/images/entities/char_2009.gif) :
:![[thin space (1/6-em)]](https://www.rsc.org/images/entities/char_2009.gif) POM ratio (1
POM ratio (1![[thin space (1/6-em)]](https://www.rsc.org/images/entities/char_2009.gif) :
:![[thin space (1/6-em)]](https://www.rsc.org/images/entities/char_2009.gif) 2) was significant, so this ratio was selected for all further experiments.
2) was significant, so this ratio was selected for all further experiments.
Effect of sample pH value
The effect of sample pH on AuNPs@PMo12 sensing ability for detection of AP was studied (Fig. 9 and S1†). The pH of the AuNPs@PMo12 solution (after preparation due to presence of PMo12 in as-prepared solution) was 3.0 ± 0.5, and the other pH values were adjusted using NaOH solution. As shown in Fig. S1† and 9, at lower pH (pH ∼3.0 ± 0.5), the SPR peaks show red-shifted in different concentrations. Furthermore, more color change of AuNPs@PMo12 from red to blue could be observed in the case of nanosensor at pH 3.0 ± 0.5. Since the pKa value of H3Mo12O40 in aqueous solution are 2.4, 4.3, and 5.5,44 AuNPs@PMo12 in pH ∼ 3.0 ± 0.5 should exist in nearly negative charge which confirmed with ζ-potential characterization, and the surface charge should be more negative by increasing of pH. Besides, the AP molecule as a weak electrolyte with a pKa value of 9.5 and both ionized (base) form and non-ionized (acid) form co-exist in the aqueous solution. According to the pH of the aqueous solution, the distribution of an acidic and basic form of AP change.28It was reported that 90% of AP is in the protonated form in pH < 7.0, and in the basic solution proton of phenol group is removed. At pH 11.0, 90% of the deprotonated form of AP exists in the aqueous solution.28 So, it is suggested that the AP molecule is in the non-ionized form in acidic medium (pH ∼3.0 ± 0.5) and the AuNPs aggregation was induced by AP through hydrogen bonding and donor–acceptor electron complexes.28,45 It is assumed that the generation of donor–acceptor electron complexes occurred between the free electron pair groups like oxygen groups of MoO12 onto the surface of AuNPs and the electropositive nitrogen in AP molecule.28
In basic media, PMo12 is not stable; therefore, it may degrade to some new Mo-based compounds and change the structure of the nano-hybrid. Also, in the basic media repulsion force between the negative charge of AuNPs@PMo12 nano-hybrid and deprotonated form of negative charge of AP occurred. So, the aggregation of AuNPs cannot be induced by AP molecules. According to the ESI (Fig. S1†), no significant color change is seen in neutral and basic media. Therefore, pH 3.0 ± 0.5 (natural pH of nanosensor) was selected for AuNPs@PMo12-based colorimetric assays of AP.
Colorimetric assay of acetaminophen
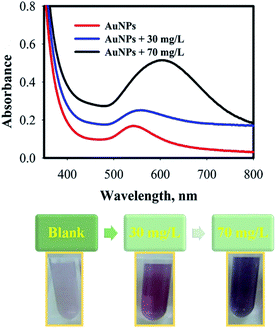
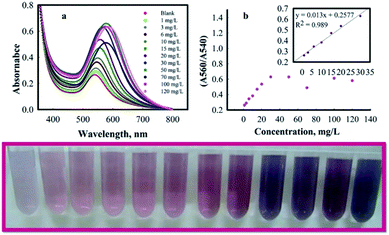
To test the analytical performance of AuNPs@PMo12, different concentrations of AP were added into individual AuNPs@PMo12 solutions at pH 3.0 ± 0.5. The changes of AuNPs@PMo12 dispersions both in terms of the color and the absorbance spectra are recorded and shown in Fig. 10. These results indicate that linear correlation existed between intensity ratio (A560/540) versus concentration of AP, over the range of 1–30 mg L−1 with regression equation of y = 0.0242x + 0.4798 (0.989). The absorbance ratio (A560/A540) increased with increasing of AP concentration. As a result, the limit of detection (LOD) was found to be 0.42 mg L−1.Quantitative determination of acetaminophen by smartphone as a chemical detector
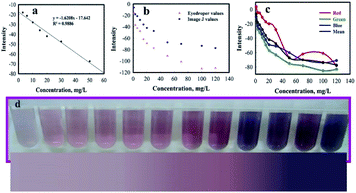
The extraordinary development of smartphones and tablets has made a great opportunity for researchers to develop their methods by using smartphones as a chemical detector.46 These highly reliable portable devices which have a digital camera and internal microprocessor for image processing, reduce using external computers and expensive devices.46 In this work, to obtain the calibration curve by analyzing the average RGB (red, green, and blue) value, the pictures of different concentrations of AP samples were taken. To verify the reliability of the smartphone as a chemical detector, we used two methods for analyzing the color changes. The RGB values were obtained by eyedropper function in Microsoft Office PowerPoint 2016 software and ImageJ software. Quantitative determination was made by transforming the RGB value to AP concentration. As shown in the Fig. 11, the trend of RGB values of ImageJ is consistent with eyedropper. The linear range for AP values was observed from 3 to 50 mg L−1 with regression equation of y = −1.6208x − 17.642 (0.9886).The quantitative result which was generated automatically by the eyedropper function in the PowerPoint 2016 software and ImageJ, was matched by the corresponding sample concentration in the colorimetric curve. As shown in the graphs, RGB values indicated linear behavior which is consistent with our previous results. This method is cost-efficient and more practical compared to the methods using expensive instruments with complicated sample preparation.
Selectivity of AuNPs@PMo12 for acetaminophen
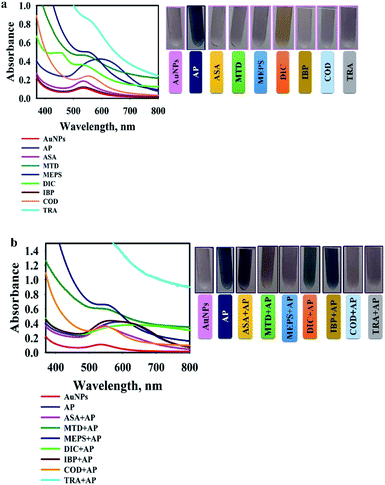
The specificity of the AuNPs@PMo12 nano-hybrid was studied by comparing the colour change of solution upon the separate addition of the drugs (acetaminophen (AP), methadone (MTD), methylphenidate (MEPS), tramadol (TRA), ibuprofen (IBP), aspirin (ASA), codeine (COD), and diclofenac (DIC)). These drugs were used to test the selectivity of the system for acetaminophen (C8H9NO2), because several of these drugs – MEPS, TRA, and MTD – are commonly used by people in conjunction with other over-the-counter drugs to achieve similar analgesic effects. In this test, acetaminophen, AP (C8H9NO2) with concentration of 0.46 mmol L−1 was used. Methadone, MTD (C21H27NO), methylphenidate, MEPS (C14H19NO2), tramadol, TRA (C16H25NO2), ibuprofen, IBP (C13H18O2), aspirin, ASA (C9H8O4), diclofenac, DIC (C14H11Cl2NO2), and codeine, COD (C18H21NO3) with a concentration of 0.92 mmol L−1 were added into AuNPs@PMo12 solution separately and in combination with AP solution. As seen in Fig. 12a, after the addition of AP, a significant color change occurred where the maximum shifts from 540 nm to 600 nm. The chemical structure of other drugs are shown in Fig. S2.† It is found that the drug with a group (–N) forms hydrogen bonding and donor–acceptor electron complexes into AuNPs@PMo12 surface. Among these drugs AP is the only one with a functional group (–NH) from an amide bond in molecular structure and it is our hypothesis that, due to less steric hindrance around this group, it shows more interaction by AuNPs@PMo12 surface. DIC shows a different color change compared to the other drugs, changing to orange-yellow. Importantly, the drugs which have no (–N) groups do not appear to interact with the AuNPs@PMo12 surface, so drugs such as ASA and IBP clearly produce almost no alteration of the AuNPs@PMo12 spectrum, as shown in Fig. 12a.Fig. 12b shows the UV-vis spectra of AuNPs@PMo12 solutions for the selective detection of AP from a combination of different drugs. In these experiments, the UV-vis spectra of AuNPs@PMo12 was measured when AP (at a concentration of 0.46 mmol L−1) was added with other commercially available drugs (at a concentration of 0.92 mmol L−1). The photographs illustrate that for the naked eye detection, the selective detection is only evident for the four of the seven drugs that were evaluated and it is clear that the more subtle colour changes observed for combinations of ASA + AP, DIC + AP and IBP + AP require further analytical confirmation. The absorption profiles from the UV-vis spectra confirm the selective and specific interaction of only AP molecules with the nanosensor and clear differences between all the drug combinations.
Sensing mechanism
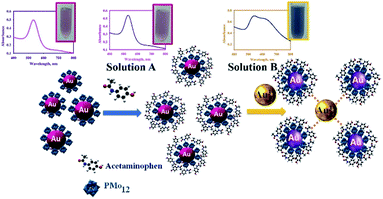
To verify the mechanism of AuNPs aggregation in the presence of Ap, the following experiment was carried out: after the reaction nanosensor with AP, the final product was centrifuged and washed many times to purify and separate from the synthesis media. The purified AuNPs were dispersed in deionized water, which was tested with an AP solution (0.9 mL of nanosensor solution +0.9 mL of AP solution with 70 mg L−1) (solution A). After adding AP solution, there was no change in color of the solution and UV-vis spectrum of AuNPs@PMo12 (Fig. 13). After that, 0.1 mL of Au(III) solution (1 mM) was added to solution A (solution B). Results exhibited a change in color and UV-vis spectrum by the addition of the Au ions solution.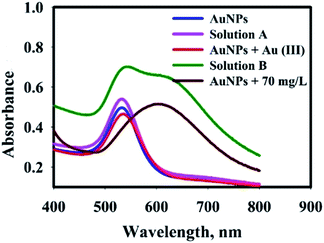 | ||
| Fig. 13 UV-visible spectra of AuNPs@PMo12 solutions in a different condition to determine mechanism of AP detection. | ||
In our research work, there are some important observation which can be listed as follows: (1) after synthesis process, the solution of AuNPs@PMo12 showed red color due to its strong surface plasmon resonance at ca. 540 nm, and the addition of AP solution led to color change which was due to interparticle crosslinking and the aggregation of AuNPs; (2) In presence of Au(III) ions, AuNPs@PMo12 aggregated after addition of the AP molecules.
So, the following mechanism is assumed whereby AP is able to ionize in aqueous solution as follows (eqn (11)):
| C8H9NO2 ⇔ C8H8NO2− + H+ | (11) |
The pKa for ionization of AP molecules shown by eqn (11) is reported to be 9.5.29 The pH of nanosensor is 3.0 ± 0.5. Thus, at this pH, AP mainly exists in the form shown by the left-hand side of eqn (11). According to the zeta potential results, the surface of AuNPs@PMo12 was nearly negative, but the ζ-potential was not sufficiently high. In addition, the AP molecules are in a non-ionized form in the pH of the nanosensor (pH ∼3.0 ± 0.5). So, it is suggested that the electrostatic interaction is not a predominant factor in binding between AuNPs@PMo12 and AP molecules. The target analyte (AP) with a functional group (–NH) forms hydrogen bonding and donor–acceptor electron complexes into AuNPs@PMo12 surface. Besides, AP molecules strongly induced the AuNPs@PMo12 aggregation in the presence of Au(III) ions. It is proposed that Au(III) can interact with –OH groups of AP molecules via donor–acceptor electron complex which causes the interparticle cross linking between AuNPs and then change in color (Fig. 13 and Scheme 2). Therefore, AP can rapidly induce the aggregation of AuNPs in the presence of unreacted Au(III) ions which exist in nanosensor media. It is also possible that H-bonding between AP molecules adsorbed to neighbor AuNPs@PMo12 took place.
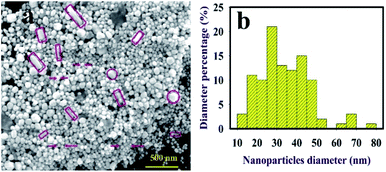
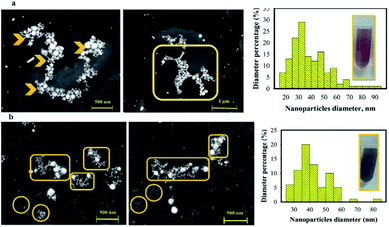
As mentioned, PMo12 was used as a capping and reducing agent for the synthesis of AuNPs without further modifications. In order to examine the change in the average size and morphology of AuNPs, we considered the AP-induced aggregation of AuNPs@PMo12 by SEM. As shown in Fig. 14, the average size of AuNPs nanoparticles increased from 20 nm to 38 nm and 42 nm upon addition of AP with a concentration of 30 mg L−1 and 70 mg L−1, respectively. The morphology of AuNPs@PMo12 was influenced by the addition of AP. AP molecules lead to the inter-particle distance reduction of AuNPs (Fig. 14).
This colorimetric strategy exhibited high sensitivity and excellent selectivity for the detection of AP because of the high efficiency and great specificity of nanostructured supramolecular chemistry. AFM analysis also shows the aggregation of AuNPs@PMo12 nano-hybrids after addition of AP in nanosensor media (Fig. 15). Scheme 2 indicates the detection mechanism of AP in the presence of AuNPs@PMo12 nano-hybrid and Au(III) ions.
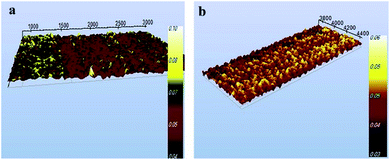 | ||
Fig. 15 AFM image of AuNPs@PMo12 nano-hybrids (a) before and (b) after the addition of AP (70 mg L−1) (synthesis condition; intensity; 26 W cm−2, T = 37 ± 1 °C, Au![[thin space (1/6-em)]](https://www.rsc.org/images/entities/char_2009.gif) : :![[thin space (1/6-em)]](https://www.rsc.org/images/entities/char_2009.gif) POM ratio (1 POM ratio (1![[thin space (1/6-em)]](https://www.rsc.org/images/entities/char_2009.gif) : :![[thin space (1/6-em)]](https://www.rsc.org/images/entities/char_2009.gif) 2)). 2)). | ||
Determination of acetaminophen in mice serum samples with AuNPs@PMo12 nanosensor
Mean serum AST‡ and ALT§ levels were measured two hours and five hours after drug administration. As shown in Table 1, the results obtained in this study based on the nanosensor showed that 73 mice had levels above 100 μg mL−1 (toxic level), 22 mice had levels between 25-100 μg mL−1 (suspicious), and 5 mice had levels less than 25 μg mL−1 (non-toxic level).| Toxic group, N = 73 | Suspicious group, N = 22 | Non-toxic group, N = 5 | P-valuea | ||
|---|---|---|---|---|---|
| a Kruskal Wallis test was used for comparison between the 3 groups.b Wilcoxon Singed Ranks test was used to examine intra-group changes. | |||||
| Serum AST level (mg L−1) | After 2 h | 106.22 ± 0.78 | 100.15 ± 0.03 | 108.7 ± 0.78 | <0.001 |
| After 5 h | 274.49 ± 4.6 | 173.17 ± 0.1 | 134.85 ± 0.48 | <0.001 | |
| P valueb | <0.001 | <0.001 | <0.001 | ||
| Serum ALT level (mg L−1) | After 2 h | 32.54 ± 0.42 | 32.76 ± 0.81 | 32.68 ± 0.38 | >0.05 |
| After 5 h | 156.5 ± 5.24 | 93.91 ± 1.08 | 44.54 ± 1.57 | <0.001 | |
| P valueb | <0.001 | <0.001 | <0.001 | ||
According to the results, changes in both AST and ALT enzymes showed a significant increase at the fifth hour after AP administration compared to the second hour (p < 0.001). Spearman's correlation coefficient between nanosensor results and serum AST enzyme level two hours after drug administration was r = 0.407 and p < 0.001 and five hours after drug administration was r = 0.775 and p < 0.001, indicating very high agreement between the two tests.
Spearman's correlation coefficient between nanosensor results and serum ALT enzyme level two hours after drug administration was r = 0.292 and p = 0.003 and five hours after drug administration was r = 0.775 and p < 0.001, indicating very high agreement between the two tests, especially with the results 5 hours after drug administration. The accuracy of the nanosensor was discussed in the ESI† (see “Diagnostic accuracy of the nanosensor”, Fig. S2 and S3 in ESI†).
Conclusions
We have prepared a rapid, simple, low cost and highly specific nanosensor for the quantitative determination of acetamphetamine in blood serum samples. The colorimetric nanoprobes are polyoxometalate-stabilized nanoparticles, AuNP@PMo12 which are synthesised using a rapid, facile and eco-friendly sonochemical synthesis. The A600/A540nm values of AuNP@PMo12 nano-hybrid biosensor indicated a linear relationship with a concentration range of AP (1–30 mg L−1). Importantly, both the qualitative and quantitative determination of AP were investigated, and our method demonstrated the limit of detection to be as low as 0.42 mg L−1. These results showed that this nanosensing set-up could potentially be used in a clinical setting for the real-time point-of-care detection of AP with accuracy, convenience, and efficiency, even in the presence of other pharmaceuticals, in this instance methadone, methylphenidate, and tramadol. Future work will involve the practical application of this set-up by integrating mobile phone devices and the appropriate applications to detect a range of AP in more complex media, e.g. other buffers, cell culture media, patient blood serum, and so forth.Conflicts of interest
There are no conflicts to declare.Acknowledgements
This work has been financially supported by the Iranian National Science Foundation (INSF) (No. 97009286). The authors also wish to thank The Advanced Microscopy Laboratory (Universidad de Zaragoza) for access to their instrumentation and expertise.References
- E. Yoon, A. Babar, M. Choudhary, M. Kutner and N. Pyrsopoulos, J. clin. transl. hepatol., 2016, 4, 131–142 Search PubMed.
- C. M. Herndon and D. M. Dankenbring, Journal of Pain and Palliative Care Pharmacotherapy, 2014, 28, 109–116 CrossRef PubMed.
- R. Clark, J. E. Fisher, I. S. Sketris and G. M. Johnston, BMC Clin. Pharmacol., 2012, 12, 11 CrossRef CAS PubMed.
- G. Corcoran, W. Racz, C. Smith and J. Mitchell, J. Pharmacol. Exp. Ther., 1985, 232, 864–872 CAS.
- S. H. Rhyee, Academic Emergency Medicine, 2013, 20, 1070–1071 CrossRef PubMed.
- G. Burgot, F. Auffret and J.-L. Burgot, Anal. Chim. Acta, 1997, 343, 125–128 CrossRef CAS.
- S. Ravisankar, M. Vasudevan, M. Gandhimathi and B. Suresh, Talanta, 1998, 46, 1577–1581 CrossRef CAS PubMed.
- A. B. Moreira, H. P. Oliveira, T. D. Atvars, I. L. Dias, G. O. Neto, E. A. Zagatto and L. T. Kubota, Anal. Chim. Acta, 2005, 539, 257–261 CrossRef CAS.
- S. Zhao, W. Bai, H. Yuan and D. Xiao, Anal. Chim. Acta, 2006, 559, 195–199 CrossRef CAS.
- A. Cernat, M. Tertiş, R. Săndulescu, F. Bedioui, A. Cristea and C. Cristea, Anal. Chim. Acta, 2015, 886, 16–28 CrossRef CAS PubMed.
- L. Tang and J. Li, ACS Sens, 2017, 2(7), 857–875 CrossRef CAS PubMed.
- Y. Guo and W. Zhao, Coord. Chem. Rev., 2019, 387, 249–261 CrossRef CAS.
- H. G. T. Ly, G. Absillis, R. Janssens, P. Proost and T. N. Parac-Vogt, Angew. Chem., Int. Ed., 2015, 54, 7391–7394 CrossRef CAS PubMed.
- A. González, N. Gálvez, M. Clemente-León and J. M. Dominguez-Vera, Chem. Comm., 2015, 51, 10119–10122 RSC.
- D.-F. Chai, Z. Ma, H. Yan, Y. Qiu, H. Liu, H.-D. Guo and G.-G. Gao, RSC Adv., 2015, 5, 78771–78779 RSC.
- A. Troupis, A. Hiskia and E. Papaconstantinou, Angew. Chem., Int. Ed., 2002, 41, 1911–1914 CrossRef CAS PubMed.
- Y. Wang and I. A. Weinstock, Chem. Soc. Rev., 2012, 41, 7479–7496 RSC.
- S. G. Mitchell and J. M. de la Fuente, J. Mater. Chem., 2012, 22, 18091–18100 RSC.
- Z. Lang, I. M. Gabas, X. López, A. Clotet, J. M. de la Fuente, S. G. Mitchell and J. M. Poblet, New J. Chem., 2016, 40, 1029–1038 RSC.
- G. Zhang, B. Keita, R. N. Biboum, F. Miserque, P. Berthet, A. Dolbecq, P. Mialane, L. Catala and L. Nadjo, J. Mater. Chem., 2009, 19, 8639–8644 RSC.
- R. Liu, S. Li, G. Zhang, A. Dolbecq, P. Mialane and B. Keita, J. Cluster Sci., 2014, 25, 711–740 CrossRef CAS.
- L. Suo, W. Gao, Y. Du, R. Wang, L. Wu and L. Bi, New J. Chem., 2016, 40, 985–993 RSC.
- A. Ayati, A. Ahmadpour, F. F. Bamoharram, M. M. Heravi and H. Rashidi, Chin. J. Catal., 2011, 32, 978–982 CrossRef CAS.
- H. Xu and K. S. Suslick, ACS Nano, 2010, 4, 3209–3214 CrossRef CAS PubMed.
- T. Rohani Bastami and M. H. Entezari, Ultrason. Sonochem., 2012, 19, 830–840 CrossRef PubMed.
- K. Okitsu, M. Ashokkumar and F. Grieser, J. Phys. Chem., 2005, 109(44), 20673–20675 CrossRef CAS PubMed.
- S. Anandan, F. Grieser and M. Ashokkumar, J. Phys. Chem. C, 2008, 112(39), 15102–15105 CrossRef CAS.
- V. Bernal, A. Erto, L. Giraldo and J. C. Moreno-Piraján, Molecules, 2017, 22, 1032–1046 CrossRef PubMed.
- A. Ayati, A. Ahmadpour, F. F. Bamoharram, M. M. Heravi and M. Sillanpää, Gold Bullet, 2012, 45, 145–151 CrossRef CAS.
- L. L. Mazaleuskaya, K. Sangkuhl, C. F. Thorn, G. A. FitzGerald, R. B. Altman and T. E. Klein, PharmGKB, 2015, 25, 416–426 CAS.
- T. Rohani Bastami and M. H. Entezari, Ultrason. Sonochem., 2012, 19, 560–569 CrossRef CAS PubMed.
- J. Chen, S. Liu, W. Feng, G. Zhang and F. Yang, Phys. Chem. Chem. Phys., 2013, 15, 5664–5669 RSC.
- E. Papaconstantinou, Chem. Soc. Rev., 1989, 16, 1–31 RSC.
- E. Papaconstantinou and A. Hiskia, in Polyoxometalate Molecular Science, ed. J. J. Borrás-Almenar, E. Coronado, A. Müller and M. Pope, Springer Netherlands, Dordrecht, 2003, p. 381 Search PubMed.
- Z. Mohammadi and M. H. Entezari, Ultrason. Sonochem., 2018, 44, 1–13 CrossRef CAS PubMed.
- Z. Li, A. Friedrich and A. Taubert, J. Mater. Chem., 2008, 18, 1008–1014 RSC.
- J. Xu, T. Zhao, Z. Liang and L. Zhu, Chem. Mater., 2008, 20, 1688–1690 CrossRef CAS.
- S. Khadempir, A. Ahmadpour, M. T. Hamed Mosavian, N. Ashraf, F. F. Bamoharram, S. G. Mitchell and J. M. de la Fuente, RSC Adv., 2015, 5, 24319–24326 RSC.
- S. Khadempir, A. Ahmadpour, M. T. Hamed Mosavian, N. Ashraf, F. F. Bamoharram, R. Fernández-Pacheco, J. M. de la Fuente and S. G. Mitchell, RSC Adv., 2016, 6, 5359–5366 RSC.
- T. Mazari, C. R. Marchal, S. Hocine, N. Salhi and C. Rabia, J. Nat. Gas Chem., 2010, 19, 54–60 CrossRef CAS.
- X.-j. Wang, X. Li and S. Yang, Energy Fuels, 2009, 23, 2684 CrossRef CAS.
- T. Rohani Bastami and M. H. Entezari, Mater. Res. Bull., 2013, 48, 3149–3156 CrossRef.
- S. K. Laliwala, V. N. Mehta, J. V. Rohit and S. K. Kailasa, Sens. Actuators, B, 2014, 197, 254–263 CrossRef CAS.
- E. A. Nagul, I. D. McKelvie, P. Worsfold and S. D. Kolev, Anal. Chim. Acta, 2015, 890, 60–82 CrossRef CAS PubMed.
- L. F. Prescott, Br. J. Clin. Pharmacol., 1980, 10(suppl. 2), 291S CrossRef PubMed.
- J. Du, H. Ge, Q. Gu, H. Du, J. Fan and X. Peng, Nanoscale, 2017, 9, 19139–19144 RSC.
Footnotes |
| † Electronic supplementary information (ESI) available. See DOI: 10.1039/d0ra00931h |
| ‡ Aspartate aminotransferase. |
| § Alanine transaminase. |
| This journal is © The Royal Society of Chemistry 2020 |

