
 Open Access Article
 This Open Access Article is licensed under a Creative Commons Attribution-Non Commercial 3.0 Unported Licence
Identification of preferentially exposed crystal facets by X-ray diffraction†
Liping Zhang ,
Alexandre A. S. Gonçalves and
Mietek Jaroniec*
,
Alexandre A. S. Gonçalves and
Mietek Jaroniec*
Department of Chemistry and Biochemistry, Kent State University, Kent, Ohio 44242, USA. E-mail: jaroniec@kent.edu
First published on 4th February 2020
Abstract
Crystals with exposed facets are popular materials in many catalytic applications due to their high reactivity. Facet identification is often conducted by transmission electron microscopy (TEM). In this work, we analyze the effects of doping, vacancy creation, anisotropic broadening, and preferred orientation on the intensity of X-ray diffraction (XRD) peaks by using tetragonal bismuth oxyhalides (BiOX, X = Cl, Br, and I) as examples. The differences in these effects were successfully used to identify the preferentially exposed (001) facets of BiOX nanoplates synthesized by a polymer-assisted precipitation method. In comparison to TEM, the XRD analysis is not only cheaper and easier to perform, but also it gives results representative for the sample. This work aims to provide further justification for the use of XRD as a powerful and handy characterization technique in the field of crystal facet engineering.
1. Introduction
It is well known that two nonequivalent lattice planes of a crystal have different atomic arrangements, giving rise to many interesting phenomena. Taking titanium dioxide (anatase, a-TiO2) as an example, a-TiO2 crystals with a high percentage (in terms of area) of the {101} facets are more thermodynamically stable than those with a high percentage of the {001} facets and therefore are easier to synthesize.1–3 However, the {001} facets are particularly desirable in many applications related to adsorption and catalysis due to their high reactivity.4 For instance, studies have shown that lithium insertion and de-insertion processes in batteries are more inclined to occur on the {001} facets.5 Additionally, the adsorption of water molecules on the {001} facets is dissociative with the generation of hydroxyl groups (–OH),1 which are known to play a great role in photocatalytic applications of a-TiO2.6 Owing to these unique properties, among other properties, many more facets of various crystals besides {001} and {101} of a-TiO2 have been explored (Table S1†).Preferentially exposed facets of crystals are often identified by electron microscopy, particularly transmission electron microscopy (TEM). For crystals with regular shapes, intersection angles between adjacent facets can be measured. Alternatively, lattice planes are visualized by high-resolution TEM (HRTEM) and the interplanar spacings and/or intersection angles are determined by fast Fourier transform (FFT) or selected area electron diffraction (SAED).7 Both the angles and spacings can be compared with the theoretical values to identify exposed facets. Interestingly, in characterization of crystalline materials with largely exposed facets by X-ray diffraction (XRD), the patterns often show a few peaks with relative intensity higher than the normal. This phenomenon has been used occasionally for facet identification based on the rationale that these crystals turn to orient in a particular direction and therefore the diffraction peaks corresponding to the lattice planes perpendicular to the direction are intensified. For example, the XRD peak intensity ratio of (110) to (200) (I110/I200) for two types of Ag3PO4 microcrystals, namely rhombic dodecahedrons (I110/I200 = 2.7) and cubes (I110/I200 = 0.52), was compared with the normal value (0.78) to confirm that the former has exposed {110} facets while the latter has exposed {100} facets.8 Also, the intensification of the (111) peak for Co3O4 multi-shelled dodecahedrons was considered as an indication of their large exposure of (111) facets.9 As compared to TEM, XRD is cheaper and simpler to operate starting from the sample preparation to data collection. More importantly, it gives results representative for the entire sample.
However, the reality turns out to be more complicated; specifically, the intensity of the XRD peaks for a sample can be affected by many factors related to the composition (including the scattering ability of constituent atoms, occupancy of atomic sites, and fractional coordinates) or the morphology (e.g., anisotropic broadening besides preferred orientation). Furthermore, in many cases two or more of these factors coexist, such as crystalline materials that have both largely exposed facets and vacancies (or foreign ions doped in the lattices).10,11 Therefore, it is necessary to first account for the peak intensification and evaluate if preferentially exposed facets are present, and then identify these facets. Considering the ever-growing interests in doping, vacancy creation, and the design of anisotropic nanomaterials (such as nanowires, nanorods, nanosheets, etc.) in addition to crystal facet engineering, their influence on the diffraction peaks need to be elucidated in order to allow XRD to be better used for studying the crystallographic properties of crystalline materials.
In this work, bismuth oxyhalides (BiOX, where X = Cl, Br, or I) were synthesized as examples for the demonstration of facet identification by XRD. Typically, BiOCl,10,12 BiOBr,13,14 and BiOI15,16 nanoplates with exposed (001) facets are synthesized by hydrothermal methods under different conditions; whereas, we show a precipitation approach that is applicable to the synthesis of all BiOX with plate-like structures. The presence of Bi, O, and X in the samples was evidenced by energy-dispersive X-ray spectroscopy (EDX, Fig. S1, ESI†). XRD patterns reveal that the synthesized bismuth oxyhalides have tetragonal structures and the peaks corresponding to the (001), (002), (003), and (004) lattice planes are intensified (Fig. S2†). As has been pointed out above, possible causes include doping (the occurrence of which is not supported by the EDX results; nevertheless, it is discussed for the demonstration purpose), presence of vacancies, anisotropic broadening, and preferred orientation in the [001] direction. The influence of these possibilities on the XRD peaks are investigated by simulating the patterns from reported crystallographic data (described in ESI†).
2. Experimental methods
2.1 Synthesis of bismuth oxyhalides (BiOX, X = I, Br, and Cl)
A stock solution (0.025 mol L−1) of polyethylene glycol (PEG; average molecular weight, 7000–9000 mol g−1; Spectrum Chemical Mfg. Corp.) was prepared. In the synthesis of BiOI, 5.0 mL of the PEG solution was measured and mixed with 20.0 mL of deionized (DI) water. To this diluted PEG solution, 0.25 mmol of bismuth nitrate pentahydrate [Bi(NO3)3·5H2O, Acros] was added under stirring, creating a clear solution. Next, 0.25 mmol of potassium iodide (KI, Fisher Scientific) was added and a brick-red suspension was formed immediately, which was stirred for another 1 hour. Finally, the precipitate was collected by centrifugation, washed with DI water, and dried at 80 °C. BiOBr and BiOCl were synthesized following the same procedure as that for BiOI by using potassium bromide (KBr, Acros) and potassium chloride (KCl, Fisher Scientific), respectively, as the precipitating agents.2.2 Simulation
Simulation of XRD patterns was carried out on PANalytical X'Pert HighScore. The cell parameters, fractional coordinates, and atomic displacement parameters of BiOI, BiOBr, and BiOCl were retrieved from Inorganic Crystal Structure Database (ICSD) entries of 391354, 61225, and 74502, respectively. Doping was modelled by adding a relevant atom with a selected value of site occupancy factor (SOF) during the crystal building. For example, doping bismuth oxyiodide with 2% (atomic ratio) of Br−, which gives BiOI0.98Br0.02, was modelled by entering 0.02 and 0.98 for the SOF of Br and I, respectively; while other parameters of these two elements, including fractional coordinates and atomic displacement parameters were kept the same. The simulation of vacancy creation followed a similar strategy as that of doping. For example, bismuth oxyiodide with 2% of O vacancies, namely BiO0.98I, was achieved by setting the SOF of O as 0.98. For modelling preferred orientation and peak broadening at various March/Dollase (additional information on this parameter can be found in ref. 17) and anisotropic parameters, respectively, “1” was entered for the SOF of all elements and other parameters were directly taken from the ICSD files.2.3 Characterization
The crystal structures of the BiOX samples were studied by X-ray diffraction (XRD) using a MiniFlex 600 X-ray diffractometer (Rigaku Corporation, Tokyo, Japan). X-rays were generated from a Cu anode at a working voltage and current of 40 kV and 15 mA, respectively. XRD patterns were recorded at a step size of 0.02°. Scanning electron microscopy (SEM) experiments were performed on a FEI Quanta 450 FEG Environmental Scanning Electron Microscope. All samples were directly loaded on conductive carbon adhesive tabs (Ted Pella, Inc.). Transmission electron microscopy (TEM) and energy-dispersive X-ray spectroscopy (EDX) were conducted on a FEI Tecnai G2 F20 Transmission Electron Microscope. The TEM specimens were prepared by dipping carbon/formvar-film coated Cu grids (Pacific Grid Tech) into homogeneous BiOX–ethanol suspensions, followed by drying at 60 °C.3. Results and discussion
To begin with, the crystal structure of tetragonal BiOX showing the [Bi2O2]2+ and X− layers was first created (Fig. S3†). Doping or creation of vacancies was performed by replacing or removing a portion of the relevant constituent ions in the crystal structure (Fig. S3†). The simulated XRD patterns of Br−-doped tetragonal BiOI (t-BiOI), in which various amounts of I− ions are substituted by Br− ions, show that Br− doping causes the (001) peak to become more intense and the increase in the relative intensity is proportional to the doping amount (Fig. 1a). The substitution of Cl, S, and one of the metallic elements among Eu, Fe, and Zn for I, O, and Bi, respectively, leads to either strengthening or weakening of the (001) peak (Fig. S4†). On one hand, regardless of the identity of doped elements, the (001) peak rises or weakens moderately [less than 16.4% for 10% (atomic ratio) doping]; whereas, the (002) and (004) peaks virtually remain unaffected (up to 7.5% for 10% doping). On the other hand, evident from Br− doping (Fig. 1a), a substantial change in the peak intensity can be expected for doping on a large scale, which essentially creates a solid solution. As shown in many studies, the characteristic diffraction peaks of solid solutions, such as BiOClxI1−x18 and (CuGa)1−xZn2xS2,19 undergo apparent shift due to the significant effects on the lattice parameters and fractional coordinates. | ||
| Fig. 1 Simulated XRD patterns of BiOI with various amounts of (a) Br− ions substituted for I− ions and (b) I vacancies. | ||
In comparison to the case of doping, the formation of vacancies has larger impact on the peak intensity – after all, the occupancy of the corresponding atomic sites is reduced. Fig. 1a shows that 10% of Br− doping results in an increase of 8.2% in the (001) peak intensity; whereas, removing the same amount of I− causes the peak to rise by 24.8% (Fig. 1b). In the meanwhile, the intensity of the (002) peak is slightly reduced (up to 5.0% for 10% doping and 12.5% for creating 10% I vacancies). However, the creation of 10% of O or Bi vacancies gives a reduction of 35.8% or 18.2%, respectively, in the (001) peak intensity (Fig. S5†). In short, the (001) peak in the XRD pattern of t-BiOI can be enhanced moderately by replacing or removing a portion of I− ions without drastically changing the cell parameters and atomic fractional coordinates. However, either treatment does not result in intensification of the (002) and (004) peaks. Besides the (001) peak, the (002), (003), and (004) peaks visible in the experimental XRD patterns of the synthesized BiOX samples are also intensified by more than 50% and their positions are not shifted. Hence, it can be concluded that the peak intensification observed for the BiOX samples was not (at least not primarily) caused by any foreign ions or vacancies that may be present.
The influence of anisotropic broadening on the intensity of XRD peaks has already been observed in many studies. As an example, the reduction in the thickness of nanosized a-TiO2 decahedra in the [001] direction causes the (004) peak visible in the XRD pattern to become much broader and less intense.20 In the case of BiOX, as the (110) peaks are broadened, which can be achieved by growing BiOX nanowires along [001], not only is their intensity reduced, but also the (001), (002), (003) and (004) peaks become more intense, giving rise to patterns (#3 in Fig. 2 and S6†) somewhat similar to those taking into account preferred orientation in [001] (#2 in Fig. 2 and S6†) as well those of the synthesized BiOX (#4 in Fig. 2 and S6†). Apparently, anisotropic nanomaterials including the aforementioned nanowires can be recognized easily by optical or electron microscopy. However, the peak broadening feature is fairly distinguishable in XRD patterns. As can be seen in Fig. 2a, even for relatively small increase in the intensity of the (002) and (004) peaks for t-BiOI (while still much larger than the increase resulting from doping and vacancy creation), the (110) peak is significantly broadened. Further intensification of these two peaks to the level observed in the experimental pattern requires additional broadening of the (110) peak, which is likely to lead to significant peak overlapping. In fact, in the experimental patterns it is the intensified peak themselves that are substantially broadened (Fig. 2 and S6†). Therefore, not only can the increase in the intensity of the XRD peaks be attributed to preferred orientation after eliminating the possibility of anisotropic (110) peak broadening, but also the XRD patterns indicate that the size of the BiOX crystals in the [001] direction is on the nanoscale and much smaller than those in other directions. In other words, the BiOX samples are composed of nanoplates with preferentially exposed (001) facets.
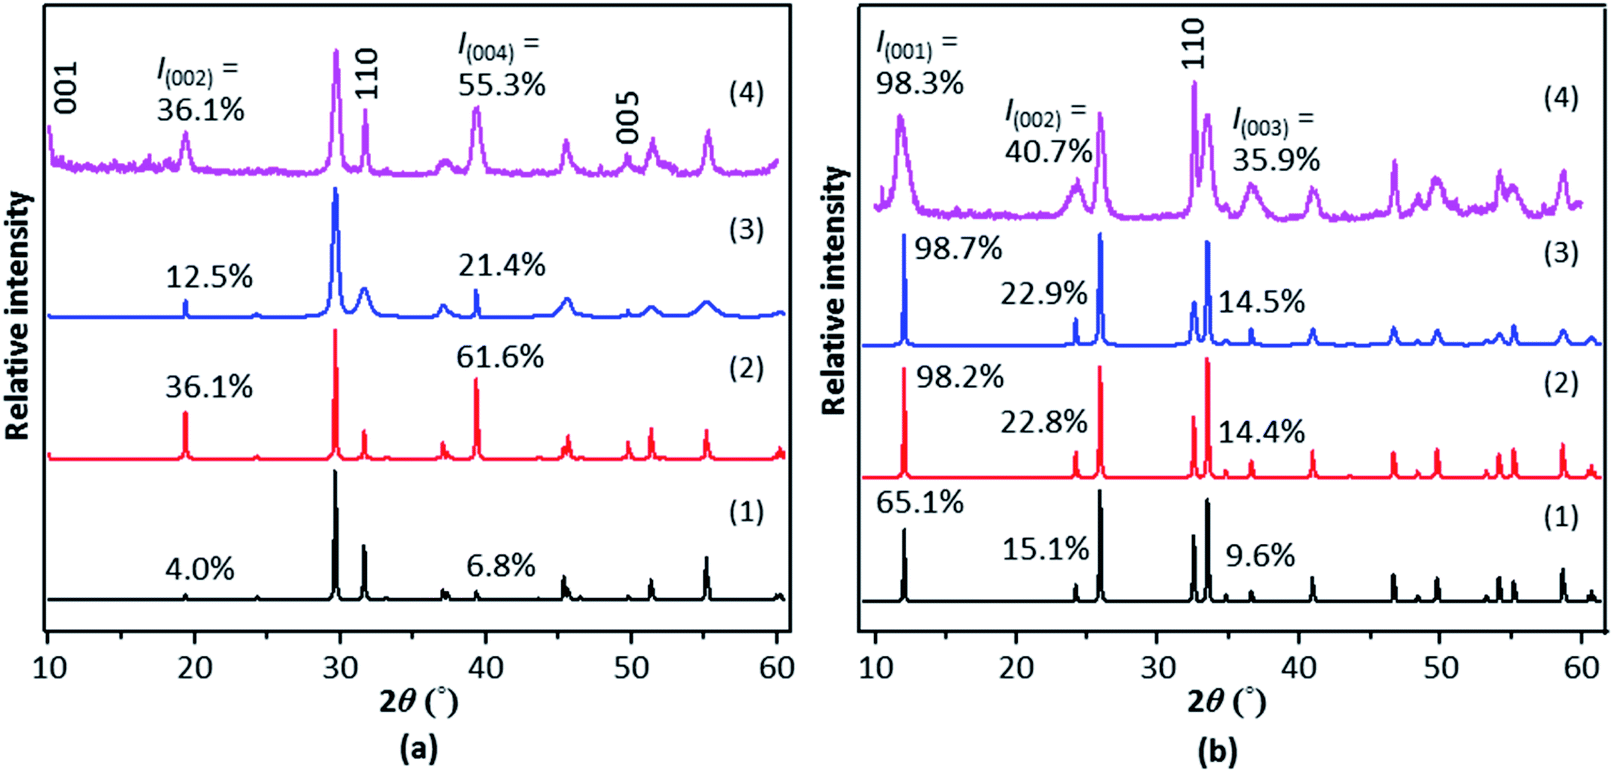 | ||
| Fig. 2 Simulated (1–3) and experimental (4) XRD patterns of (a) BiOI and (b) BiOCl. Patterns 1, bulk samples without preferred orientation or anisotropic broadening; patterns 2, preferred orientation in [001] (March/Dollase parameter = 0.525 and 0.893 for BiOI and BiOCl, respectively); patterns 3, (110) broadening (anisotropic parameter = 8.0 and 1.0 for BiOI and BiOCl, respectively). | ||
To verify the XRD result, transmission electron microscopy experiments were performed. The TEM image of BiOI shows that this sample indeed is composed of plate-shaped structures (Fig. 3a and b). The nanosized thickness of these plates is in line with the broadening of the XRD peaks and implies that the top/bottom surfaces of these nanoplates correspond to the (001) facets. As has been mentioned above, the crystal structure of a material can be studied by using HRTEM. The identity of a set of lattice planes visible in HRTEM images can be resolved by matching the interplanar spacing with the value reported in databases or calculated from XRD data. FFT process of the HRTEM image of a BiOI nanoplate produced three pairs of bright dots with reciprocal distances of 7.145, 10.059, and 14.306 nm−1 (Fig. 3d), indicating that the corresponding lattice planes have spacings of 2.799, 1.988, and 1.398 Å. These values are very close to the theoretical interplanar distances of the (110), (200), and (220) planes for t-BiOI, namely 2.824, 1.997, and 1.412 Å (Powder Diffraction File 00-010-0445), respectively. In the experimental XRD pattern of the BiOI sample, the (110) and (200) peaks are located at 31.7 and 45.5°, which give the interplanar distances of 2.819 and 1.991 Å, respectively, according to the Bragg's law. Additionally, the FFT shows that lattice planes with the reciprocal distance (1/d) of 7.145 nm−1 is parallel to those with 1/d of 14.306 nm−1, which intersect with the planes of 1/d equal to 10.059 nm−1 at an angle of 45° (Fig. 3d). These FFT results are in agreement with the theoretical intersection angles of 0 and 45° between (110) and (220) planes, and (110) and (200) planes, respectively (Fig. 3e). Therefore, it can be concluded that the spots in the FFT correspond to planes belonging to the zone axis [001]. Additionally, lattice planes of this zone axis are confirmed by the FFTs of the HRTEM images of three other BiOI nanoplates (Fig. S7†). Further, the (110) lattice planes, which are perpendicular to the top and bottom surfaces of the BiOI nanoplates, are clearly visible in two of the HRTEM images (insets of Fig. 3c and S7e†). Hence, TEM experiments are able to confirm that the synthesized BiOI sample is composed of nanoplates and has preferentially exposed (001) facets.
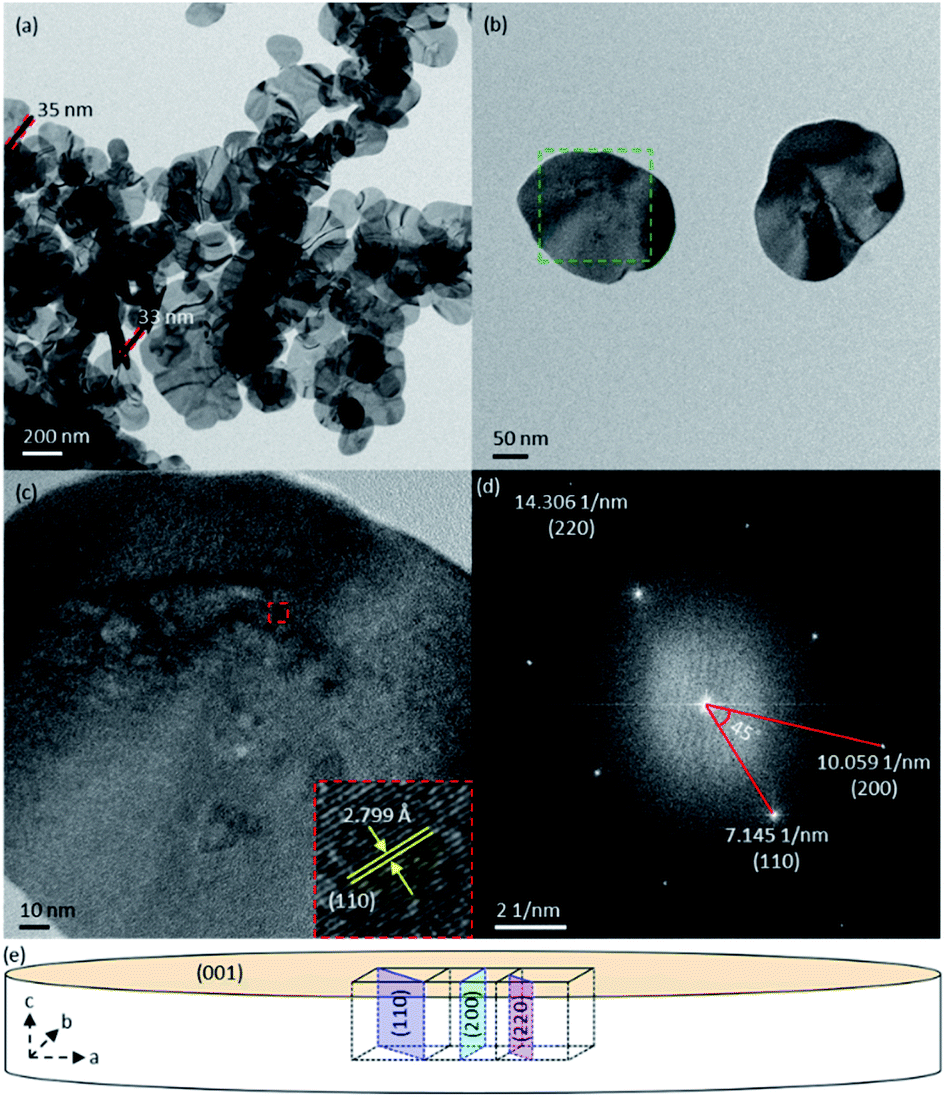 | ||
| Fig. 3 (a and b) TEM images of BiOI, (c) HRTEM image of the green frame-enclosed area in (b) (inset is the magnified image of the area in the red frame), (d) FFT of (c) and (e) illustration of a plate-like BiOI crystal. | ||
The TEM image of BiOCl shows that this sample has similar structural components as BiOI, namely stacks of nanoplates (Fig. S8a†). However, in contrast to the flat structures of BiOI and BiOCl, the BiOBr sample is made up of highly curvy assemblies of nanoplates (Fig. 4a). Despite that, the (001) identity of the top/bottom surfaces of both BiOCl and BiOBr nanoplates was verified by HRTEM images and their FFTs (Fig. 4b–d and S8b–d†), in the same way as has been demonstrated in the case of BiOI.
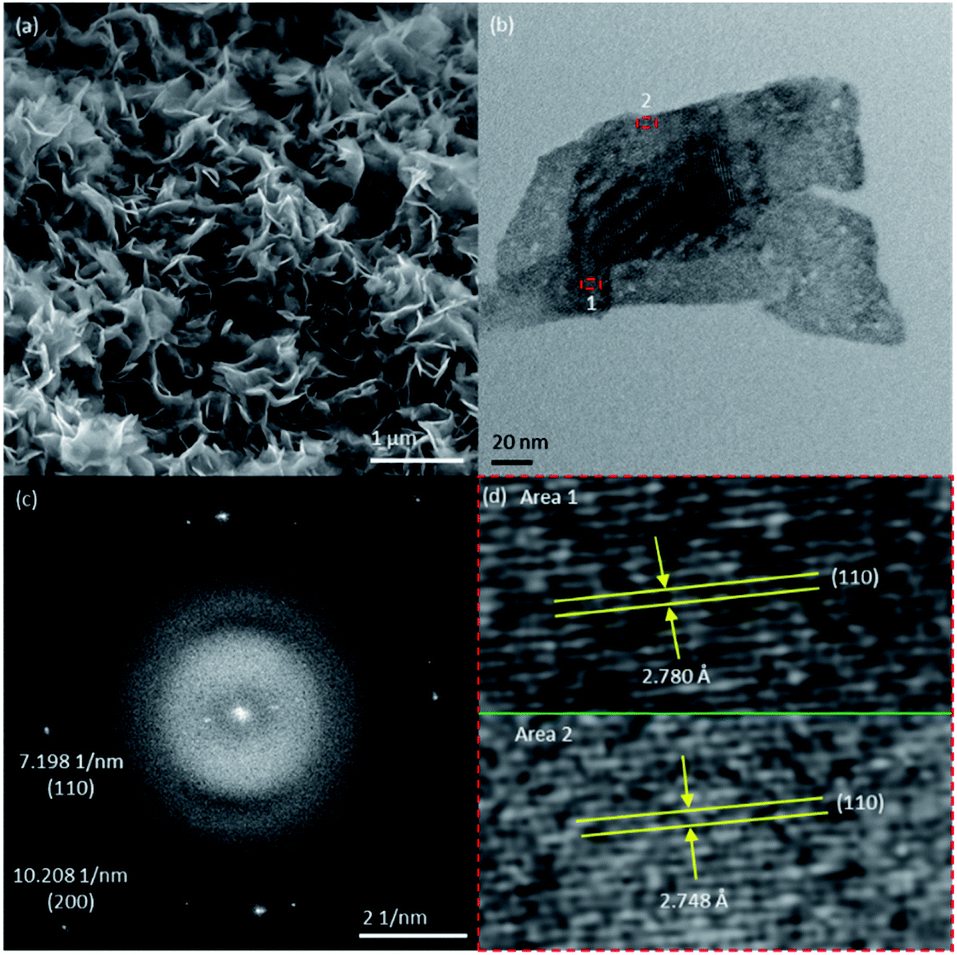 | ||
| Fig. 4 (a) SEM and (b) TEM images of BiOBr, (c) FFT of (b) and (d) magnified images of the red frame-enclosed areas in (b). | ||
4. Conclusions
In brief, BiOX nanoplates have been synthesized by a precipitation method. These materials give XRD patterns with intensified and broadened (001), (002), (003), and (004) peaks. Although doping and vacancy creation related to the constituent anions of BiOX can increase the intensity of the (001) peak moderately without considerable shifting its position, the intensity of other peaks virtually remains unchanged or is even slightly reduced. In contrast, both (110) peak broadening and preferred orientation in the [001] direction result in intensification of all of the aforementioned peaks. However, in the experimental patterns, it is the intensified peaks themselves instead of the (110) peak that are broadened. Therefore, the synthesized BiOX nanoplates have preferentially exposed (001) facets, which was confirmed by HRTEM. The process of facet identification by use of XRD shown in this work is expected to be applicable to other crystalline materials that potentially have largely exposed facets and may be adopted as a general method for the characterization of crystal facets.Conflicts of interest
There are no conflicts to declare.Acknowledgements
L. Z. is thankful to Ms Pramila Ghimire for the help with XRD data collection. The SEM and TEM experiments were conducted at the Characterization Facility of the Liquid Crystal Institute, Kent State University, supported by the Ohio Research Scholars Program Research Cluster on Surfaces in Advanced Materials. The authors thank Dr Min Gao for technical support.Notes and references
- A. Vittadini, A. Selloni, F. Rotzinger and M. Grätzel, Phys. Rev. Lett., 1998, 81, 2954–2957 CrossRef CAS.
- M. Lazzeri, A. Vittadini and A. Selloni, Phys. Rev. B: Condens. Matter Mater. Phys., 2001, 63, 155409 CrossRef.
- H. G. Yang, C. H. Sun, S. Z. Qiao, J. Zou, G. Liu, S. C. Smith, H. M. Cheng and G. Q. Lu, Nature, 2008, 453, 638–641 CrossRef CAS PubMed.
- S. W. Liu, J. G. Yu and M. Jaroniec, Chem. Mater., 2011, 23, 4085–4093 CrossRef CAS.
- J. S. Chen, Y. L. Tan, C. M. Li, Y. L. Cheah, D. Luan, S. Madhavi, F. Y. C. Boey, L. A. Archer and X. W. Lou, J. Am. Chem. Soc., 2010, 132, 6124–6130 CrossRef CAS PubMed.
- A. Fujishima, X. Zhang and D. A. Tryk, Surf. Sci. Rep., 2008, 63, 515–582 CrossRef CAS.
- L. Zhang, J. Ran, S.-Z. Qiao and M. Jaroniec, Chem. Soc. Rev., 2019, 48, 5184–5206 RSC.
- Y. Bi, S. Ouyang, N. Umezawa, J. Cao and J. Ye, J. Am. Chem. Soc., 2011, 133, 6490–6492 CrossRef CAS PubMed.
- L. Wang, J. Wan, Y. Zhao, N. Yang and D. Wang, J. Am. Chem. Soc., 2019, 141, 2238–2241 CrossRef CAS PubMed.
- M. Guan, C. Xiao, J. Zhang, S. Fan, R. An, Q. Cheng, J. Xie, M. Zhou, B. Ye and Y. Xie, J. Am. Chem. Soc., 2013, 135, 10411–10417 CrossRef CAS PubMed.
- Y. Li, R. Hu, X. Zhang, Z. Yin, J. Qiu, Z. Yang and Z. Song, Nanoscale, 2018, 10, 4865–4871 RSC.
- J. Jiang, K. Zhao, X. Xiao and L. Zhang, J. Am. Chem. Soc., 2012, 134, 4473–4476 CrossRef CAS PubMed.
- Y. Chen, M. Wen and Q. Wu, CrystEngComm, 2011, 13, 3035–3039 RSC.
- X. Xue, R. Chen, H. Chen, Y. Hu, Q. Ding, Z. Liu, L. Ma, G. Zhu, W. Zhang and Q. Yu, Nano Lett., 2018, 18, 7372–7377 CrossRef CAS PubMed.
- X. Xiao and W.-D. Zhang, J. Mater. Chem., 2010, 20, 5866–5870 RSC.
- M. Pan, H. Zhang, G. Gao, L. Liu and W. Chen, Environ. Sci. Technol., 2015, 49, 6240–6248 CrossRef CAS PubMed.
- E. Zolotoyabko, J. Appl. Crystallogr., 2009, 42, 513–518 CrossRef CAS.
- W. J. Kim, D. Pradhan, B.-K. Min and Y. Sohn, Appl. Catal., B, 2014, 147, 711–725 CrossRef CAS.
- T. Kato, Y. Hakari, S. Ikeda, Q. Jia, A. Iwase and A. Kudo, J. Phys. Chem. Lett., 2015, 6, 1042–1047 CrossRef CAS PubMed.
- T. R. Gordon, M. Cargnello, T. Paik, F. Mangolini, R. T. Weber, P. Fornasiero and C. B. Murray, J. Am. Chem. Soc., 2012, 134, 6751–6761 CrossRef CAS PubMed.
Footnote |
| † Electronic supplementary information (ESI) available. See DOI: 10.1039/d0ra00769b |
| This journal is © The Royal Society of Chemistry 2020 |