 Open Access Article
Selection of potential aptamers for specific growth stage detection of Yersinia enterocolitica
Muhammad Shoaib abe,
Aamir Shehzadef,
Omar Mukamaad,
Husnain Raza
 ace,
Sobia Niaziabe,
Imran Mahmood Khan
 abe,
Barkat Alia,
Wasim Akhtarabe and
Zhouping Wang
 *ab
*ab
aSchool of Food Science and Technology, Jiangnan University, Wuxi 214122, People's Republic of China. E-mail: wangzp@jiangnan.edu.cn
bSynergetic Innovation Center of Food Safety and Nutrition, Jiangnan University, Wuxi 214122, People's Republic of China
cSchool of Food and Biological Engineering, Jiangsu University, Zhenjiang, Jiangsu 212013, People's Republic of China
dDepartment of Biology, College of Science and Technology, University of Rwanda, Avenue de l'armée, P. O. Box: 3900 Kigali, Rwanda
eNational Institute of Food Science and Technology, FFNHS, University of Agriculture, Faisalabad, 38040, Pakistan
fUniLaSalle, Univ. Artois, EA7519 - Transformations & Agro-ressources, Normandie Université, F-76130 Mont-Saint-Aignan, France
First published on 30th June 2020
Abstract
Yersinia enterocolitica remains a threat to public health, and a sensitive detection method is a prerequisite due to its complicated diagnosis associated with slow growth. Recently, aptamer-based detection systems have played a vital role in the development of simple, rapid, sensitive, and specific detection methods. Herein, highly specific ssDNA aptamers were screened against Y. enterocolitica at the different growth stages by whole cell-SELEX. Cells at different growth stages were harvested and incubated with an ssDNA library to get an enriched pool of specific aptamer candidates. After the 10th round of SELEX, the enriched pool was sequenced and grouped into seven families based on homology and similarity of the secondary structure. Flow cytometry analysis revealed that the aptamers M1, M5, and M7 with Kd values of 37.93 ± 7.88 nM, 74.96 ± 21.34 nM, and 73.02 ± 18.76 nM had the highest affinity and specificity to the target, respectively. The selected aptamers showed binding to the different growth stages of Y. enterocolitica with a significant increase in the gated fluorescence. Our aptamer selection strategy is convenient, and the developed aptamer can be useful for an accurate and reliable detection system.
1. Introduction
Y. enterocolitica is a Gram-negative, enteropathogen responsible for gastrointestinal infections.1,2 Y. enterocolitica is distributed in many food items like dairy products, raw meat (beef, pork, and lamb), sausages,3 poultry, vegetables, bean sprouts, tofu, seafood, stewed mushroom, chocolate milk,4 and ready-to-eat vegetable salad,5 and have been widely considered as prime sources of the pathogen.6,7 Animals like rodents, horses, rabbits, dogs, sheep, cattle, pork, and cats are primary reservoirs,8,9 while other food products may obtain it through contamination. Y. enterocolitica infection occurs more frequently in winter because it can grow at refrigeration temperature and can easily contaminate refrigerated food products.10 In the past few decades, many outbreaks of Yersiniosis (characterized as ileitis, mesenteric lymphadenitis, mimicking appendicitis, enterocolitis, pseudoappendicitis, and septicemia) have been reported worldwide.11–14 The Center for Diseases Control and Preventions (CDC) reported that Yersinia enterocolitica infections depend on the immunity and age of infected persons. The most common symptoms in children are high fever, abdominal pain, bloody diarrhea, skin rash, and joint pains, which start after 4–7 days upon exposure and lasts for 1–3 weeks. If the severity of these conditions prevails for a longer period leads to high mortality.15 The most affected regions are in Australia, Sweden, India, Hungary, United States, Norway, and China.16–20 According to a report in China, among ∼30% of the ready to eat food samples were found positive.9,21,22Various conventional approaches, such as polymerase chain reaction (PCR),23 enzyme-linked immunochromatographic assay (ELISA),24 and culture methods,7 have been commonly employed to detect Y. enterocolitica. Although these methods have been reported, most of them are complicated, time-consuming, and unreliable due to their complexity, operating conditions, and cost. Therefore, developing an aptamer-based diagnostic could be critical for the rapid, sensitive, and specific detection of Y. enterocolitica.
Aptamers are emerging nucleotides that promise a timely detection of the pathogen.25–27 They can easily be selected using SELEX (Systematic Evolution of Ligand by Exponential Enrichment) against targets both their native conformation and mild physiological changes.28 Since Szostak's group and Gold's group introduced the SELEX technique, many different forms of the SELEX procedure had been developed.29–32 Aptamers are selected from a random nucleic acid library using a specific target by repeated rounds of binding, separation, and amplification. In the selection process, the crucial step is to separate the target-bound ssDNA from the random nucleic acid library.32,33 Currently, various SELEX approaches such as immobilization-free are in use without relying on magnetic beads,34,35 capillary electrophoresis,36,37 and surface plasmon resonance (SPR),26,38–40 some new methods have also been established such as and structure-switching SELEX. However, as for bacteria, the whole-cell SELEX has emerged as a conventional SELEX approach and has been applied for highly specific aptamers selection.26,28,41 Bacteria growth is associated with the expression of intra- and extra-cellular molecules, leading to morphological and physiological bacterial cell changes. The sequence of bacterial modifications occurs due to controlled host growth, defense mechanism, or environmental factors.42 Therefore, typical characteristics may hinder aptamer specificity due to the availability of different binding sites. The selection of single aptamer for the small molecules (proteins or toxins) can provide more accurate results as compared to large molecules.43–45 In some cases, simultaneous targeting of several sites of the whole bacterial cell may increase the sensitivity of detection.46 At the same time, combining multiple aptamers will not increase the probability of false-positive results by synergistic addition of cross-reactivity of aptamers, when each aptamer shows no cross-reactivity to specimens of closely related species, thus maintaining the specificity of the detection.
Herein, we selected for the first time more specific and versatile aptamers that can target three growth stages of the bacterial cells using whole cell-SELEX process, characterized by ten rounds of SELEX and three rounds of counter-selection (4th, 6th, and 8th). The selected aptamers minimize the possibility of false results and could be applied for the detection of Y. enterocolitica in food samples.
2. Materials and methods
2.1. Bacterial strains and cultures
Yersinia enterocolitica CICC 21669 target, 3 Gram-positive bacteria (Staphylococcus aureus ATCC 29213, Bacillus cereus, Listeria monocytogenes) and 3 Gram-negative bacteria (Salmonella typhimurium ATCC 14028, Shigella dysenteriae, Escherichia coli ATCC 25922) were purchased from China Center of Industrial Culture Collection (CICC). The target was cultured on media (5 g NaCl, 3 g beef extract and 5 g peptone and 15 g agar per 1000 mL at pH 7.2–7.4) at 26 °C and harvested at different OD600 readout values (0.3, 0.6, and 0.9). The strains used in counter selections were cultured on Luria–Bertani (LB) culture medium (10 g peptone, 5 g NaCl, and 5 g yeast extract per 1000 mL, pH 7.2–7.4) and harvested at when the OD value reached at 0.3. All the liquid cultures were shaken at 120 rpm, and the temperature was maintained at 26 °C and 37 °C for target and counter bacteria respectively.2.2. Reagent and apparatus
The initial ssDNA library and primers were obtained from Integrated DNA Technologies (IDT) (Coralville, IA). All PCR reagents were purchased from Sangon (Shanghai, China), and tRNA was purchased from Sigma. All PCR amplifications were carried out using a Bio-Rad C-1000 Thermal Cycler (California USA). An Eppendorf 5430R centrifuge (USA) was used for all purification steps. Flow cytometric analyses were performed at the facilities available at State Key Laboratory of Jiangnan University, Wuxi, Jiangsu, China.2.3. DNA library
An 80 bases oligonucleotide single-stranded DNA library was consisting of 40 bases randomized region flanked on both sides by 20 bases primer regions was used. The primers used to amplify the ssDNA library and subsequent aptamer pools have the following sequences “AGCAGCACAGAGGTCAGATG-40 bases-TTCACGGTAGCACGCATAGG” DNA library or aptamer pools were rendered into single strands via heat denaturation at 95 °C for 10 min in 1× binding buffer and then snapped cooled on ice for 10 min.2.4. Whole-cell SELEX
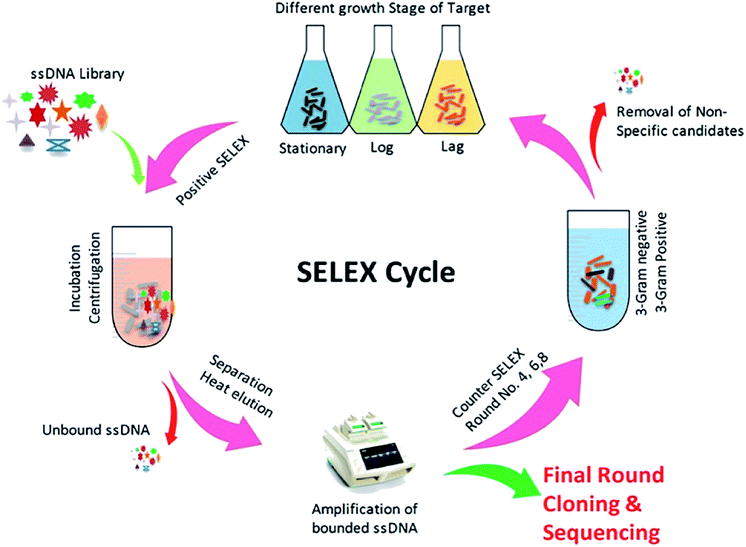
The SELEX procedure used in this work was based on a method developed by Duan et al. with several modifications (Fig. 1).47 Y. enterocolitica was grown overnight in liquid culture and harvested upon reaching at different growth stages (OD600: 0.3, 0.6, and 0.9). The cells were taken in equal ratio 1![[thin space (1/6-em)]](https://www.rsc.org/images/entities/char_2009.gif) :
:![[thin space (1/6-em)]](https://www.rsc.org/images/entities/char_2009.gif) 1
1![[thin space (1/6-em)]](https://www.rsc.org/images/entities/char_2009.gif) :
:![[thin space (1/6-em)]](https://www.rsc.org/images/entities/char_2009.gif) 1 with 108 cfu mL−1 each, and centrifuged at 3500 rpm at 4 °C to remove the media contents and subsequently washed three times in 1× binding buffer (1× BB) (50 mM Tris–HCl (pH 7.4), 5 mM KCl, 100 mM NaCl, and 1 mM MgCl2) at room temperature. The ssDNA library consisted of a central randomized sequence of 40 bases flanked by two primer hybridization sites (“AGCAGCACAGAGGTCAGATG-40 bases-TTCACGGTAGCACGCATAGG”). SELEX was started from ssDNA library (2 nmol), which was denatured by heating at 95 °C for 10 min and subsequently cooled on ice for 10 min. The denatured ssDNA library was incubated with bacterial cells (108 cfu mL−1) in 1× BB at a controlled condition (26 °C, 120 rpm, 90 min). The tRNA and bovine serum albumin (BSA) were also added to the system to avoid the unspecific binding. After incubation, the unbound ssDNA was removed by washing the cells with 1 mL of 1× BB containing 0.05% BSA and by centrifugation at 4 °C, 5000 rpm for 5 min. The bound ssDNA aptamers were eluted by heating the bacteria-bound aptamer complexes at 95 °C for 10 min and cooling them for 10 min on ice. The mixture was centrifuged as described above, and the supernatant containing aptamers that had an affinity to Y. enterocolitica was isolated. The collected fractions served as PCR amplification templates. A 50 μL PCR mixture was consisted of 2 μL ssDNA template, 1 μL forward primer (10 μM), 1 μL reverse primer (5 μM), 1 μL dNTP (5 mM), 0.5 μL Taq DNA polymerase (5 U μL−1), 1× PCR buffer and added ultra-pure water up to the final volume. The mixture was incubated in the thermocycler at 95 °C for 5 min for denaturation, followed by 16 cycles of denaturation at 95 °C for 30 s, annealing at 60 °C for 30 s, extension at 72 °C for 30 s, and a final extension step at 72 °C for 5 min. The PCR products were separated by 8% PAGE gel electrophoresis in 1× TAE (Triacetate EDTA) buffer at 60–120 V. After Gel-red staining, the gel was photographed under UV to confirm the 80 bp size of the PCR product. All PCR products were purified using a Qiagen MinElute PCR Purification Kit (Qiagen Inc., Valencia, CA). After purification, the phosphorylated reverse strand was digested by using λ-exonuclease to provide ssDNA pool for the next round of SELEX. The concentration of PCR products was measured by nano-drop spectrophotometer in order to adjust the quantity λ-exonuclease and exonuclease buffers. The digestion was carried out at 37 °C for 30 minutes, and the products were identified using 8% denaturing PAGE, and the obtained product was purified using the phenol/chloroform method. Negative controls consisting of cells incubated with all medium components, but without the oligonucleotide, libraries were prepared for each round of selection. The counter-selection against a mixture of related intact pathogenic bacteria, including B. cereus, S. dysenteriae, L. monocytogenes, S. typhimurium, S. aureus, and E. coli, was introduced in the 4th, 6th, and 8th rounds, respectively, to ensure that the selected aptamers maintain high species specificity for the target. After the 10th round of selection, the enriched ssDNA aptamer pool was PCR amplified, and the products were cloned and sequenced. The obtained aptamer sequences were analyzed using the DNAMAN software package, and the secondary structure was predicted using RNA Structure v4.60. At each round of selection, we improve the affinity and specificity by reducing the amount of input ssDNA (2 nmol to 100 pmol) and by progressively increasing the amount of tRNA and BSA (from a 20-fold molar excess of each in the initial round to a maximum of 80-fold molar excess in round eight). Increased amounts of BSA/tRNA increased the competition between the desired targets (cells) and non-targets (BSA molecules) for the aptamer molecules, tRNA competes with the aptamer sequences for target binding sites, leading to higher specificity. Between each incubation, wash, and elution step, the resuspended cell solution was transferred to a fresh centrifuge tube to eliminate aptamers bound to the tube wall.
1 with 108 cfu mL−1 each, and centrifuged at 3500 rpm at 4 °C to remove the media contents and subsequently washed three times in 1× binding buffer (1× BB) (50 mM Tris–HCl (pH 7.4), 5 mM KCl, 100 mM NaCl, and 1 mM MgCl2) at room temperature. The ssDNA library consisted of a central randomized sequence of 40 bases flanked by two primer hybridization sites (“AGCAGCACAGAGGTCAGATG-40 bases-TTCACGGTAGCACGCATAGG”). SELEX was started from ssDNA library (2 nmol), which was denatured by heating at 95 °C for 10 min and subsequently cooled on ice for 10 min. The denatured ssDNA library was incubated with bacterial cells (108 cfu mL−1) in 1× BB at a controlled condition (26 °C, 120 rpm, 90 min). The tRNA and bovine serum albumin (BSA) were also added to the system to avoid the unspecific binding. After incubation, the unbound ssDNA was removed by washing the cells with 1 mL of 1× BB containing 0.05% BSA and by centrifugation at 4 °C, 5000 rpm for 5 min. The bound ssDNA aptamers were eluted by heating the bacteria-bound aptamer complexes at 95 °C for 10 min and cooling them for 10 min on ice. The mixture was centrifuged as described above, and the supernatant containing aptamers that had an affinity to Y. enterocolitica was isolated. The collected fractions served as PCR amplification templates. A 50 μL PCR mixture was consisted of 2 μL ssDNA template, 1 μL forward primer (10 μM), 1 μL reverse primer (5 μM), 1 μL dNTP (5 mM), 0.5 μL Taq DNA polymerase (5 U μL−1), 1× PCR buffer and added ultra-pure water up to the final volume. The mixture was incubated in the thermocycler at 95 °C for 5 min for denaturation, followed by 16 cycles of denaturation at 95 °C for 30 s, annealing at 60 °C for 30 s, extension at 72 °C for 30 s, and a final extension step at 72 °C for 5 min. The PCR products were separated by 8% PAGE gel electrophoresis in 1× TAE (Triacetate EDTA) buffer at 60–120 V. After Gel-red staining, the gel was photographed under UV to confirm the 80 bp size of the PCR product. All PCR products were purified using a Qiagen MinElute PCR Purification Kit (Qiagen Inc., Valencia, CA). After purification, the phosphorylated reverse strand was digested by using λ-exonuclease to provide ssDNA pool for the next round of SELEX. The concentration of PCR products was measured by nano-drop spectrophotometer in order to adjust the quantity λ-exonuclease and exonuclease buffers. The digestion was carried out at 37 °C for 30 minutes, and the products were identified using 8% denaturing PAGE, and the obtained product was purified using the phenol/chloroform method. Negative controls consisting of cells incubated with all medium components, but without the oligonucleotide, libraries were prepared for each round of selection. The counter-selection against a mixture of related intact pathogenic bacteria, including B. cereus, S. dysenteriae, L. monocytogenes, S. typhimurium, S. aureus, and E. coli, was introduced in the 4th, 6th, and 8th rounds, respectively, to ensure that the selected aptamers maintain high species specificity for the target. After the 10th round of selection, the enriched ssDNA aptamer pool was PCR amplified, and the products were cloned and sequenced. The obtained aptamer sequences were analyzed using the DNAMAN software package, and the secondary structure was predicted using RNA Structure v4.60. At each round of selection, we improve the affinity and specificity by reducing the amount of input ssDNA (2 nmol to 100 pmol) and by progressively increasing the amount of tRNA and BSA (from a 20-fold molar excess of each in the initial round to a maximum of 80-fold molar excess in round eight). Increased amounts of BSA/tRNA increased the competition between the desired targets (cells) and non-targets (BSA molecules) for the aptamer molecules, tRNA competes with the aptamer sequences for target binding sites, leading to higher specificity. Between each incubation, wash, and elution step, the resuspended cell solution was transferred to a fresh centrifuge tube to eliminate aptamers bound to the tube wall.
2.5. Evaluation of affinity and specificity by flow cytometer
The affinity and specificity of the individual selected seven aptamers against the Y. enterocolitica was measured using the BD FACS caliber flow cytometer and CellQuest software. The individual aptamer was synthesized with a FAM fluorescent label attached to the 5′ end (IDT). In the assays, the fluorescently labeled aptamer pool (0–300 nM) was heated at 95 °C as in SELEX process and incubated with 108 cfu mL−1 of Y. enterocolitica cells in 500 μL 1× BB buffer at 26 °C for 90 min, same as in the SELEX process. The cells were then washed in 1× BB buffer, collected by centrifugation, and resuspended in 500 μL 1× BB buffer and immediately analyzed by the flow cytometry. The side forward scatters, and gated fluorescence intensity was measured above background (cells with no aptamers). The fluorescently labeled ssDNA library was used as a control for nonspecific binding in each experiment. Binding curves created by varying the aptamer concentration (0–300 nM) with a fixed number of cells (108 cfu mL−1) were used to estimate the Kd values. Graph Pad Prism 5.0 software was used to fit a non-linear regression curve from which the Kd values were calculated. The specificity of the aptamer was measured by incubating the 100 nM of each aptamer with 3 Gram-negative bacteria (Bacillus cereus, Shigella dysenteriae, and Listeria monocytogenes) and 3 Gram-positive bacteria (Salmonella typhimurium ATCC 14028, Staphylococcus aureus ATCC 29213, Escherichia coli ATCC 25922) individually and analyzed by flow cytometry.2.6. Synergetic analysis of the selected aptamers
The structural differences of the aptamer candidates and the presence of loops, hairpins suggest that the aptamers can bind at different sites of the target bacterial cells with different binding mechanisms. This phenomenon, either the selected candidates have familiar or different binding sites on the target. The combinations (M1 + M5, M1 + M7, M5 + M7, M1 + M2 + M7) of the three-selected aptamer (150 nM) were analyzed by incubating them with a fixed number of bacterial cells (108 cfu mL−1) same as performed in SELEX process, and the gated fluorescence intensity was measured by flow cytometer.2.7. Growth stages affinity analysis
To evaluate either the selected aptamer candidate can bind to different growth stages of the target, the target cells were harvested at different growth stages (lag, log, and stationary phase) with OD600 of 0.3, 0.6, and 0.9, as we harvested during the SELEX process. After that, a fixed number of bacterial cells (108 cfu mL−1) from each growth stage were incubated with 150 nM of each selected aptamers candidate (M1, M5 and M7) and analyzed by flow cytometry according to ref. 48.2.8. Morphological based binding analysis
The morphological characteristic and pathogenicity of the Y. enterocolitica highly depends on its growth temperature. It has been documented, Y. enterocolitica have flagellum and motile when grown at lower temperature 26 °C, but non-motile when grown at higher temperature 37 °C. Besides that, it is highly responsive to the growth temperature, and the rise in growth temperature induces more expression of the virulence factors and induces multiple changes in the morphology of the bacterial cells. Y. enterocolitica produces more invasion proteins, which binds with β1-integrin49 and helps the bacterial cell to attach with an epithelial layer of the host and possess pathogenicity.9,50 The morphological characteristic of the cells can be profoundly changed by changing the growth temperature. Therefore, to evaluate the binding of aptamers at different growth stages of bacterial cells, we analyzed the selected aptamers binding to Y. enterocolitica cells at different temperatures (26 °C and 37 °C). The grown cells (108 cfu mL−1) at different temperatures were harvested (OD600 0.3, 0.6, 0.9), mixed with 150 nM of each selected aptamer, and incubated at 37 °C.2.9. Statistical analysis
Unless otherwise stated, the analysis was performed using Excel, and presented data are mean ± SE of the triplicate samples from three independent experiments. Student's T-test was considered significant at *p < 0.05.3. Results and discussion
3.1. Aptamer selection
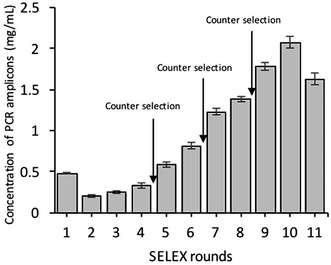
As shown in (Fig. 1), the whole-cell SELEX technique was used for the screening of aptamers, and highly specific aptamers against Y. enterocolitica was obtained after ten rounds of selection. In each selection round, the target was incubated with a pre-rendered single standard ssDNA aptamer library. As in early researches, aptamers were selected against the only one growth stage of the target bacteria. But due to the antigenic expression of bacteria, different growth stages, binding sites, and other factors may lead to false results in the detection of bacteria.9,46,49,50 To improve the applicability of the selected aptamer in real food samples, we chosen three different growth stages of the target bacteria at different OD600 readout values (0.3, 0.6, 0.9). After the incubation of target bacterial cells with the aptamer pool, the unbound aptamers library was removed by centrifugation and washing. In each round of selection, the binding aptamer fractions were heat eluted, amplified. Gel electrophoresis showed an expected band of 80 bases, which also confirmed specific amplification of the aptamer pool that can bind with the target cell (Fig. 9 and 10).As shown in Fig. 2, the corresponding concentrations of purified PCR products at the same parameters of amplification. To ensure the ssDNA library capacity, 2 nmol of DNA library was added in the initial round, which resulted in a higher concentration of the PCR products. While 100 pmol of the ssDNA concentration was used in second round and which was reduced to 10 pmol in the tenth round of selection. But the purified PCR products were gradually increased up to 2 mg mL−1 in the tenth round. Further, it starts decreasing in the 11th round, which indicates that the ssDNA had been successfully enriched (Fig. 11).
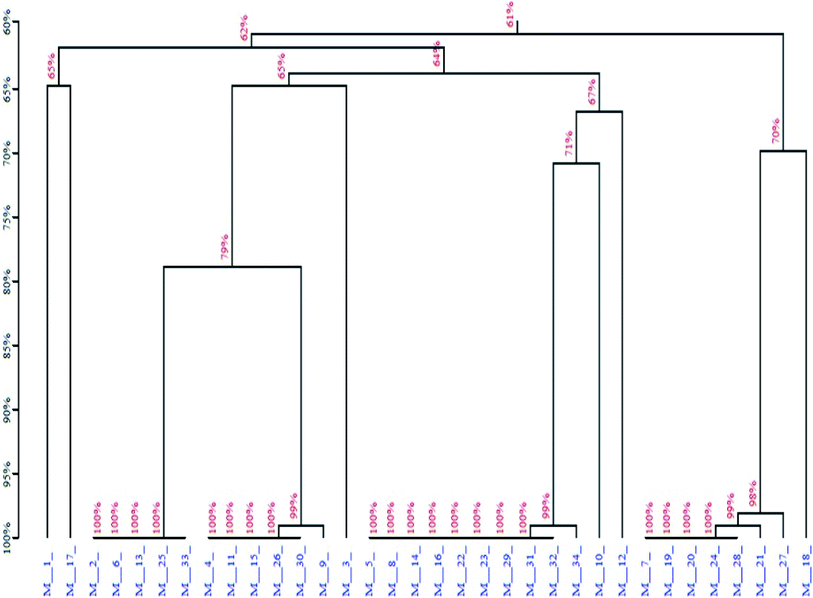
Next, the PCR products from the tenth were cloned and sequenced. A total of 36 sequences were obtained, which were divided among seven families according to DNA sequence homology (Fig. 12) and similarity of secondary structure. Analysis of all sequences, both with and without primers, revealed minimal sequence repetition with many sequences containing higher GC content, which is indicative of secondary structure formation. Based on the analysis, seven sequences were chosen for further screening by not only their repetitiveness but also on their predicted secondary structure. Consistent with previous reports,51,52 we observed loops and hairpins from M1, M5, M7 aptamers, indicating that the selected aptamers possessed the ability to bind to special sites of the target (Fig. 3).
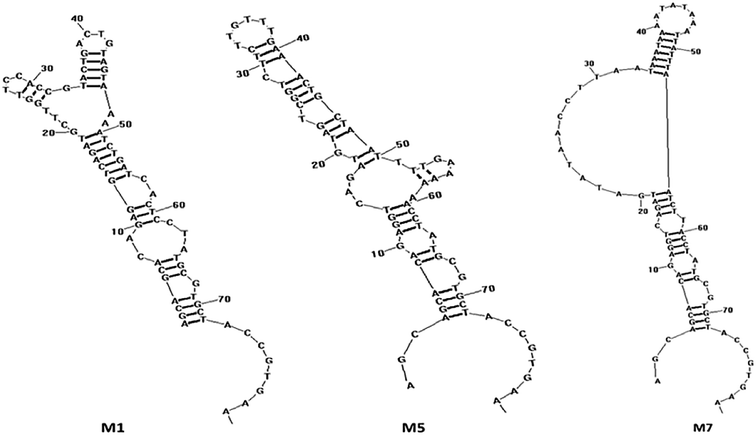 | ||
| Fig. 3 The secondary structure of the aptamers M1, M5 and M7 predicted by RNA structure software v4.60. | ||
3.2. Determination of aptamer binding affinity
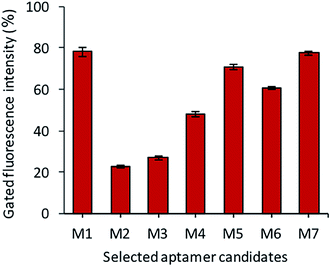
After the sequencing and structural analysis, the seven sequences were selected and analyzed for binding. All the chosen aptamer candidates were fluorescently labeled, incubated with Y. enterocolitica cells and analyzed by flow cytometry. Among the seven candidates, three candidates (M1, M5 and M7) showed maximum gated fluorescence above the background, which demonstrated a high binding ability of the selected candidates to the Y. enterocolitica as compared to control and other chosen candidates (Fig. 4). A similar binding affinity curve was obtained by spectrophotometric analysis (data not shown).The binding affinity of each candidate was determined by conducting the series of binding analysis using different concentrations of aptamers (0–400 nM) and a constant number of bacterial cells (108 cfu mL−1). The binding assay results were utilized to draw the saturation curve and dissociation constant (Kd) of each aptamer by non-linear regression analysis by using Graph Pad Prism Software 5.0 (Fig. 5). Among the sequences, M1, M5 and M7 exhibited higher fluorescence intensities with 79, 70, and 77%, respectively, which was above the background.
 | ||
| Fig. 5 Non-linear regression curves of aptamers (M1, M5 and M7) binding to 108 cfu mL−1 of Y. enterocolitica analyzed by Graph Pad Prism Software 5.0. | ||
Fig. 5 shows a representative binding saturation curve from the flow cytometric analysis of the different concentrations of fluorescently labeled aptamer candidates (0–300 nM) binding to 108 cfu mL−1 of Y. enterocolitica. The non-linear regression curve fit revealed Kds of M1, M5 and M7 were 37.93 ± 7.88, 74.96 ± 21.34 and 73.02 ± 18.76 nM, respectively, which corresponded to the fluorescence intensity. However, M1 Kd value was low as compared to the M5 and M7 aptamer candidates. This activity was not observed in the binding of a fluorescently labeled randomized oligonucleotide library to Y. enterocolitica cells, confirming the high specificity of M1 aptamer. All the 3 tested aptamer sequences (Table 1) exhibited saturation binding kinetics, which corroborated with the predicted secondary structures of the aptamers against Y. enterocolitica.
| Aptamers | Sequences |
|---|---|
| M1 | AGCAGCACAGAGGTCAGATGATATAACCTTAATAAATAAAATATAAATTATTTAATCTTACCTATGCGTGCTACCGTGAA |
| M5 | AGCAGCACAGAGGTCAGATGCTTGGTTCCACCGTACTGACTGTAGTAAAATCTGATCACTCCTATGCGTGCTACCGTGAA |
| M7 | AGCAGCACAGAGGTCAGATGTAGTCGGTCTTCTTGTTTGAAACTGCTAATTTTGAAAAAACCTATGCGTGCTACCGTGAA |
3.3. Determination of aptamer specificity
For specificity assay, the selected candidates were then tested against the three strains of Gram-negative (Salmonella typhimurium ATCC 14028, Shigella dysenteriae, Escherichia coli ATCC 25922) and positive pathogens including (Staphylococcus aureus ATCC 29213, Bacillus cereus, and Listeria monocytogenes). The analysis revealed that all the selected candidates have the preferential binding to the target bacteria over non-target. The candidate M5 showed low specificity, and more binding to the non-target bacteria as compared to the other candidates (Fig. 6). The candidate M1 and M7 also showed more affinity and specificity to the target bacteria over the non-target bacteria.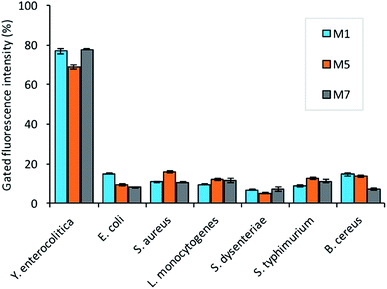 | ||
| Fig. 6 The selectivity assay of the aptamers (150 nM) binding against 108 cfu mL−1 non-target bacteria (B. cereus, S. dysenteriae, L. monocytogenes, S. typhimurium, S. aureus, and E. coli). | ||
3.4. Cocktail analysis of selected aptamers
In the current investigation, we wondered if the selected aptamers either binds at the same or different sites on the target cell. As well-known, the binding ability of aptamers depends on the free energy, GC contents, hairpin and loops in the secondary structure of the aptamers.53 All these characteristics are different for all the candidates; thus, they may have various binding sites. The synergic analysis was performed, and combinations of selected aptamers were incubated against the target cells. The flow cytometric analysis shows that the gated fluorescence increased significantly if the cocktail of the aptamers is used as compared to the single aptamer. As shown in Fig. 7, the cocktail of aptamers enhanced the detection signals with less false-positive results. This effect can be attributed to that aptamer candidates can possess their own or common binding sites.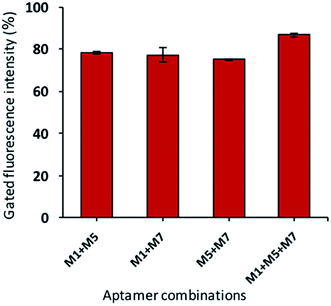 | ||
| Fig. 7 The synergic binding assay of selected aptamers (aptamer total concentration of 150 nM with equal ratio and bacteria concentration of 108 cfu mL−1). | ||
3.5. Growth phase and aptamers binding
To identify the affinity of the aptamers, each bacteria growth phase at different OD600 readout (0.3, 0.6, 0.9) was incubated with a fluorescently labeled aptamer pool. As shown in Fig. 8, the result shows that all aptamers M1, M5, M7 has good affinity to all different stages of bacteria (adjustment phase, log phase, and pre-stationary phase).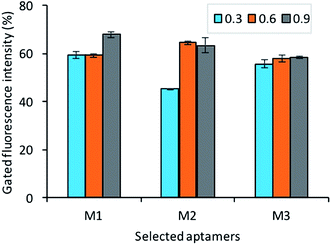 | ||
| Fig. 8 The assessment of selected aptamer's binding with different growth stages OD600 (0.3, 0.6, 0.9) of Y. enterocolitica (aptamer concentration 150 nM, bacteria concentration 108 cfu mL−1). | ||
3.6. Cell morphology and aptamer binding
Typically, it's considered that the aptamers can be selected without any prior knowledge about the target. Still, according to the current investigation, we tried to evaluate the importance and how the above information can affect the selection, binding, and development of detection system respective targets. The growth stages and temperature of the Y. enterocolitica mainly regulates virulence factors expression and morphological changes. One example of a temperature-dependent trait is the expression of the lipopolysaccharide (LPS) O-polysaccharide (OPS), which could provide the new binding sites for binding for aptamers. This will help us to understand the binding mechanism and about the binding sites. The flow cytometric analysis revealed that the growth temperature of the Y. enterocolitica changed the morphological characteristics of the cell, causing the aptamers to lose their affinity towards the target (Fig. 9). The aptamers M1, M5 and M7 showed less binding when they were incubated with the cells grown at a higher temperature. The binding ability of the aptamers was decreased significantly due to a change in the morphology of the target cell.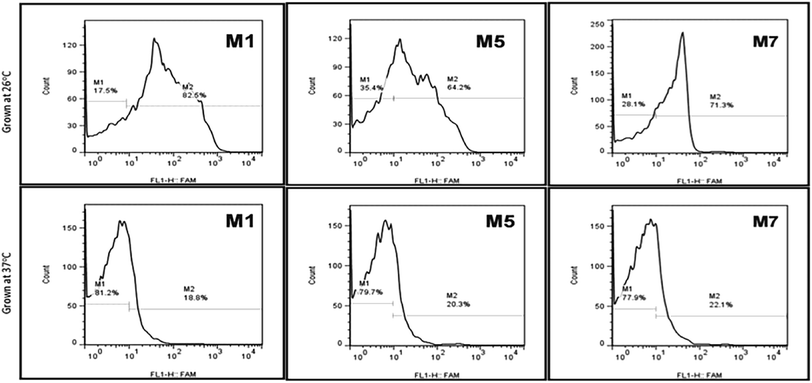 | ||
| Fig. 9 Aptamer binding with Y. enterocolitica cells having different morphological features by flow cytometry (top: motile, bottom: non-motile). | ||
4. Conclusion
In conclusion, this study developed for the first-time DNA aptamers, which are specific for Y. enterocolitica using whole-bacterium SELEX. The DNA aptamer M1, M5 and M7 can capture Y. enterocolitica, allowing its detection with high affinity of Kd value of 37.93 ± 7.88 nM, 74.96 ± 21.34 nM and 73.02 ± 18.76 nM, respectively. This study provided also a proof-of-concept that our aptamers can target Y. enterocolitica with high specificity in presence of other non-target bacteria. Our selected aptamer sequences can be labeled with different reporting elements to capture and identify Y. enterocolitica in real-time. The whole-bacterium SELEX process for these aptamers promised future applicability for complex sample analysis and detection methods.Appendixes
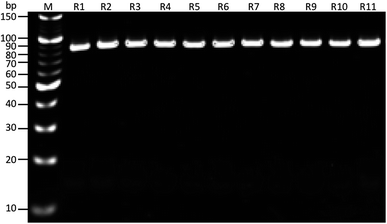 | ||
| Fig. 10 Results of PCR products on gel electrophoresis for band confirmation after each round of SELEX selection. M: 10 bp marker, R1-11: SELEX rounds after PCR amplification. | ||
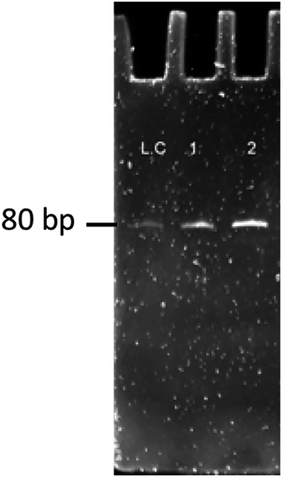 | ||
| Fig. 11 Results of ssDNA obtained on gel electrophoresis for band confirmation of the 10–11th round of SELEX. LC: library control, 1: 10th round sample, 2: 11th round sample. | ||
Conflicts of interest
The authors declare no competing financial interest.Acknowledgements
This work was partly funded by the National Natural Science Foundation of China (31871881), Jiangsu Agriculture Science and Technology Innovation Fund (JASTIF), (CX(18)2025), S&T Support Program of Jiangsu Province (BE2017623), the National First-class Discipline Program of Food Science and Technology (JUFSTR20180303), and the Distinguished Professor Program of Jiangsu Province (JUSRP51714B).References
- Yersinia enterocolitica and Yersinia pestis BT - Foodborne Microbial Pathogens: Mechanisms and Pathogenesis, ed. A. K. Bhunia, Springer New York, New York, NY, 2008, pp. 227–240 Search PubMed.
- S. Keisam, N. Tuikhar, G. Ahmed and K. Jeyaram, Int. J. Food Microbiol., 2019, 296, 21–30 CrossRef CAS PubMed.
- L. Iannetti, R. Salini, A. F. Sperandii, G. A. Santarelli, D. Neri, V. Di Marzio, R. Romantini, G. Migliorati and J. Baranyi, Int. J. Food Microbiol., 2017, 240, 108–114 CrossRef CAS PubMed.
- H. A. Ahmed, A. B. M. B. Tahoun, R. M. M. Abou Elez, M. I. Abd El-Hamid and S. S. Abd Ellatif, Int. Dairy J., 2019, 94, 16–21 CrossRef CAS.
- K. Söderqvist, S. T. Lambertz, I. Vågsholm, L.-L. Fernström, B. Alsanius, L. Mogren and S. Boqvist, J. Food Prot., 2017, 80, 204–212 CrossRef PubMed.
- V. Gupta, P. Gulati, N. Bhagat, M. S. Dhar and J. S. Virdi, Eur. J. Clin. Microbiol. Infect. Dis., 2015, 34, 641–650 CrossRef CAS PubMed.
- M. Shoaib, A. Shehzad, H. Raza, S. Niazi, I. M. Khan, W. Akhtar, W. Safdar and Z. Wang, RSC Adv., 2019, 9, 41010–41021 RSC.
- F. Fois, F. Piras, M. Torpdahl, R. Mazza, D. Ladu, S. G. Consolati, C. Spanu, C. Scarano and E. P. L. De Santis, Int. J. Food Microbiol., 2018, 283, 1–6 CrossRef CAS PubMed.
- E. J. Bottone, Yersinia enterocolitica, Academic Press, 2018 Search PubMed.
- Y. W. Ye, N. Ling, Y. J. Han and Q. P. Wu, J. Dairy Sci., 2014, 97, 6785–6791 CrossRef CAS PubMed.
- N. Konishi, R. Ishitsuka, K. Yokoyama, D. Saiki, S. Akase, C. Monma, A. Hirai, K. Sadamasu and A. Kai, Kansenshogaku Zasshi, 2016, 90, 66–72 CrossRef PubMed.
- E. MacDonald, M. Einöder-Moreno, K. Borgen, L. T. Brandal, L. Diab, Ø. Fossli, B. G. Herrador, A. A. Hassan, G. S. Johannessen, E. J. Johansen and R. J. Kimo, Eurosurveillance, 2014, 21(34), 30321 CrossRef PubMed.
- C. for D. C. and Prevention, Multistate Outbreak of E. coli O157: H7 Infections Linked to Romaine Lettuce, 2018 Search PubMed.
- M. Fredriksson-Ahomaa, Yersinia enterocolitica. InFoodborne Diseases, ed. C. E. R. Dodd, T. Aldsworth, R. A. Stein, D. O. Cliver and H. P. Riemann, Academic Press, 3rd edn, 2017, pp. 223–233 Search PubMed.
- CDC, Y. enterolitica (Yersiniosis), https://www.cdc.gov/yersinia/index.html, accessed 29 April 2020 Search PubMed.
- R. Duan, J. Liang, J. Zhang, Y. Chen, J. Wang, J. Tong, B. Guo, W. Hu, M. Wang and J. Zhao, Emerging Infect. Dis., 2017, 23, 1502 CrossRef CAS PubMed.
- Z. Peng, M. Zou, M. Li, D. Liu, W. Guan, Q. Hao, J. Xu, S. Zhang, H. Jing, Y. Li, X. Liu, D. Yu, S. Yan, W. Wang and F. Li, Food Control, 2018, 93, 121–128 CrossRef CAS.
- Q. Ye, Q. Wu, H. Hu, J. Zhang and H. Huang, Food Control, 2016, 61, 20–27 CrossRef.
- Q. Ye, Q. Wu, H. Hu, J. Zhang and H. Huang, FEMS Microbiol. Lett., 2015, 362, fnv197 CrossRef PubMed.
- J. Liang, R. Duan, S. Xia, Q. Hao, J. Yang, Y. Xiao, H. Qiu, G. Shi, S. Wang and W. Gu, Vet. Microbiol., 2015, 178, 125–131 CrossRef PubMed.
- P. Raymond, E. Houard, M. Denis and E. Esnault, Microbiologyopen, 2018, e751 Search PubMed.
- S. Hanifian and S. Khani, Int. J. Food Microbiol., 2012, 155, 89–92 CrossRef PubMed.
- A. D. Jourdan, S. C. Johnson and I. V Wesley, Appl. Environ. Microbiol., 2000, 66, 3750–3755 CrossRef CAS PubMed.
- T. Wielkoszynski, A. Moghaddam, A. Bäckman, J. Broden, R. Piotrowski, R. Mond-Paszek, A. Kozarenko, T. Ny and M. Wilczynska, Eur. J. Clin. Microbiol. Infect. Dis., 2018, 37, 2301–2306 CrossRef CAS PubMed.
- K. S. Park, Biosens. Bioelectron., 2018, 102, 179–188 CrossRef CAS PubMed.
- J. Teng, F. Yuan, Y. Ye, L. Zheng, L. Yao, F. Xue, W. Chen and B. Li, Front. Microbiol., 2016, 7, 1426 Search PubMed.
- O. Mukama, J. P. Sinumvayo, M. Shamoon, M. Shoaib, H. Mushimiyimana, W. Safdar, L. Bemena, P. Rwibasira, S. Mugisha and Z. Wang, Food Anal. Methods, 2017, 10, 2549–2565 CrossRef.
- M. H. Ali, M. E. Elsherbiny and M. Emara, Int. J. Mol. Sci., 2019, 20, 1–23 Search PubMed.
- J. Zheng, T. Li, J. Wang and Y. Su, J. Biotechnol., 2008, 136, S756 CrossRef.
- N. Duan, W. Gong, S. Wu and Z. Wang, Anal. Chim. Acta, 2017, 961, 100–105 CrossRef CAS PubMed.
- N. Duan, S. Wu, X. Chen, Y. Huang, Y. Xia, X. Ma and Z. Wang, J. Agric. Food Chem., 2013, 61, 3229–3234 CrossRef CAS PubMed.
- Y. Dong, Z. Wang, S. Wang, Y. Wu, Y. Ma and J. Liu, Aptamers Anal. Appl., 2018, 1–25 Search PubMed.
- H. Kaur, Biochim. Biophys. Acta, Gen. Subj., 2018, 1862, 2323–2329 CrossRef CAS PubMed.
- H. Ye, N. Duan, S. Wu, G. Tan, H. Gu, J. Li, H. Wang and Z. Wang, Microchim. Acta DOI:10.1007/s00604-017-2453-3.
- C. Liang, D. F. Li, G. X. Zhang, H. Li, N. S. Shao, Z. C. Liang, L. Q. Zhang, A. P. Lu and G. Zhang, Analyst, 2015, 140, 3439–3444 RSC.
- Z. Luo, H. Zhou, H. Jiang, H. Ou, X. Li and L. Zhang, Analyst, 2015, 140, 2664–2670 RSC.
- L. A. Fraser, Y. W. Cheung, A. B. Kinghorn, W. Guo, S. C. C. Shiu, C. Jinata, M. Liu, S. Bhuyan, L. Nan, H. C. Shum and J. A. Tanner, Adv. Biosyst., 2019, 3(5) DOI:10.1002/adbi.201900012.
- J. Hu, K. Fu and P. W. Bohn, Anal. Chem., 2018, 90, 2326–2332 CrossRef CAS PubMed.
- J. Wang, X. Wu, C. Wang, N. Shao, P. Dong, R. Xiao and S. Wang, ACS Appl. Mater. Interfaces, 2015, 7, 20919–20929 CrossRef CAS PubMed.
- S. D. Cai, J. H. Yan, H. J. Xiong, Y. F. Liu, D. M. Peng and Z. B. Liu, Analyst, 2018, 143, 5317–5338 RSC.
- W. Wu, C. Yu, Q. Wang, F. Zhao, H. He, C. Liu and Q. Yang, Crit. Rev. Food Sci. Nutr., 2019, 1–16 Search PubMed.
- D. Beier and R. Gross, Curr. Opin. Microbiol., 2006, 9, 143–152 CrossRef CAS PubMed.
- J. Moon, G. Kim, S. B. Park, J. Lim and C. Mo, Sensors, 2015, 15, 8884–8897 CrossRef CAS PubMed.
- C. L. Hamula, H. Peng, Z. Wang, A. M. Newbigging, G. J. Tyrrell, X. F. Li and X. C. Le, J. Mol. Evol. DOI:10.1007/s00239-015-9711-y.
- J. Moon, G. Kim, S. B. Park, J. Lim and C. Mo, Sensors, 2015, 15, 8884–8897 CrossRef CAS PubMed.
- X. Cao, S. Li, L. Chen, H. Ding, H. Xu, Y. Huang, J. Li, N. Liu, W. Cao, Y. Zhu, B. Shen and N. Shao, Nucleic Acids Res., gkp489, DOI:10.1093/nar/gkp489.
- N. Duan, X. Ding, S. Wu, Y. Xia, X. Ma, Z. Wang and J. Chen, J. Microbiol. Methods, 2013, 94, 170–174 CrossRef CAS PubMed.
- Y. Long, Z. Qin, M. Duan, S. Li, X. Wu, W. Lin, J. Li, Z. Zhao, J. Liu, D. Xiong, Y. Huang, X. Hu, C. Yang, M. Ye and W. Tan, Sci. Rep. DOI:10.1038/srep24986.
- E. Bohn, M. Sonnabend, K. Klein and I. B. Autenrieth, Int. J. Med. Microbiol., 2019, 309, 344–350 CrossRef CAS PubMed.
- E. J. Bottone, Clin. Microbiol. Newsl., 2015, 37, 1–8 CrossRef.
- J. W. Park, S. Jin Lee, E. J. Choi, J. Kim, J. Y. Song and M. Bock Gu, Biosens. Bioelectron., 2014, 51, 324–329 CrossRef CAS PubMed.
- Y. Luo, X. Liu, T. Jiang, P. Liao and W. Fu, Anal. Chem., 2013, 85, 8354–8360 CrossRef CAS PubMed.
- A. Kumar, M. Malinee, A. Dhiman, A. Kumar and T. K. Sharma, Chapter 2 - Aptamer Technology for the Detection of Foodborne Pathogens and Toxins, ed. R. InamuddinKhan, A. Mohammad and A. M. Asiri, AMBT-AB for HCA, Elsevier, 2019, pp. 45–69 Search PubMed.
| This journal is © The Royal Society of Chemistry 2020 |

