DOI:
10.1039/D0RA00517G
(Paper)
RSC Adv., 2020,
10, 11777-11790
Enhanced compatibility, morphology, rheological and mechanical properties of carboxylated acrylonitrile butadiene rubber/chloroprene rubber/graphene nanocomposites: effect of compatibilizer and graphene content
Received
17th January 2020
, Accepted 10th March 2020
First published on 23rd March 2020
Abstract
Elastomeric nanocomposites were prepared from carboxylated acrylonitrile butadiene rubber/chloroprene rubber (XNBR/CR), graphene and a glycidyl methacrylate (GMA)-grafted XNBR (XNBR-g-GMA) compatibilizer by using a two-roll mill. The effect of graphene and XNBR-g-GMA compatibilizer on curing characteristics, rheological and mechanical properties and morphology of the nanocomposites was investigated. The curing properties and the morphology of the nanocomposites were studied by rheometry, SEM and TEM, respectively. The results of rheometry showed that by adding the XNBR-g-GMA compatibilizer and increasing the graphene content, the scorch time and optimum curing time decreased, but the torque increased, while the curing time increased with increasing CR percentage in the blend. Also, the results of DMTA tests showed that by adding the XNBR-g-GMA compatibilizer, there was compatibility between CR and XNBR and the dispersion of graphene in the XNBR/CR matrix was improved. This phenomenon was confirmed by direct observation of exfoliated graphene nanosheets by TEM. Also, the addition of XNBR-g-GMA and the increase of graphene content in the XNBR/CR matrix caused the fracture surface of the samples to be roughened and the size of dispersed phase (CR) in the XNBR matrix becomes smaller. The results of mechanical properties showed that the addition of the XNBR-g-GMA and increasing the graphene content resulted in increased hardness, fatigue strength, tensile strength, modulus and elongation-at-break.
Introduction
XNBR and CR rubbers are distinguished from other rubbers because of their outstanding properties. XNBR and CR rubbers are distinguished from other rubbers because of their outstanding properties. In XNBR rubber, in addition to the sulfur bridges, carboxylic groups are found on the double bond of the butadiene part. Carboxylic functional groups establish ionic bonds with zinc (Zn2+), and thereby improve the physical properties. These functional groups are introduced to enhance the degree of cross-linking of the vulcanization systems and to improve elastic resilience and abrasion resistance. Also, CR has good resistance to chemical materials, heat aging and ozone cracking as well as resistance to many aliphatic hydrocarbons, chlorofluorocarbons, greases, mineral oils and ozone. In addition, it has excellent flame resistance. In fact, CR is one of the few elastomers that are self-extinguishing and this elastomer gives excellent rubber-to-metal bonds. XNBR/CR blends are used in firefighting pipes due to their special properties. However, XNBR and CR are immiscible and incompatible and their blends have poor mechanical properties due to the low interfacial interaction.1–3 In general, in most cases the melt blending of the two polymers results in weak and brittle blends. Because in these blends, the phase dispersed within the matrix and the formation of a weak interface cause stress concentration.4 For this reason, the compatibility between blend components is inevitable in order to obtain the desired mechanical properties. Compatibilizers are located at the interface of two polymers and increase the adhesion between the phases. This facilitates the transfer of stress from the matrix phase to the dispersed phase and reduces the size of the dispersed phase droplets.5–8 By increasing the adhesion and reinforcement of the interface, the mechanical properties of these polymeric blends are significantly improved. In recent years, researchers have been interested in the use of graphene nanoplatelets as the compatibilizer agent for different types of immiscible polymer blends. Addition of graphene nanoplatelets to polymer blends can modify the blend morphology, since both polymers tend to adsorb onto the surface of graphene nanoplatelets. This can lead to the penetration of single-phase polymer chains into the adjacent phase by means of graphene mobility.9–12 In these studies, the morphological changes of the blends have been evaluated and it has been shown that with the addition of graphene to the incompatible blends, the dimensions of the dispersed phase droplets are greatly reduced and a homogeneous distribution emerges. In fact, graphene acts as a compatibilizer in immiscible blends.13–15 The compatibility effect of graphene oxide on immiscible PS/PMMA blend was investigated by Ye et al.16 The study showed that graphene oxide is capable to compatibilize the immiscible blend and the compatibility was temperature-dependent. The compatibility effect of graphene oxide on this blend is capable of producing strong interactions with the chains of both polymers. The results also showed that by increasing the temperature of the blending process, the effect of graphene oxide compatibility was reduced. The compatibility effect of PP-g-rGO (polypropylene-g-graphene oxide) nanoplatelets on immiscible PS/PP blends was investigated by You et al.17 PP-g-rGO nanoplatelets were prepared from the PP-g-MAH chains grafted onto the amino functional group of rGO nanoplatelets. The morphological results showed that by adding only 1.5 wt% of PP-g-rGO nanoplatelets, the dispersed phase droplet dimensions were decreased and the tensile strength and elongation-at-break were increased with the presence of graphene. The results showed that PP-g-rGO nanoplatelets as compatibilizer could enhance the final properties of the PS/PP blend. There are also, some reports indicate that graphene has been used as reinforcement. Xu et al.18 reported mechanical properties and load transfer of chemically derived graphene nanoplatelets as reinforcements in poly (dimethyl) siloxane blends. Increases in toughness by 39%, damping capability by 673%, elastic modulus of poly(dimethyl) siloxane by 42%, and strain energy density of 43% by the addition of 1 wt% graphene nanoplatelets in poly (dimethyl) siloxane are reported. Young et al.19 reported the various methods that have been employed to prepare graphene such as chemical vapour deposition. They showed, that excellent improvement is only found at relatively low levels of graphene loading and that, due to difficulties with obtaining good dispersions, challenges still remain in obtaining good mechanical properties for high volume fractions of reinforcement. Kumar et al.20 reported that the small amount of graphene can significantly improve the electrical and mechanical properties of blend. In their report, at a nanofiller loading of 6 phr, the elastic modulus was improved by 350, 130 and 150%, with the carbon nanotube, carbon black, and graphitic nanofiller, respectively. They found that the carbon nanotube-based silicone blends showed the highest tensile strength and reinforcing effect compared to those of others. The properties of graphitic nanofiller with flakes of medium surface area were reported by Kumar et al.21 The AFM micrographs showed the dispersion of graphitic nanofiller molecular surface with particles distributed in the range of 12 to 7 nm. Also, they reported that compressive load at 5 phr increased by 85% in the presence of a magnetic field, the surface area of graphitic nanofiller improved, the compressive modulus at 10 phr decreased by 35% and the actuation shift at 15 phr increased by 340%. But so far no studies have been performed on XNBR/CR/graphene nanocomposites. The aim of this study was to investigate the curing, mechanical, rheological and morphological properties of XNBR/CR/graphene nanocomposites. Also, the effect of different graphene concentrations and its key role on the interaction between XNBR and CR and the tendency to graphene aggregation were investigated. The relationship of these properties with the XNBR-g-GMA compatibilizer and graphene content was found in this study.
Experimental
Materials
In this study, XNBR with 7.0% carboxyl group and acrylonitrile content of 28 ± 2 wt%,22 Mooney viscosity ML (1 + 4) at 100 °C of 50 ± 1 and density of 0.99 g cm−3, as base rubber and CR with medium crystallization tendency, Mooney viscosity ML (1 + 4) at 100 °C of 75 ± 3 and density of 1.23 g cm−3 as dispersed phase were used. Also, XNBR-g-GMA containing 1.31% glycidyl methacrylate groups (GMA) was used as the compatibilizer agent in the component. The curing agents, antioxidant and accelerators used are: magnesium oxide, zinc oxide, stearic acid, sulfur, TMTD and MBTS. Graphene specifications are as follows: carbon purity 98 (%), bulk density 0.20–0.40 g cm−3, density 2.0–2.25 g cm−3, width 1–2 μm, and surface area of 750 m2 g−1.23
Characterization techniques
Sample preparation. The blends were prepared by a two-roll mill laboratory (Polymix 200L model, Germany) at a speed of 50 rpm and a blending temperature of 35 ± 5 °C. In the first step, blending of the XNBR and CR rubbers was performed for 5 min on the two-roll mill. Afterwards, the XNBR-g-GMA compatibilizer and graphene were added to the compound, respectively. After 4 min of blending, the compound was processed for 4 min. Then the accelerator, activator and finally curing agents were added to the compound. The exact formulations are reported in Table 1. The prepared samples were cured according to ASTM D 2084 standard at 155 °C based on the results of Fig. 2a.
Table 1 Compound formulation based on XNBR/CR blends and graphene
| Material |
Content (phr) |
Role |
Grade |
Producer |
| Mercapto benzothiazyl disulphide. Tetra-methyl thiuramdisulphide. |
| XNBR |
100, 75, 50, 25, 0 |
Rubber |
Nipol NX775 |
ZEON (USA) |
| CR |
0, 25, 50, 75, 100 |
Rubber |
Bayprene 226 |
LANXESS (Germany) |
| XNBR-g-GMA |
5 |
Compatibilizer |
NX456Z |
ZEON (USA) |
| Zinc oxide |
4 |
Activator |
— |
Hanover (Germany) |
| Mg oxide |
4 |
Activator |
— |
Hanover (Germany) |
| Stearic acid |
1.5 |
Activator |
— |
Hanover (Germany) |
| Sulfur |
1.5 |
Curing agent |
— |
Hanover (Germany) |
| MBTSa |
2 |
Accelerator |
— |
Acros, (Belgium) |
| TMTDb |
1 |
Accelerator |
— |
Acros (Belgium) |
| Graphene |
0.1, 0.3, 0.5, 0.7, 1 |
Reinforcement |
C 750 |
XG (USA) |
In these compounds, W C is the acronym for the blend without compatibilizer. Also in X/C/G code of ternary component, X represents the amount of XNBR, C represents the amount of CR, and G denotes the amount of graphene. For example, 75/25/0.5 is a compound code that represents a compound containing 75 phr XNBR, 25 phr CR and 0.5 phr graphene.
Rheometer and hydraulic press. The curing characteristics of the samples were obtained according to ASTM D 2084 standard using a Zwick rheometer 4308 (Germany) at 155 °C. Also, a hydraulic press machine (25 ton) made by Davenport UK was used for curing of samples.
Mechanical testing. The tensile test was performed according to ASTM D-412 standard and a tensile speed of 500 mm min−1 was applied by a Hiwa testing machine. The hardness test was performed according to ASTM D 2240 standard with a Frank Durometer. The compression set test was done according to ASTM D 395 standard. The fatigue test was performed in accordance with ASTM D 2284 standard with a Monsanto fatigue machine. The abrasion resistance test was done based on ASTM D 5963 standard with a Zwick abrasion tester.
Surface characterization. To study the dispersion of graphene nanoplatelets in the polymer matrix, a Zeiss EM900 transmission electron microscope (TEM, Italy) with an acceleration voltage of 100 kV at −55 °C was used. A scanning electron microscope (SEM) model Tescan VEGA-II (Czech Republic) was used to study the microstructure of fractured surfaces. For this purpose, all samples were first breakdown in liquid nitrogen. Subsequently, their fracture surfaces were coated with a thin layer of gold to become electrically conductive.
Rheological measurement. The rheological behavior of the samples was studied by an RPA dynamic rheometer manufactured by Alpha Technology at 100 °C in the frequency range of 0.01–32 Hz.
Dynamic mechanical properties. Dynamic mechanical thermal analysis (DMTA) of the samples prepared according to ASTM D 5026 standard was performed using a Triton model Tritic 2000 apparatus. The test was performed at 1 Hz in the temperature range of −100 to 100 °C and at a heating rate of 0.5 °C min−1.
Results and discussion
Curing properties
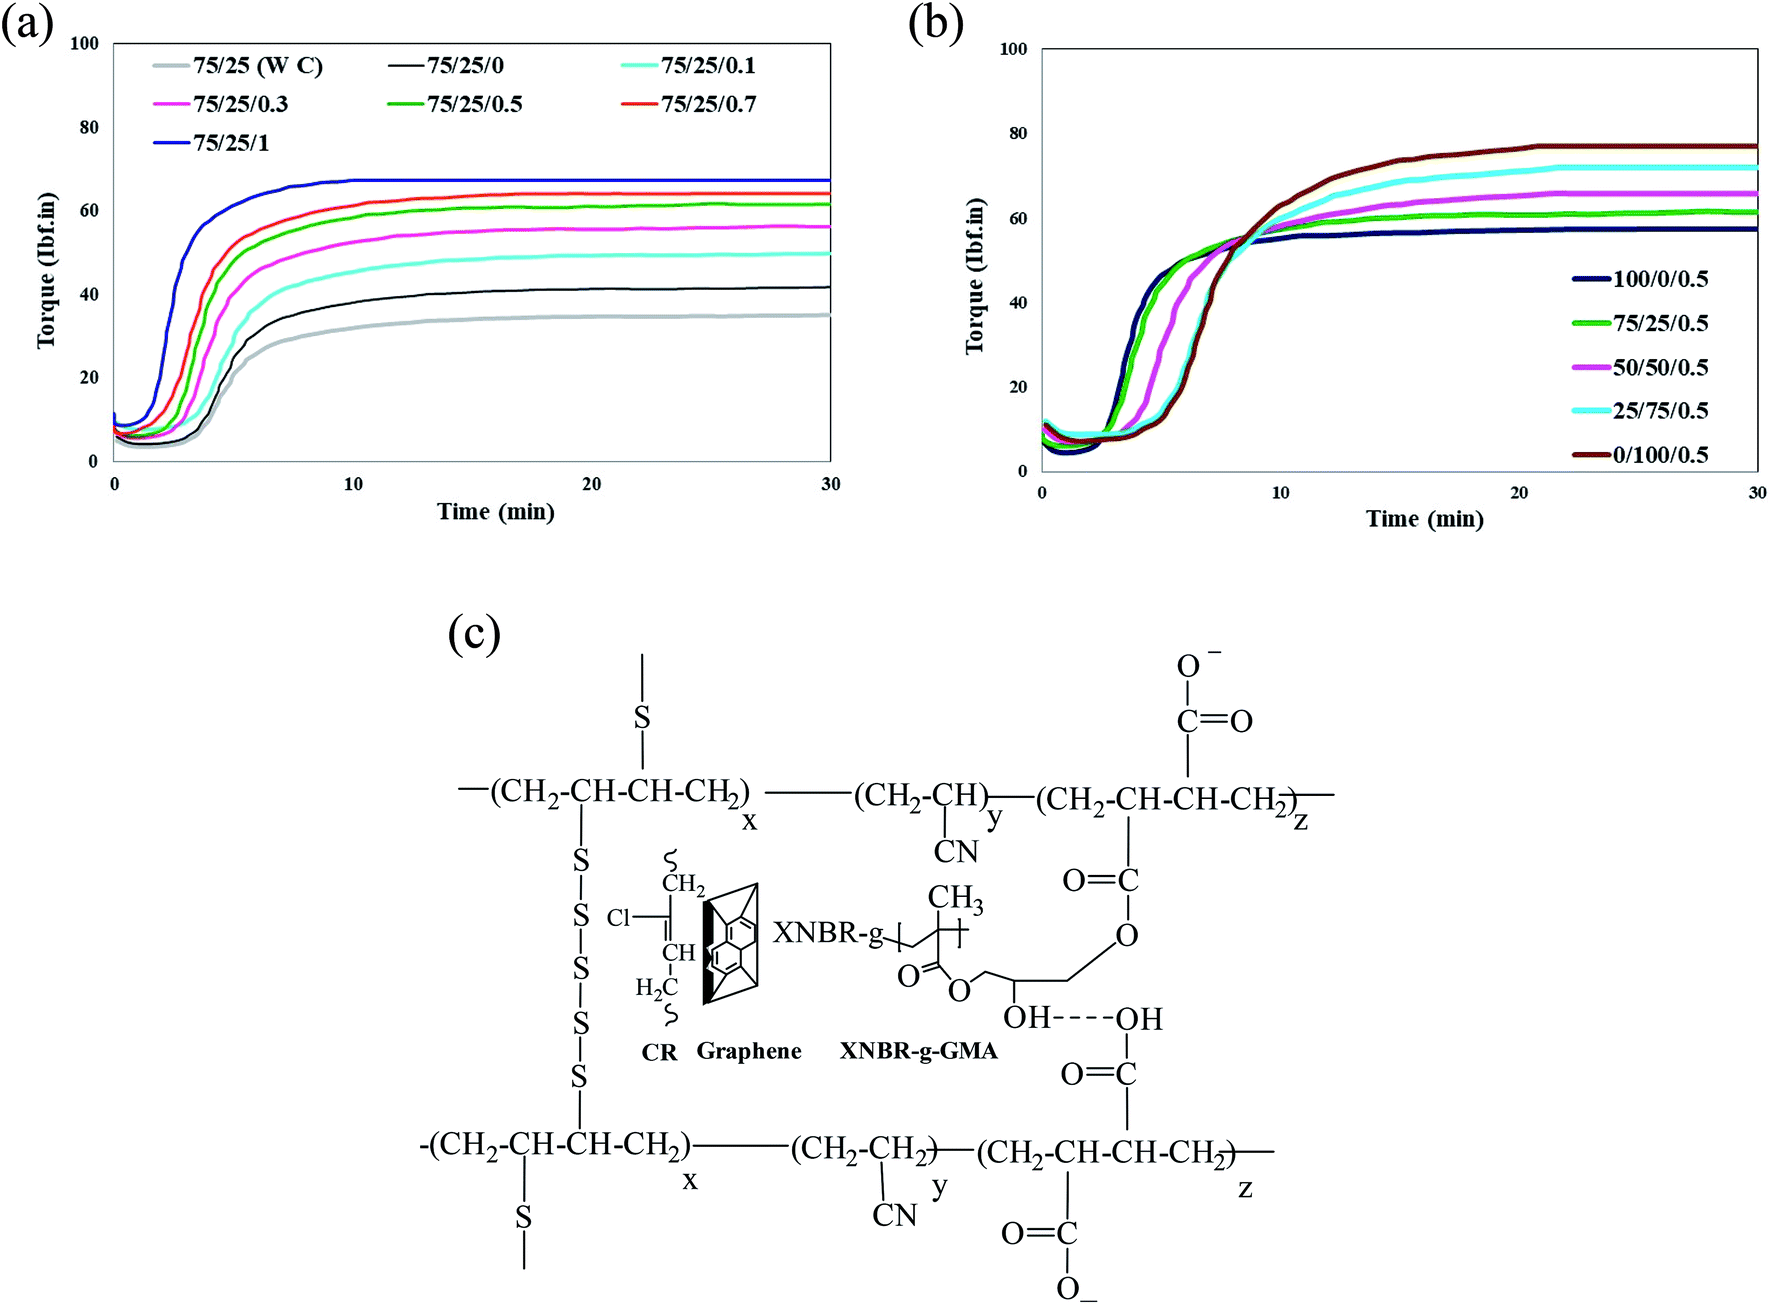
Fig. 1a shows the graphs of curing torque of the XNBR/CR/graphene nanocomposites containing the XNBR-g-GMA compatibilizer with different concentrations of graphene. Fig. 1b shows the graphs of curing torque of the XNBR/CR/graphene nanocomposites at a constant concentration of graphene and different amounts of XNBR. The most likely chemical reaction occurred between XNBR, XNBR-g-GMA, CR and graphene (Fig. 1c). It is quite clear that the scorch time (Fig. 2a) and the optimum curing time (Fig. 2b) of the nanocomposites are reduced by adding the compatibilizer and increasing the graphene content. But the cure rate index (CRI) (Fig. 2c), the min torque (MMin) (Fig. 2d), and the max torque (MMax) (Fig. 2e) are increased.22–24 To ensure the results of curing tests, at least 5 samples were taken from each test. The difference between tests was usually less than 5% on average. Therefore, 5% error bars were included for all samples.
 |
| | Fig. 1 (a) Cure curve of XNBR/CR (75/25) nanocomposite blends containing the XNBR-g-GMA compatibilizer and different concentration of graphene (0, 0.1, 0.3, 0.5, 0.7 and 1) at 155 °C. (b) Cure curve of XNBR/CR nanocomposite blends containing different amount of CR rubber at a constant concentration of graphene (0.5) at 155 °C. (c) Most probable chemical interaction of XNBR with XNBR-g-GMA, CR and graphene. | |
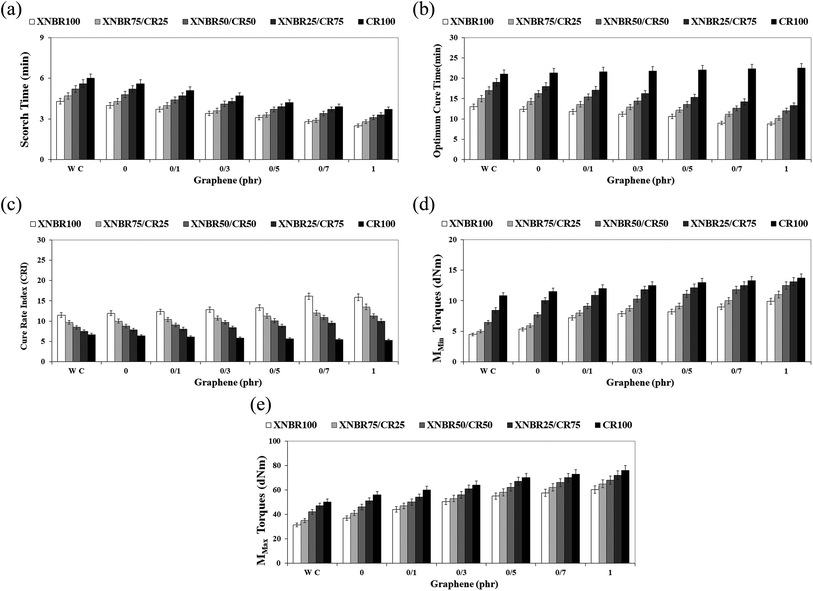 |
| | Fig. 2 (a) Scorch time versus graphene content for various XNBR/CR nanocomposites containing XNBR-g-GMA compatibilizer. (b) Optimum cure time versus graphene content for different XNBR/CR nanocomposites containing the XNBR-g-GMA compatibilizer. (c) Cure rate index (CRI) versus graphene content for different XNBR/CR nanocomposites containing the XNBR-g-GMA compatibilizer. (d) MMin torques versus graphene content for different XNBR/CR nanocomposites containing the XNBR-g-GMA compatibilizer. (e) MMax torques versus graphene content for different XNBR/CR nanocomposites containing the XNBR-g-GMA compatibilizer. | |
In fact, XNBR-g-GMA compatibilizer and graphene as reinforcing agent not only improve the mechanical properties of nanocomposites, but also accelerate the curing process.24 The reaction of sulfur results in an increase in the rate of curing reaction of the rubbers. The possible reaction of epoxide functional groups present in the XNBR-g-GMA compatibilizer and carboxyl groups present in XNBR and also π–π interaction of the C![[double bond, length as m-dash]](https://www.rsc.org/images/entities/char_e001.gif) C functional groups of CR and the graphene CC groups can facilitate cross-linking reactions (Fig. 1c). On the other hand, since MMin and MMax depend on the crosslinking density of blends,25–27 increasing the density of crosslinking adjacent to the graphene can also be effective in increasing the torque difference. The high aspect ratio of graphene results in a significant increase in the rubber/graphene interactions, limiting the movement of the polymer chains and the blend resistance to flow. The interfacial adhesion between the graphene nanoplatelets, XNBR-g-GMA compatibilizer and the continuous phase of XNBR/CR can be attributed to the ring opening reaction of epoxide functional groups of the XNBR-g-GMA compatibilizer and carboxyl groups of XNBR.28,29 Therefore, it can be concluded that the graphene nanoplatelets are effectively dispersed in the continuous phase of XNBR/CR due to the increased torque and viscosity of the nanocomposite blend.
C functional groups of CR and the graphene CC groups can facilitate cross-linking reactions (Fig. 1c). On the other hand, since MMin and MMax depend on the crosslinking density of blends,25–27 increasing the density of crosslinking adjacent to the graphene can also be effective in increasing the torque difference. The high aspect ratio of graphene results in a significant increase in the rubber/graphene interactions, limiting the movement of the polymer chains and the blend resistance to flow. The interfacial adhesion between the graphene nanoplatelets, XNBR-g-GMA compatibilizer and the continuous phase of XNBR/CR can be attributed to the ring opening reaction of epoxide functional groups of the XNBR-g-GMA compatibilizer and carboxyl groups of XNBR.28,29 Therefore, it can be concluded that the graphene nanoplatelets are effectively dispersed in the continuous phase of XNBR/CR due to the increased torque and viscosity of the nanocomposite blend.
However, in nanocomposites containing CR, with increasing graphene, the scorch time decreased, but the optimum curing time increased.25,30 This is attributed to the adsorption of curing agents on the surface of graphene nanoplatelets. On the other hand, as the percentage of double bonds in CR rubber is lower than that in XNBR rubber, this behavior can also be attributed to lower CR curing efficiency in sulfur vulcanization systems.25,30 Also, with increasing CR rubber in the nanocomposite blends containing a constant amount of graphene, the curing torque of the compound increases. This increase is due to the higher viscosity of the CR rubber compared to the XNBR rubber.
Swelling behavior of nanocomposite
The swelling test in acetone was performed to investigate the effect of graphene and XNBR-g-GMA compatibilizer on acetone penetration resistance as shown in Fig. 3. These results show that by adding XNBR-g-GMA and increasing the amount of graphene, the sample mass with respect to the initial mass (m/m0) and the amount of swell decrease. This is due to the increase in the density of the number of graphene nanoplatelets in the XNBR/CR matrix, which reduces the penetration rate of acetone into the compounds by incorporating the rubber phase between the graphene nanoplatelets and using the barrier properties of these nanoplatelets.
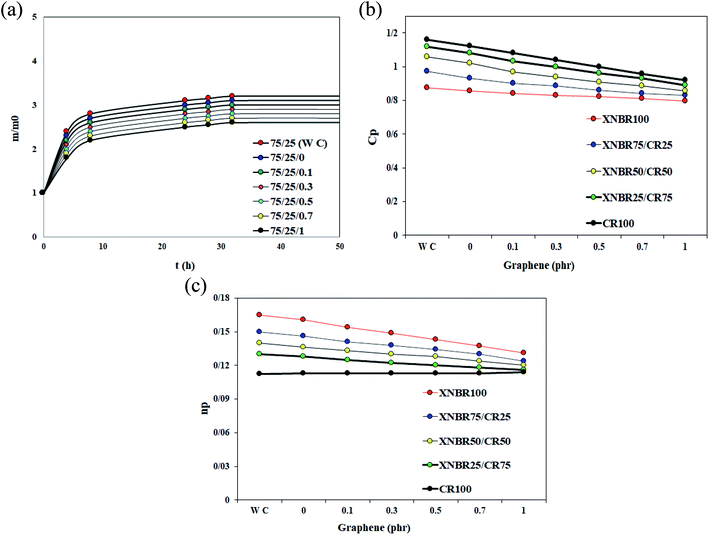 |
| | Fig. 3 (a) m/m0 versus time curves for samples containing the XNBR-g-GMA compatibilizer and different amounts of graphene. (b) Cp versus graphene content for different blends containing the XNBR-g-GMA compatibilizer. (c) np versus graphene content for different blends containing the XNBR-g-GMA compatibilizer. | |
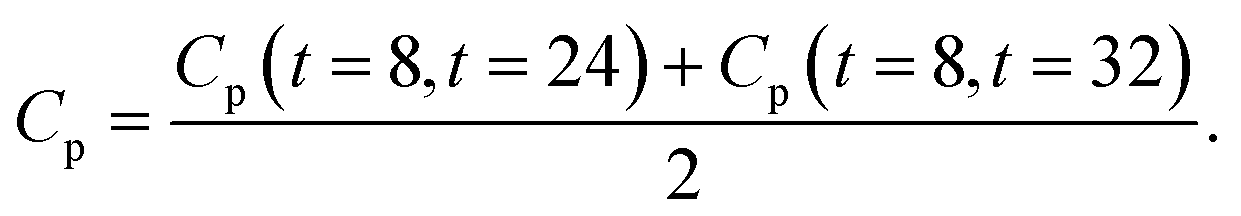
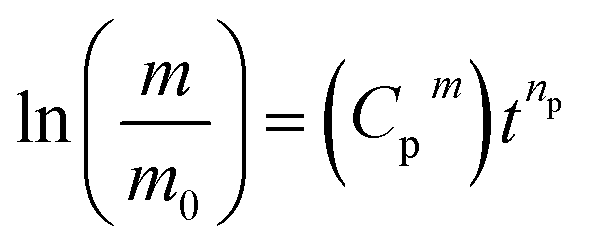
Concerning the effect of graphene and XNBR-g-GMA on acetone penetration resistance, addition of XNBR-g-GMA reduces the acetone penetration. This phenomenon is due to the increase in the density of the three-dimensional crosslinks caused by the nanocomposite. Also, increasing the amount of XNBR at constant values of graphene reduces the penetration of acetone. But pure XNBR/CR blends (without compatibilizer and graphene) have an almost equal mass. The reason for this, according to the results of the DMTA test, is the incompatibility and phase separation in the blend of without compatibilizer and graphene. Considering the results, the 75/25/1 blend is the best blend for acetone penetration resistance. According to the results and calculations obtained by the Avrami equation (eqn (1)) at constant temperature, and substituting X and X0 with m and m0 and taking the logarithm of both sides of eqn (1), the eqn (2) is obtained.
| |
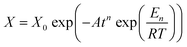 | (1) |
| |
 | (2) |
After averaging them, each blend has a Cp and an average np ((Cpm) and (npm)) and the main equation will be eqn (3):
| |
 | (3) |
Next, by plotting graph Cpm by changing the graphene percentage for the XNBR/CR blends and fitting it to the nearest linear equation passing through the graph in eqn (4), the values of a and b are obtained (in fact, Cpm is a function of the graphene percentage).
| | |
Cpm = a(wt%)Graphene + b
| (4) |
Then by plotting a and b in terms of XNBR percentage and fitting them to the nearest linear equation passing through the graphs in eqn (5) and (6), the values of c, d, e and f are obtained. In fact, Cpm is a function of the XNBR percentage.
Finally, the dependence of Cpm on XNBR and graphene percentage is calculated by eqn (7). The method of calculating npm is also exactly the same as the method of calculating Cpm. The dependence of npT on XNBR and graphene percentage is calculated by eqn (8).
| | |
Cpm = f(wt%(XNBR) + wt%(Graphene)) = (0.002(wt%)XNBR − 0.0751)(wt%)Graphene + (−0.0252(wt%)XNBR + 1.5796)
| (7) |
| | |
npT = f(wt%(XNBR) + wt%(Graphene)) = (0.007(wt%)XNBR − 0.0245)(wt%)Graphene + (−0.0076(wt%)XNBR + 0.1488)
| (8) |
By substituting eqn (7) and (8) into eqn (3), eqn (9) is obtained. Based on experimental data, the blends reached an average of 93.92% of their final mass after 32 h in acetone. Eqn (9) theoretically yields an m/m0 value after 32 h with an average error of 3.88%:
| |
 | (9) |
In this equation,
m,
m0, XNBR (wt%) and graphene (wt%) are mass, initial mass, XNBR weight percentage, and graphene weight percentage, respectively. This equation shows the relationship between the amount of swell and the weight fraction of XNBR and graphene. This equation can be used to optimize and determine the percentage of sample in which the swell value is minimum. The swell optimization results (changes in ln
![[thin space (1/6-em)]](https://www.rsc.org/images/entities/char_2009.gif)
(
m/
m0) in terms of graphene and XNBR percentages) are shown in
Fig. 3b. These curves show the optimum percentages of XNBR and graphene which are 75% and 0.5%, respectively.
Transmission electron microscopy (TEM)
Fig. 4a shows the TEM micrograph of pure XNBR75/CR25 blend. As seen in this figure, the CR phase is distinct from the continuous XNBR phase. Fig. 4b and 8c show the TEM micrographs of the 75/25/0.5 nanocomposite without compatibilizer (W C) and with compatibilizer. Fig. 4b shows the graphene effect and Fig. 4c shows the XNBR-g-GMA effect on the microstructure. The TEM micrograph in Fig. 4b shows two distinct phases of XNBR and CR that are distinguishable due to density differences. The accumulation of graphene nanoplatelets in the CR phase is also detectable. However, Fig. 4c clearly shows that adding XNBR-g-GMA to the XNBR75/CR25 compound creates good compatibility between the CR and XNBR phases and their interface is dramatically enhanced and a continuous phase is observed. The graphene nanoplatelets are also well dispersed and distributed in the XNBR/CR matrix. The exfoliated and delaminated structures appear also to be formed.31,32
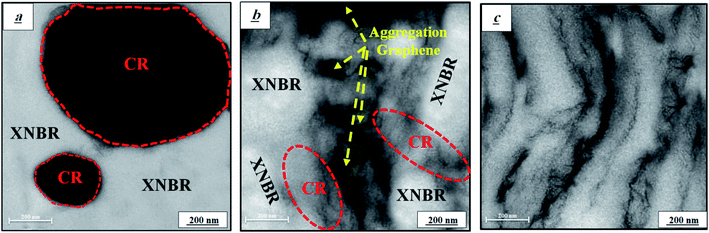 |
| | Fig. 4 TEM micrographs of XNBR75/CR25 blends, (a) pure XNBR75/CR25, (b) blend with graphene and without compatibilizer (W C), and (c) blend with the XNBR-g-GMA compatibilizer and graphene. | |
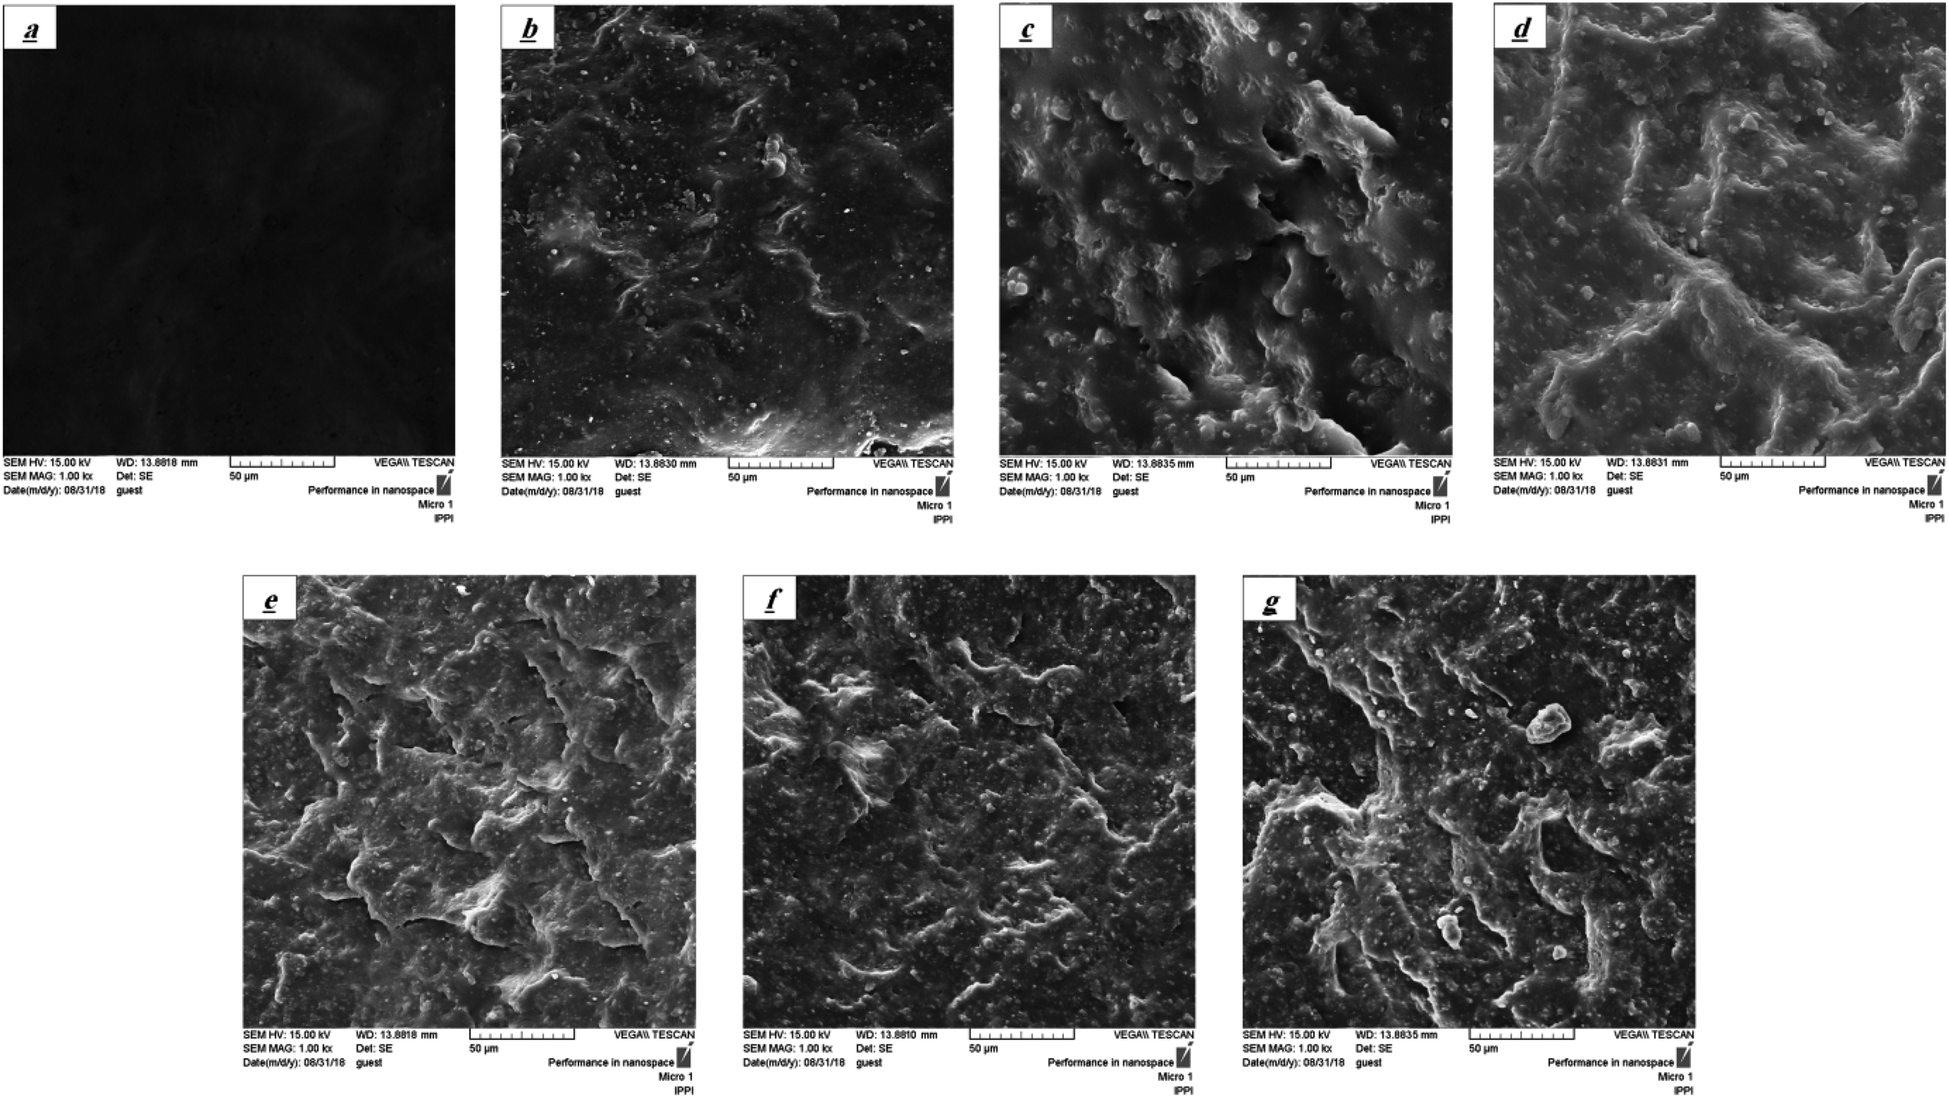
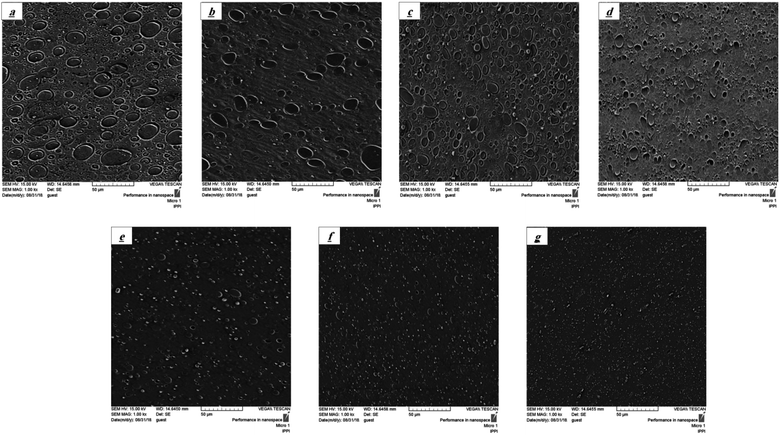
Scanning electron microscopy (SEM)
Fig. 5 shows the SEM micrographs of the fracture surface of XNBR75/CR25 blend nanocomposite samples. As can be seen from this figure, the without compatibilizer (W C) sample (Fig. 5a) has a quite smooth fracture surface, indicating no interaction between the XNBR and CR phases. But with the addition of the XNBR-g-GMA compatibilizer a rough fracture surface is observed in Fig. 5b, resulting from the compatibility between XNBR and CR. These results are consistent with the DMTA results. Also, with increasing the graphene content, the fracture surface has become quite rough. This is due to the interaction among graphene, XNBR-g-GMA, and continuous XNBR/CR phase. In fact, the amount of roughness of the fracture surfaces of nanocomposite samples depends on the interconnections among graphene, XNBR-g-GMA, and continuous XNBR/CR phase.25
 |
| | Fig. 5 SEM micrographs of XNBR/CR (75/25) (a) 75/25 (W C), (b) 75/25/0, (c) 75/25/0.1, (d) 75/25/0.3, (e) 75/25/0.5, (f) 75/25/0.7 and (g) 75/25/1 samples. | |
Fig. 6 shows the SEM micrographs of the XNBR/CR blend containing the XNBR-g-GMA compatibilizer and different amounts of graphene including 0.1, 0.3, 0.5, 0.7 and 1 phr. As is evident, the droplet size of the CR phase dispersed in the XNBR matrix is decreased with the addition of the XNBR-g-GMA compatibilizer due to the compatibility of the CR phase and the continuous XNBR phase (consistent with the DMTA test results). But with increasing graphene nanoplatelets, the droplet size of the CR phase dispersed in the XNBR matrix is decreased dramatically and the distribution and dispersion of the CR droplets are improved. The average droplet size of the CR phase for pure XNBR/CR blend (Fig. 6a), the blend containing XNBR-g-GMA (Fig. 6b), and for the blends containing 0.1, 0.3, 0.5, 0.7 and 1 phr graphene is, respectively, 22.11, 13.13, 9.3, 7.6, 5.28, 4.39 and 3.28 μm. The graphene nanoplatelets and the XNBR-g-GMA compatibilizer incorporation in the interface of the XNBR/CR blend and reinforcing the blend reduce the interfacial tension and increase the interfacial interaction between the CR and XNBR phases and effectively transfer the stress from the matrix to the dispersed phase. Subsequently, the droplet size of the dispersed phase of CR decreases and the interconnectivity of the XNBR/CR blend increases. It is likely that the XNBR-g-GMA compatibilizer and graphene nanoplatelets have a significant effect on the dimensions and distribution of the dispersed CR phase and play an important role in the XNBR/CR blend compatibility.33,34
 |
| | Fig. 6 SEM micrographs of XNBR75/CR25, (a) 75/25 (W C), (b) 75/25/0, (c) 75/25/0.1, (d) 75/25/0.3, (e) 75/25/0.5, (f) 75/25/0.7 and (g) 75/25/1 samples. | |
Mechanical properties
Tables 2 and 3 show the effect of graphene and the XNBR-g-GMA compatibilizer on the mechanical properties of blends. Mooney–Rivlin equation (MR) and tube model equation were used to investigate the effect XNBR-g-GMA and graphene on the mechanical properties. To explain the effect of graphene reinforcement, the modified Mooney–Rivlin (MR) and tube models were used to interpret the effect of nanoparticles on the crosslinking elastomeric network topology (eqn (10)). According to the Mooney–Rivlin equation, the stress/strain relation can be presented as:| |
 | (10) |
where function F(λ) can be defined as eqn (11), σ is the applied stress, and C1 and C2 are the Mooney–Rivlin constants that are independent of the extension ratio λ.| |
 | (11) |
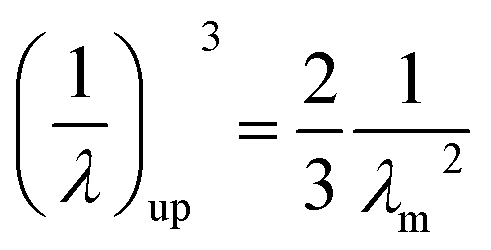
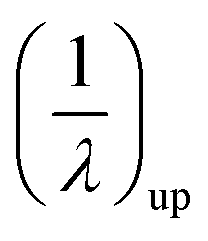
where, λm is the maximum extension ratio at breaking point. Small upturn, (1/λ)up, which can be usually observed in the nanocomposites stress–strain diagrams in large strain deformations, is approximated by eqn (12):28| |
 | (12) |
Table 2 Mooney–Rivilin and tube model parameters for XNBR75/CR25 nanocomposites containing the XNBR-g-GMA compatibilizer and different amounts of graphene (0.1, 0.3, 0.5, 0.7 and 1)
| Blends |
C1 |
C2 |

|
GC |
VC × 104 (mol cm−3) |
MC (g mol−1) |
RC (nm) |
N |
Ge (MPa) |
d0 (nm) |
ne |
| 75/25/0 (W C) |
0.0701 |
0.9711 |
0.2281 |
0.8001 |
2.621 |
2832 |
3.885 |
23 |
0.8312 |
1.821 |
4.8577 |
| 75/25/0 |
0.0899 |
0.9698 |
0.2355 |
0.8108 |
2.911 |
2911 |
4.112 |
24 |
0.8896 |
1.774 |
4.6352 |
| 75/25/0.1 |
0.1655 |
0.8662 |
0.2448 |
0.8309 |
3.069 |
2976 |
4.239 |
24 |
1.1254 |
1.656 |
4.3211 |
| 75/25/0.3 |
0.2889 |
0.7359 |
0.2722 |
0.8558 |
3.448 |
2989 |
4.339 |
24 |
1.1879 |
1.5521 |
4.0012 |
| 75/25/0.5 |
0.3621 |
0.7301 |
0.2801 |
0.8752 |
4.006 |
3099 |
4.774 |
25 |
1.2254 |
1.4412 |
3.8321 |
| 75/25/0.7 |
0.3889 |
0.6758 |
0.2902 |
0.8821 |
4.125 |
3112 |
4.811 |
25 |
1.2879 |
1.3987 |
3.3589 |
| 75/25/1 |
0.4001 |
0.6235 |
0.2895 |
0.8806 |
4.133 |
3158 |
4.889 |
25 |
1.2888 |
1.3882 |
3.0123 |
Table 3 Mechanical properties of different XNBR/CR nanocomposites containing the XNBR-g-GMA compatibilizer and different amounts of graphene (0.1, 0.3, 0.5, 0.7 and 1)
| Sample |
Tensile strength, MPa |
Modulus 100%, MPa |
Elongation% |
Hardness shore A |
Resilience% |
Fatigue to failure cycles × 100 |
Abrasion loss, wt% |
| 100/0 (W C) |
15.11 ± 0.3 |
1.41 ± 0.03 |
148 ± 3 |
50 ± 1 |
68.25 ± 1.4 |
252 ± 5 |
44.56 ± 0.9 |
| 100/0/0 |
17.28 ± 0.3 |
1.48 ± 0.03 |
256 ± 5 |
50.4 ± 1 |
67.44 ± 1.3 |
286 ± 6 |
43.29 ± 0.9 |
| 100/0/0.1 |
20.23 ± 0.4 |
1.59 ± 0.03 |
311 ± 6 |
51 ± 1 |
65.33 ± 1.3 |
351 ± 7 |
37.96 ± 0.7 |
| 100/0/0.3 |
23.45 ± 0.4 |
1.78 ± 0.03 |
441 ± 8 |
52 ± 1 |
63.65 ± 1.3 |
379 ± 8 |
32.69 ± 0.6 |
| 100/0/0.5 |
27.29 ± 0.5 |
2.01 ± 0.04 |
521 ± 10 |
53 ± 1 |
61.32 ± 1.2 |
521 ± 10 |
27.53 ± 0.5 |
| 100/0/0.7 |
30.33 ± 0.6 |
2.18 ± 0.04 |
625 ± 12 |
54 ± 1 |
60.01 ± 1.2 |
666 ± 14 |
22.39 ± 0.4 |
| 100/0/1 |
31.41 ± 0.6 |
2.22 ± 0.04 |
633 ± 12 |
55 ± 1 |
59.54 ± 1.2 |
682 ± 14 |
21.88 ± 0.4 |
| 75/25 (W C) |
16.51 ± 0.3 |
1.51 ± 0.03 |
196 ± 4 |
53 ± 1 |
66.52 ± 1.3 |
408 ± 8 |
41.33 ± 0.8 |
| 75/25/0 |
19.44 ± 0.4 |
1.59 ± 0.03 |
281 ± 5 |
53.5 ± 1 |
65.46 ± 1.3 |
443 ± 8 |
38.91 ± 0.8 |
| 75/25/0.1 |
23.41 ± 0.4 |
1.76 ± 0.03 |
410 ± 8 |
54 ± 1 |
63.55 ± 1.3 |
518 ± 10 |
34.88 ± 0.7 |
| 75/25/0.3 |
28.11 ± 0.5 |
2.05 ± 0.04 |
608 ± 12 |
55 ± 1 |
61.68 ± 1.2 |
733 ± 14 |
31.33 ± 0.6 |
| 75/25/0.5 |
31.12 ± 0.6 |
2.19 ± 0.04 |
711 ± 14 |
56 ± 1 |
59.11 ± 1.2 |
955 ± 19 |
29.11 ± 0.5 |
| 75/25/0.7 |
33.44 ± 0.7 |
2.44 ± 0.05 |
796 ± 16 |
57 ± 1 |
57.01 ± 1.2 |
1088 ± 22 |
27.55 ± 0.5 |
| 75/25/1 |
34.02 ± 0.7 |
2.49 ± 0.05 |
801 ± 16 |
58 ± 1 |
56.52 ± 1.2 |
1092 ± 22 |
27.36 ± 0.5 |
| 50/50 (W C) |
16.01 ± 0.3 |
1.44 ± 0.03 |
161 ± 3 |
56 ± 1 |
64.33 ± 1.3 |
362 ± 7 |
39.12 ± 0.8 |
| 50/50/0 |
18.21 ± 0.3 |
1.53 ± 0.03 |
273 ± 6 |
56.4 ± 1 |
63.59 ± 1.3 |
401 ± 8 |
37.01 ± 0.7 |
| 50/50/0.1 |
22.93 ± 0.4 |
1.71 ± 0.03 |
388 ± 8 |
57 ± 1 |
61.63 ± 1.2 |
452 ± 9 |
33.45 ± 0.6 |
| 50/50/0.3 |
27.55 ± 0.5 |
2.05 ± 0.04 |
581 ± 12 |
58 ± 1 |
59.29 ± 1.2 |
663 ± 13 |
30.94 ± 0.6 |
| 50/50/0.5 |
29.22 ± 0.6 |
2.17 ± 0.04 |
659 ± 14 |
59 ± 1 |
57.62 ± 1.2 |
852 ± 17 |
28.53 ± 0.6 |
| 50/50/0.7 |
31.93 ± 0.6 |
2.26 ± 0.05 |
721 ± 15 |
60 ± 1 |
55.33 ± 1.1 |
983 ± 20 |
26.14 ± 0.5 |
| 50/50/1 |
32.44 ± 0.7 |
2.29 ± 0.05 |
728 ± 15 |
61 ± 1 |
54.85 ± 1.1 |
990 ± 20 |
26.01 ± 0.5 |
| 25/75 (W C) |
14.55 ± 0.3 |
1.33 ± 0.02 |
153 ± 3 |
59 ± 1 |
62.12 ± 1.2 |
291 ± 6 |
38.01 ± 0.7 |
| 25/75/0 |
16.18 ± 0.3 |
1.44 ± 0.03 |
268 ± 6 |
59.6 ± 1 |
61.36 ± 1.2 |
321 ± 6 |
36.33 ± 0.7 |
| 25/75/0.1 |
20.11 ± 0.4 |
1.56 ± 0.03 |
351 ± 7 |
60 ± 1 |
59.81 ± 1.2 |
371 ± 7 |
31.55 ± 0.6 |
| 25/75/0.3 |
25.44 ± 0.4 |
1.83 ± 0.04 |
508 ± 10 |
61 ± 1 |
57.79 ± 1.2 |
516 ± 10 |
30.94 ± 0.6 |
| 25/75/0.5 |
27.35 ± 0.5 |
2.02 ± 0.04 |
601 ± 12 |
62 ± 1 |
55.67 ± 1.2 |
689 ± 14 |
28.22 ± 0.6 |
| 25/75/0.7 |
29.02 ± 0.6 |
2.15 ± 0.04 |
690 ± 14 |
63 ± 1 |
53.15 ± 1.1 |
788 ± 16 |
25.14 ± 0.5 |
| 25/75/1 |
29.11 ± 0.6 |
2.17 ± 0.04 |
698 ± 14 |
64 ± 1 |
52.59 ± 1.1 |
781 ± 16 |
25.12 ± 0.5 |
| 0/100 (W C) |
10.33 ± 0.2 |
1.11 ± 0.02 |
110 ± 2 |
62 ± 1 |
60.15 ± 1.2 |
209 ± 4 |
36.44 ± 0.7 |
| 0/100/0 |
12.18 ± 0.2 |
1.14 ± 0.02 |
162 ± 3 |
62.5 ± 1 |
59.32 ± 1.2 |
234 ± 4 |
35.38 ± 0.7 |
| 0/100/0.1 |
16.08 ± 0.3 |
1.42 ± 0.03 |
259 ± 5 |
63 ± 1 |
57.22 ± 1.2 |
291 ± 6 |
32.81 ± 0.6 |
| 0/100/0.3 |
20.22 ± 0.4 |
1.58 ± 0.03 |
333 ± 6 |
64 ± 1 |
55.63 ± 1.2 |
311 ± 6 |
30.22 ± 0.6 |
| 0/100/0.5 |
22.41 ± 0.4 |
1.68 ± 0.03 |
408 ± 8 |
65 ± 1 |
53.42 ± 1.1 |
442 ± 8 |
27.65 ± 0.5 |
| 0/100/0.7 |
25.33 ± 0.5 |
1.82 ± 0.04 |
512 ± 10 |
66 ± 1 |
51.35 ± 1.0 |
577 ± 10 |
24.74 ± 0.4 |
| 0/100/1 |
25.81 ± 0.5 |
1.84 ± 0.04 |
518 ± 10 |
67 ± 1 |
51.01 ± 1.0 |
581 ± 10 |
23.88 ± 0.4 |
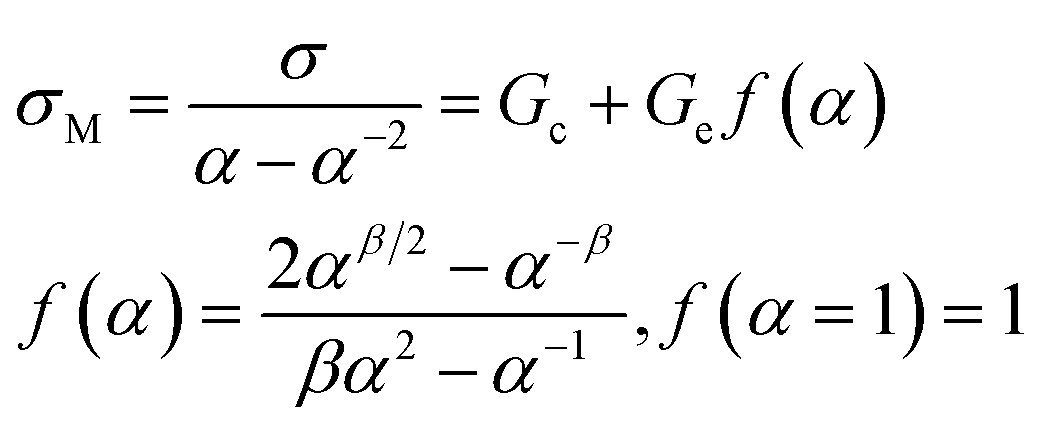
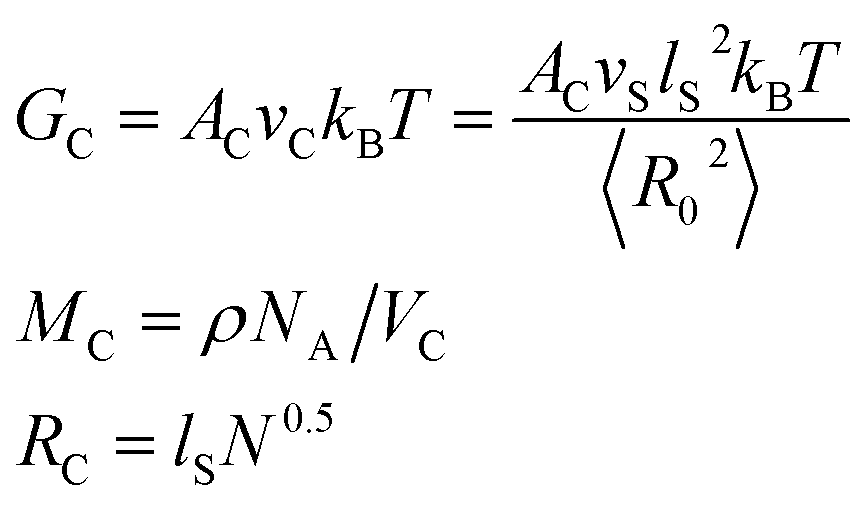
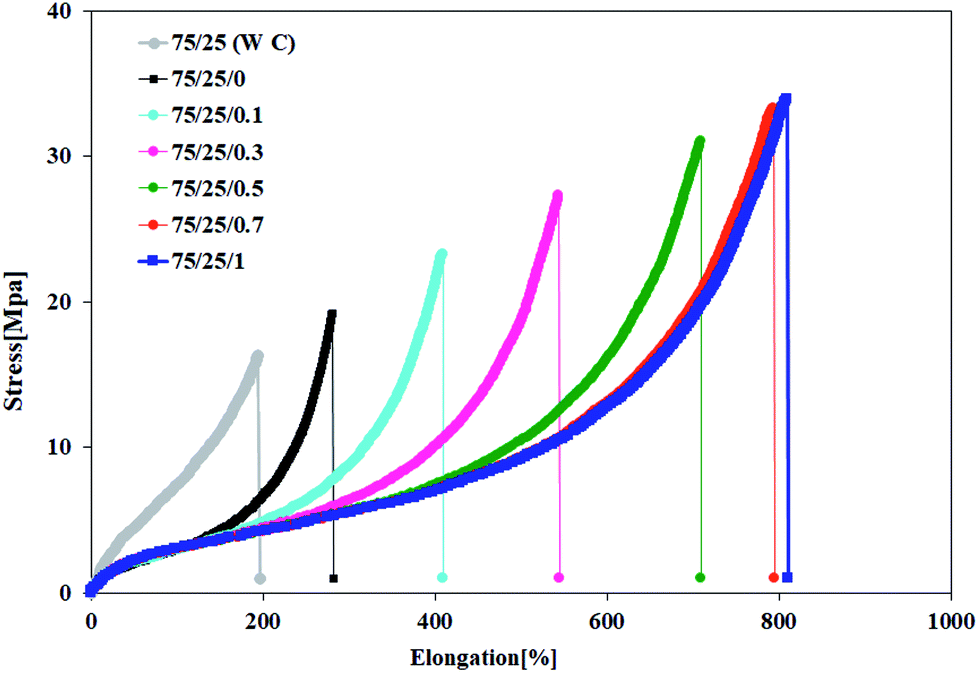
The values of C1, C2 are reported in Table 2 for the XNBR75/CR25 blend. Strain-induced crystallization (SIC) leads to the strain which is occurred by the upturn in stress/strain diagrams and it plays a very important role in improving the tensile properties of blends. In a certain amount of graphene, increasing the XNBR content leads to an increase in the technical properties, which may be attributed to the strain-induced crystallizing nature of CR. So for that reason, the effect of different amounts of graphene and compatibilizer on the tensile properties of XNBR75/CR25 nanocomposites has been investigated. Table 2, based on eqn (12), shows that adding compatibilizer and increasing graphene up to 1 phr raise the (1/λ)up value, which represents an increased tendency of SIC with increasing graphene. The reinforcement effect of graphene is believed to be related to the dispersion of graphene nanoplatelets in the matrix and the increase in effective cross-linking density. According to the entanglement-bound rubber model (EBRM),35 after inserting a small amount of graphene, a bound polymer is formed by adhering the XNBR rubber chains to a large surface area of graphene. As a result of the physical entanglements caused by the CR bulk chains with the XNBR bound polymer, new physical cross-linking points have been developed, leading to advanced mechanical properties. To investigate the improved mechanical properties of nanocomposites and to analyze the microstructure of polymer, tube model theory has been used.36 Base on the tube model theory, the stress/strain under a uniaxial deformation of incompressible sample can be expressed by eqn (13):
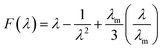
| |
 | (13) |
where
σM,
Gc and
Ge stand for the reduced stress, the elastic modulus resulting from the contribution of the cross linking constraints, and the entanglement modulus related to the topological tube-like constraints stress, respectively.
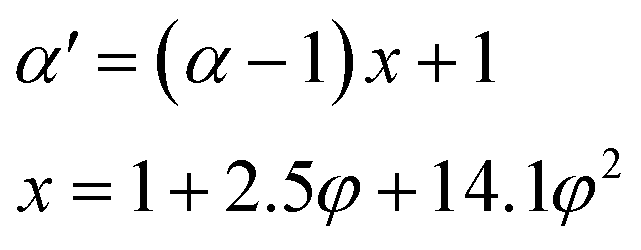
β is an empirical parameter (often referred to as 1) that refers to the relationship between the relaxation of the tube under stretching and undeformed tube in the equilibrium state. To consider strain amplification, the extension ratio
α should be substituted by the effective extension ratio
α′ in the polymer (
eqn (14)).
24,36| |
 | (14) |
where,
x and
φ are the effective reinforcement factor and the volume fraction of graphene, respectively, and as well as the effective cross-linking density can be obtained by computing the following equation:
36| |
 | (15) |
where
RC,
VC and
AC are the root average square end-to-end distance of the crosslinking chains, the effective cross linking density, and the factor that takes the fluctuations of the effective cross-linking junctions into account (value is 0.67).
37 In addition,
N (=
MC/
MS) is the average number of statistical segments and 〈
R02〉 =
NlS2 is the mean square end-to-end distance between two successive junctions. In this equation
MS,
ρ and
MC are the molar mass of statistical segments which is about 107 g cm
−3 for XNBR, the density of XNBR (0.98 g cm
−3) and the mean molar mass of the crosslinking chains, respectively.
NA,
T,
lS and
kB are the Avogadro's number, the absolute temperature, the average length of the Kuhn's statistical segment, which was adopted as 79 nm for XNBR,
23 and Boltzman constant, respectively. Moduli
Ge is dependent to the lateral dimensions of the conformational tubes in the bulk rubber (
eqn (16)):
| |
 | (16) |
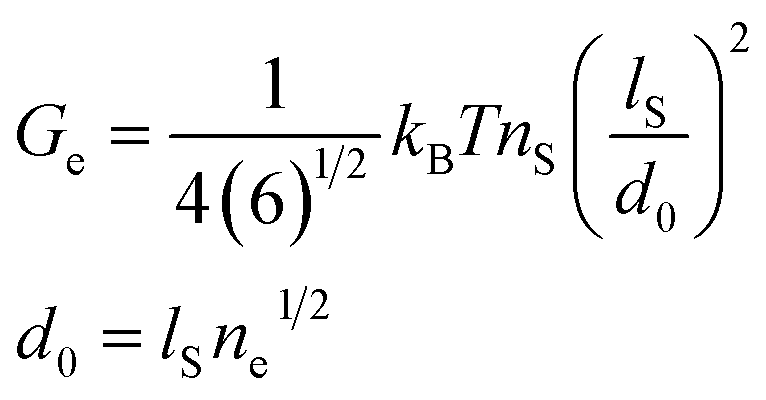
where
nS (=
ρNA/
MS) and
d0 are the density of polymer segments, and the tube radius associated to the mean number of statistical segments between successive entanglements (
ne), respectively. The results of the tube model are reported in
Table 2. The
Ge value for XNBR75/CR25 blends increases with the addition of compatibilizer and increasing graphene. This indicates that the inclusion of graphene nanoplatelets and the XNBR-
g-GMA compatibilizer creates additional chemical cross-linking points that are absorbed by the CR and XNBR chains on the surface of graphene nanoplatelets by π–π interaction of the C
C functional groups of CR and the graphene C
C groups and ring opening reaction of epoxide functional groups in the XNBR-
g-GMA compatibilizer and carboxyl groups in XNBR. Also, formation of hydrogen bond between the hydroxyl groups of XNBR-
g-GMA after ring opening reaction and hydrogen atoms of carboxyl groups in XNBR facilitates the chemical cross-linking (
Fig. 1c). In addition, the
GC value increases with the addition of graphene, indicating that graphene nanoplatelets can also share in chemical bonding sites. It can be concluded that graphene nanoplatelets can enhance mechanical properties by providing additional physical entanglements and creating new chemical bonds. With these interpretations, the addition of the compatibilizer and the increase of the graphene nanoplatelets reduce the mobility of the polymer chains, thereby reducing the tube dimension (
d0) and the average number of segments between entanglements (
ne). Thereupon, the compatibilized graphene nanoplatelets are well dispersed within the XNBR/CR matrix, because increased configuration constraints can be achieved when highly dispersed and exfoliated graphene nanoplatelets provide a mass of effective crosslinkings with the polymer chains. According to
Table 2, it is quite obvious that, elongation-at-break, tensile strength, modulus and hardness of nanocomposites increased with increase in graphene and XNBR content, but the rate of the increase in modulus and hardness slowed down. The increase in modulus and hardness may be related to the cross-linking density of blends containing graphene nanoplatelets, compatibilizer and XNBR, which is consistent with the curing specifications results. The elongation-at-break also increases with the addition of the compatibilizer and graphene, and also increasing graphene nanoplatelets loading. But, the decrease in modulus 100% and elongation-at-break with increasing CR content at the same filler concentration can be attributed to the Payne effect.
38 As shown in
Table 2, by increasing graphene nanoplatelets and XNBR content, the wear resistance of the nanocomposites increases. As according with this table, the resilience is decreased with adding compatibilizer and increasing graphene nanoplatelets. This decrease in the XNBR/CR matrix elasticity was shown to be an indirect measure of the good interaction among the graphene, compatibilizer and the XNBR/CR matrix. The fatigue resistance of XNBR/CR matrix has been improved by adding compatibilizer and increasing graphene nanoplatelets content up to 1 phr. The combination of graphene nanoplatelets improves the fatigue resistance by increasing the hysteresis loss and consuming the energy needed for crack growth.
39
The abrasion resistance is measured by moving a test rubber across the surface of an abrasive sheet mounted to a revolving drum, and is expressed as volume loss in cubic millimeters or abrasion resistance index in percent. Abrasion is the resistance of rubber to rupture by mechanical forces. Measured abrasion loss of the XNBR/CR blends is display in Table 3. The extent of material removal is less in the case of CR with the XNBR. The abrasion resistance of blends increases as the graphene nanoplatelets and CR content increases. Finally, based on the results of Table 3, it is clear that by adding XNBR-g-GMA to the XNBR/CR blend the mechanical properties of the nanocomposites increase due to the reaction between the XNBR and XNBR-g-GMA. But, the increase in mechanical properties becomes more pronounced with increasing graphene content, which is due to the π–π interaction of the CC functional groups in CR and the graphene CC functional groups (Fig. 7).
 |
| | Fig. 7 Stress/strain curves for XNBR75/CR25 nanocomposites containing the XNBR-g-GMA compatibilizer and different amounts of graphene (0.1, 0.3, 0.5, 0.7 and 1). | |
Dynamic mechanical thermal analysis (DMTA)
Fig. 8a shows the loss factor (tanδ)–temperature curves for XNBR75/CR25 nanocomposite samples. In this figure, the curve of the pure XNBR75/CR25 blend (without compatibilizer and graphene) shows two distinct peaks at −25 and −1 °C related to the CR and XNBR phases, respectively. This indicates that the two polymers are incompatible. But with the addition of the XNBR-g-GMA compatibilizer, only one peak is observed, indicating compatibility between XNBR and CR (Fig. 1c shows the interactions among XNBR, XNBR-g-GMA, CR and graphene) and the height of the tanδ peak decreased with respect to the pure sample XNBR75/CR25. But with increasing graphene content, the peak height of the tanδ curve shows a significant decrease. The peak loss factor also shifts to higher temperatures. This is due to the limited mobility of the rubber chains near the surface of the graphene nanoplatelets.
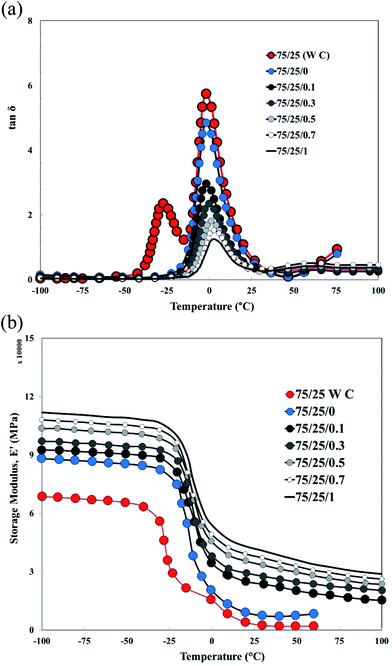 |
| | Fig. 8 (a) Loss factor versus temperature curves of XNBR75/CR25 nanocomposites (effect of graphene and compatibilizer). (b) Storage modulus (E′) versus temperature curves of XNBR75/CR25 nanocomposites (effect of graphene and compatibilizer). | |
Fig. 8b shows the storage modulus (E′)–temperature curves for XNBR75/CR25 nanocomposite samples. This figure shows that the addition of XNBR-g-GMA and increasing graphene content increase the storage modulus and if the graphene content in the nanocomposite becomes more than saturated level, the storage modulus increases significantly, indicating the formation of the exfoliated and intercalated structures. The storage modulus results are consistent with the loss factor (tanδ) results, which shows that the pure XNBR75/CR25 blend (without compatibilizer and graphene) has two distinct peaks at −25 and −1 °C related to the CR and XNBR phases, respectively. This indicates that the two polymers are incompatible. With the addition of the XNBR-g-GMA compatibilizer and with increasing graphene content, only one peak is observed, indicating compatibility between XNBR and CR. These results are consistent with the observations of TEM micrographs.27,31 Table 4 shows the DMTA analysis specifications for XNBR75/CR25 blend samples containing the NBR-g-GMA compatibilizer and different amounts of graphene.
Table 4 DMTA data of XNBR75/CR25 nanocomposites (effect of graphene and compatibilizer)
| Samples |
Tg from E′ [°C] |
Tg from tanδ [°C] |
Ti from tanδ [°C] |
Height of Tg peak [—] |
Decrease in tanδ peak [—] |
Height of Ti peak [—] |
E′ at 25 °C [MPa] |
| 75/25 (W C) |
−3.52 |
−1.89 |
— |
5.92 |
0 |
— |
3.02 |
| −27.92 |
−25.59 |
— |
2.44 |
0 |
— |
6.71 |
| 75/25/0 |
−2.33 |
−1.06 |
— |
2.98 |
2.94 |
— |
8.55 |
| 75/25/0.1 |
−1.31 |
1.57 |
51.21 |
2.34 |
3.58 |
0.311 |
9.33 |
| 75/25/0.3 |
0.22 |
2.45 |
50.28 |
2.01 |
3.91 |
0.329 |
9.91 |
| 75/25/0.5 |
1.93 |
3.01 |
49.33 |
1.81 |
4.11 |
0.388 |
10.55 |
| 75/25/0.7 |
2.41 |
4.08 |
47.55 |
1.61 |
4.31 |
0.418 |
10.98 |
| 75/25/1 |
3.13 |
5.55 |
46.39 |
1.52 |
4.39 |
0.438 |
11.33 |
Rheological properties
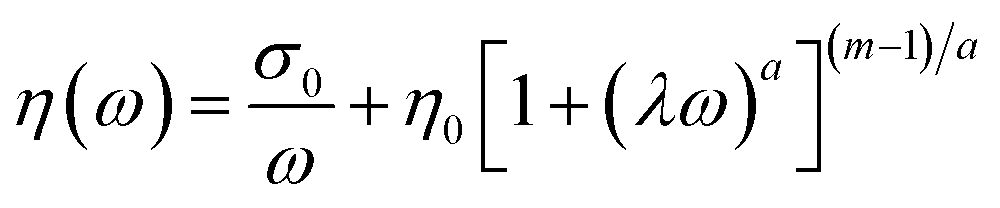
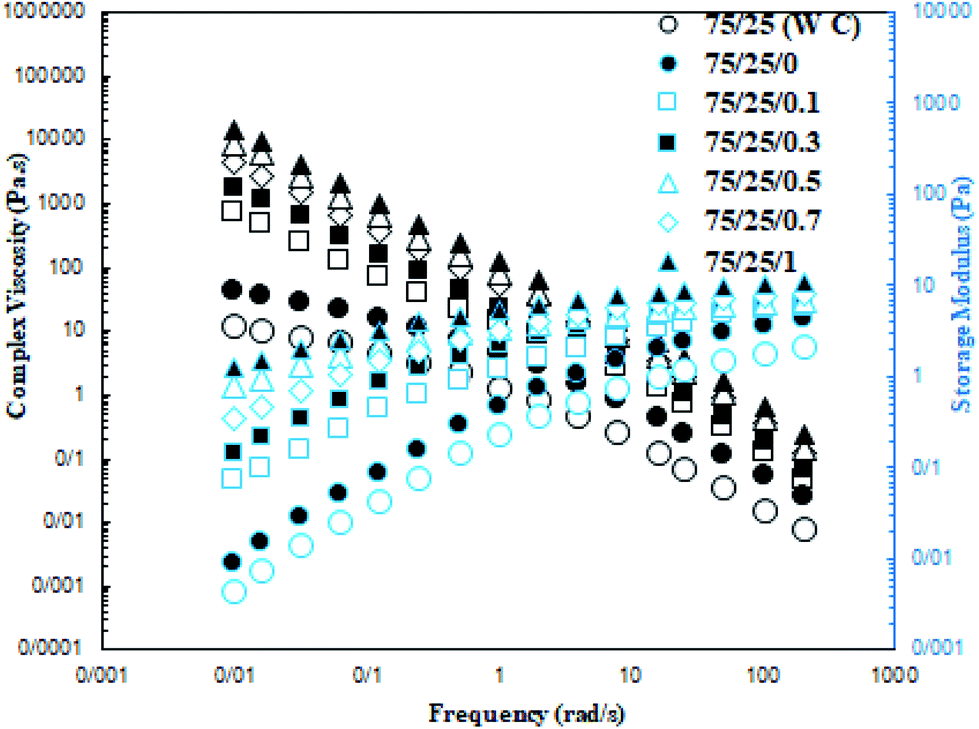
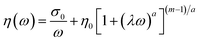
Fig. 9 shows the complex viscosity (η*) and storage modulus (G′) of the XNBR/CR blends with the addition of the XNBR-g-GMA compatibilizer and increasing different graphene contents as a function of angular frequency (ω). Since the rheology of nanocomposites is influenced by the size, shape, and structure of the nanoparticles, the dispersion quality of the graphene nanoplatelets in the XNBR/CR polymer matrix can be inversely determined by tracking the rheological behavior. As shown in Fig. 9, with increasing graphene nanoplatelets content, the complex viscosity (η*) increases at low shear rates.40,41 Solid behavior is often observed in this region due to the formation of networks by graphene nanoplatelets in the XNBR/CR polymer matrix. To evaluate this behavior, the slope of the storage module (G′) curve in the terminal region is used. As is evident, a faster decrease is observed in samples with graphene nanoplatelets. This is due to the higher specific surface area of graphene nanoplatelets and the stronger networks formed by them. At higher shear speeds, shear lubrication behavior can be seen due to the orientation of the graphene in the presence of the XNBR-g-GMA compatibilizer. Usually, with the addition of graphene nanoplatelets, polymer melt elasticity increases. Another important quantity is the threshold of rheology connection. Rheological behaviors before and after this point are different. The most common method to obtain this point is to associate the storage modulus in the end region with the volume fraction of graphene nanoplatelets according to the power law equation in the form of eqn (17):42where η, ω, A, n and η* are, respectively, the shear-thinning factor content which demonstrates the extent of nanoplatelets graphene delamination and interactions among graphene nanoplatelets, CR, XNBR and XNBR-g-GMA, the angular frequency, the sample particular exponential factor, and the apparent viscosity. For XNBR/CR blends, the n values are reported in Table 5 and it can be seen that the higher the n value, the stronger the reinforcement effect. The n values increase as a function of graphene nanoplatelets content, indicating a superior orientation of the graphene nanoplatelets in the direction of shear. Carreau–Yasuda model can be used to understand the dispersion status of the graphene nanoplatelets in XNBR/CR. The graphene nanoplatelets delamination behavior of XNBR/CR blends can be determined by the Carreau–Yasuda model (eqn (18)):| |
 | (18) |
where, a, λ, m, σ0 and η0 are the Yasuda factor, the relaxation time, the dimensionless power index, the yield stress and the zero shear viscosity, respectively, and also, these parameters (according to Carreau–Yasuda model) are reported in Table 5.24,43,44 Previous reports45,46 show that higher yield stress values are directly correlated with better orientation of graphene nanoplatelets. Table 5 clearly shows that, by the adding compatibilizer and also increasing the graphene nanoplatelets content to 1 phr, the yield stress improves dramatically, indicating good dispersion and orientation in the XNBR/CR phase. The relaxation time and zero shear viscosity also show similar trends in terms of graphene nanoplatelets loading, in particular the change in relaxation time after loading of 0.1 phr graphene nanoplatelets is more prominence than that in other graphene nanoplatelets contents. As shown in Table 5, with adding compatibilizer and also increasing graphene content the relaxation time increased, which it may depend on the segmental dynamics of the rubber chains caused by graphene nanoplatelets delamination as well as the confinement of the rubber molecules between the nanoplatelets spaces.
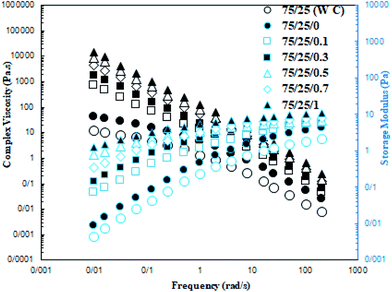 |
| | Fig. 9 Storage modulus (right) and complex viscosity (left) of XNBR75/CR25 nanocomposites (effect of graphene and compatibilizer). | |
Table 5 Rheological data of XNBR75/CR25 nanocomposites calculated using Carreau–Yasuda and power law models (effect of graphene and compatibilizer)
| Blend code |
Carreau–Yasuda model |
Power law model |
| σ0 |
η0 |
λ |
a |
m |
A |
n |
| 75/25 (W C) |
0.411 × 10⁴ |
3.005 × 10⁶ |
0.784 |
0.202 |
0.08 |
6.333 × 10⁴ |
−0.301 |
| 75/25/0 |
0.632 × 10⁴ |
4.108 × 10⁶ |
0.876 |
0.231 |
0.09 |
10.002 × 10⁴ |
−0.322 |
| 75/25/0.1 |
0.998 × 10⁴ |
5.223 × 10⁶ |
1.111 |
0.282 |
0.09 |
13.571 × 10⁴ |
−0.371 |
| 75/25/0.3 |
1.302 × 10⁴ |
6.917 × 10⁶ |
1.285 |
0.295 |
0.1 |
22.418 × 10⁴ |
−0.388 |
| 75/25/0.5 |
2.993 × 10⁴ |
8.445 × 10⁶ |
1.396 |
0.308 |
0.1 |
38.512 × 10⁴ |
−0.409 |
| 75/25/0.7 |
5.888 × 10⁴ |
11.332 × 10⁶ |
1.402 |
0.311 |
0.1 |
50.852 × 10⁴ |
−0.421 |
| 75/25/1 |
7.745 × 10⁴ |
14.228 × 10⁶ |
1.455 |
0.322 |
0.1 |
79.711 × 10⁴ |
−0.433 |
Conclusion
The results showed that increasing the graphene content in different XNBR/CR/graphene nanocomposites accelerated the curing reaction and decreased the scorch time and optimum curing time of the samples, as well as increased their mechanical properties such as modulus, tensile strength, elongation-at-break, abrasion resistance, hardness and fatigue resistance. This is due to the dispersion of the graphene nanoplatelets in the continuous phase of XNBR/CR as well as the penetration of the XNBR and CR chains into the graphene galleries using the XNBR-g-GMA compatibilizer. This was also confirmed by the results of the TEM and SEM tests. The TEM and DMTA results also showed that the addition of the XNBR-g-GMA compatibilizer causes polymers XNBR and CR become compatible and also facilitates the dispersion of graphene nanoplatelets and penetration of polymer chains between the graphene nanoplatelets. It was also observed that by increasing the XNBR content in the nanocomposite samples containing a constant percentage of graphene, the mechanical properties such as modulus, tensile strength, elongation-at-break, fatigue strength and abrasion resistance of nanocomposite blends were increased.
Conflicts of interest
There are no conflicts to declare.
Acknowledgements
The financial support by Zolal Gostar Rooz (ZGR) Company gratefully is acknowledged by the authors. The authors also thank Khazra Sazan Rad Polymer Parsian, Consulting Polymer Engineers CO for supporting this research.
References
- R. Manna and S. K. Srivastava, Mater. Chem. Front., 2017, 1, 780–788 RSC.
- B. P. Kapgate and C. Das, RSC Adv., 2014, 4, 58816–58825 RSC.
- S. Aid, A. Eddhahak, S. Khelladi, Z. Ortega and A. Tcharkhtchi, Polym. Test., 2019, 73, 222 CrossRef CAS.
- G. C. Liu, Y. S. He, J. B. Zeng, Y. Xu and Y. Z. Wang, Polym. Chem., 2014, 5, 2530–2539 RSC.
- M. Zhang, Y. Li, Z. Su and G. Wei, Polym. Chem., 2015, 6, 6107–6124 RSC.
- X. Han, X. Liang, L. Cai, A. He and H. Nie, Polym. Chem., 2019, 10, 5184–5190 RSC.
- F. H. Isikgor and C. R. Becer, Polym. Chem., 2015, 6, 4497–4559 RSC.
- W. Ying, W. Pan, Q. Gan, X. Jia, A. Grassi and D. Gong, Polym. Chem., 2019, 10, 3525–3534 RSC.
- K. Yao, G. Zhang, Y. Lin, J. Gong, H. Na and T. Tang, Polym. Chem., 2015, 6, 389–396 RSC.
- S. Ye, Y. Cao, J. Feng and P. Wu, RSC Adv., 2013, 3, 7987–7995 RSC.
- W. K. Chee, H. N. Lim, N. M. Huang and I. Harrison, RSC Adv., 2015, 5, 68014–68051 RSC.
- Y. Cao, J. Feng and P. Wu, J. Mater. Chem., 2012, 22, 14997–15005 RSC.
- R. Ma, S. Y. Chou, Y. Xie and Q. Pei, Chem. Soc. Rev., 2019, 48, 1741–1786 RSC.
- O. J. Botlhoko, J. Ramontja and S. S. Ray, Polym, 2018, 139, 188–201 CrossRef CAS.
- M. Amani, M. Sharif, A. Kashkooli, N. Rahnama and A. Fazli, RSC Adv., 2015, 5, 77723–77733 RSC.
- S. Ye, Y. Cao, J. Feng and P. Wu, RSC Adv., 2013, 3, 7987–7995 RSC.
- F. You, D. Wang, X. Li, M. Liu, Z. Dang and G. Hu, J. Appl. Polym. Sci., 2014, 131, 28–41 Search PubMed.
- P. Xu, J. Loomis, R. D Bradshaw and B. Panchapakesan, Nanotechnology, 2012, 23, 1–2 Search PubMed.
- R. J. Young, I. A. Kinlocha, L. Gonga and K. S. Novoselov, Compos. Sci. Technol., 2012, 72, 1459–1476 CrossRef CAS.
- V. Kumar, G. Lee, K. Singh, J. Choi and D. J. Lee, Sens. Actuators, A, 2020, 303, 111712 CrossRef.
- V. Kumar, D. J. Lee and J. Y. Lee, Polym. Test., 2016, 56, 369–378 CrossRef CAS.
- M. J. Azizli, H. A. Khonakdar, M. Mokhtary and V. Goodarzi, J. Polym. Res., 2019, 26, 221–241 CrossRef.
- R. M. Santos, S. T. Mould, P. Formánek, M. C. Paiva and J. A. Covas, Polymers, 2018, 10, 1–14 CrossRef PubMed.
- M. J. Azizli, S. Abbasizadeh, M. Hoseini, S. Rezaeinia and E. Azizli, J. Compos. Mater., 2017, 51, 1861–1872 CrossRef CAS.
- M. J. Azizli, G. Naderi, G. R. Bakhshandeh, S. Soltani and E. Esmizadeh, Rubber Chem. Technol., 2014, 87, 10–18 CrossRef CAS.
- J. Wu, W. Xing, G. Huang, H. Li and Y. Liu, Polym, 2013, 54, 3314–3324 CrossRef CAS.
- M. S. Satyanarayana, A. K. Bhowmick and K. Dinesh Kumar, Polym, 2016, 99, 21–42 CrossRef CAS.
- M. J. Azizli, M. Ziaee, S. Rezaeinia, J. Seyfi and M. H. Azizli, Polym. Compos., 2016, 39, 1562–1574 CrossRef.
- B. Mensah, K. C. Gupta, H. Kim, W. Wang and C. Nah, Polym. Test., 2018, 68, 160–184 CrossRef CAS.
- A. Das, F. R. Costa, U. Wagenknecht and G. Heinrich, Eur. Polym. J., 2088, 44, 3456–3465 CrossRef.
- A. E. Ebrahimi-Jahromi, H. R. Ebrahimi-Jahromi, F. Hemmati, M. R. Saeb and K. Formela, Composites, Part B, 2016, 90, 478–484 CrossRef CAS.
- G. Hatui, A. Malas, P. Bhattacharya, S. Dhibar and C. K. Das, J. Alloys Compd., 2015, 691, 709–718 CrossRef.
- J. Jeddi, O. Yousefzade, A. Babaei, S. Ghanbar and A. Rostami, Morphology, Mater. Chem. Phys., 2017, 187, 191–199 CrossRef CAS.
- T. J. A. Mélo, E. M. Araújo, G. F. Brito and P. Agrawal, J. Alloys Compd., 2014, 615, 389–391 CrossRef.
- J. M. Funt, Rubber Chem. Technol., 1988, 61, 842–865 CrossRef CAS.
- X. Fu, G. Huang, Z. Xie and W. Xing, RSC Adv., 2015, 5, 25171–25182 RSC.
- M. Klueppel and G. Heinrich, Macromolecules, 1994, 27, 3596–3603 CrossRef CAS.
- J. Diani, B. Fayolle and P. Gilormini, Eur. Polym. J., 2009, 45, 601–612 CrossRef CAS.
- B. Dong, C. Liu, L. Zhang and Y. Wu, RSC Adv., 2015, 5, 17140–17148 RSC.
- B. Yang, Y. Shi, J. B. Miao, R. Xia and J. W. Liu, Polym. Test., 2018, 67, 122–135 CrossRef CAS.
- J. Jyoti, S. R. Dhakate and B. P. Singh, Composites, Part B, 2018, 154, 337–350 CrossRef CAS.
- S. Adrar, A. Habi, A. Ajji and Y. Grohens, Appl. Clay Sci., 2017, 146, 306–311 CrossRef CAS.
- S. K. Tiwari, G. Hatui, R. Oraon, A. D. Adhikari and G. C. Nayak, Curr. Appl. Phys., 2017, 17, 1158–1161 CrossRef.
- S. Pu, Y. B. Hao, X. X. Dai, P. P. Zhang and M. Wang, Polym. Test., 2017, 63, 289–297 CrossRef CAS.
- H. Li, M. Zuo, T. Liu, Q. Chen, J. Zhang and Q. Zheng, RSC Adv., 2016, 6, 10099–10113 RSC.
- Y. Jing, H. Tang, G. Yu and P. Wu, Polym. Chem., 2013, 4, 2598–2607 RSC.
|
| This journal is © The Royal Society of Chemistry 2020 |
Click here to see how this site uses Cookies. View our privacy policy here. 
 Open Access Article
 This Open Access Article is licensed under a Creative Commons Attribution-Non Commercial 3.0 Unported Licence
 *ab,
Sheida Rezaeiniabc,
Katayoon Rezaeepartod,
Masoud Mokhtarya and
Fahimeh Askarie
*ab,
Sheida Rezaeiniabc,
Katayoon Rezaeepartod,
Masoud Mokhtarya and
Fahimeh Askarie