DOI:
10.1039/D0RA00496K
(Paper)
RSC Adv., 2020,
10, 9745-9759
Investigation into the synthesis conditions of CuMoO4 by an in situ method and its photocatalytic properties under visible light irradiation†
Received
16th January 2020
, Accepted 17th February 2020
First published on 6th March 2020
Abstract
A kind of molybdenum and copper compound, CuMoO4, was prepared by a hydrothermal method. The construction and photocatalytic properties of CuMoO4 have been characterized by X-ray diffraction (XRD), scanning electron microscopy (SEM), X-ray photoelectron spectroscopy (XPS), Fourier transform infrared spectroscopy (FTIR), Raman spectroscopy, transmission electron microscopy (TEM), UV-visible spectrometry and comprehensive thermal analysis. XRD analysis showed that samples which were synthesized under different hydrothermal time conditions were consistent, but the crystallinities of the samples were different. In another situation, disparate hydrothermal temperatures during the synthesis of CuMoO4 would lead to the appearance of different samples. The band gap of CuMoO4 was estimated to be 1.97 eV. It could be found from the results that CuMoO4 was an indirect band gap semiconductor by simulating its band structure. The photocatalytic activities of CuMoO4 were studied by means of monitoring the abilities of these compounds to degrade rhodamine B or 1H-benzotriazole in liquid media under visible light irradiation. Under different synthesis conditions, the hydrothermal time for obtaining the optimal degradation efficiency was 10 h, and the hydrothermal temperature was 180 °C. The results showed that CuMoO4 had excellent degradation performance for rhodamine B or 1H-benzotriazole. CuMoO4 showed excellent mineralization efficiency for rhodamine B compared with N-doped TiO2 based on the reduction of total organic carbon (TOC) during the photocatalytic process. The photocatalytic degradation rate of rhodamine B by CuMoO4 was 1.39 times that by N-doped TiO2, and the degradation rate of TOC by CuMoO4 was 1.53 times that by N-doped TiO2. Based on the intermediate products which were detected by liquid chromatography/mass spectrometry (LC/MS), the possible degradation pathway of rhodamine B was derived.
1 Introduction
Nano-structured materials have attracted a lot of attention because the properties of nanomaterials depend not only on their composition, but also on their size, shape and so on.1–5 In the family of inorganic materials, metal molybdate was one of the most significant compounds due to its special composition, shape and size. More and more attention has been paid to metal molybdate because of its extensive applications in plentiful fields, such as industrial catalysts, partial oxidation of hydrocarbons, precursor synthesis catalysts, humidity sensors, scintillator materials, and for its magnetic properties, electrochemical properties, photoluminescence and microwave applications. Furthermore, its areas of application have been extended to the fields of biology, medicine and chemical industry.6–12 In the past few decades, the transition metal molybdates AMoO4 (A = Cu, Ni, Co, Fe and Zn) and B3Mo2O9 (B = Cu, Zn) have been widely researched because of their unique structural properties, electronic properties, magnetic properties and catalytic properties.13–15 Among transition metal molybdates, copper molybdate was a prospective partial oxidation catalyst for light alkanes, especially for propane and isobutylene.16 There were six known polymorphs of CuMoO4, such as α-CuMoO4 at low temperature and β-CuMoO4 at high temperature. The room-temperature triclinic (alpha) polymorph was studied. In the thermal analysis results, a small signal of a phase transition could be seen on the DSC curve around 570 °C,17 which belonged to the room-temperature (α) → high-temperature (β) phase transition of CuMoO4.
The application of copper molybdate compounds can be discovered in some fields. It was expressed that copper molybdate compounds have quite a potential for reducing the combustion temperature of carbon black.18 Thermal expansion properties, semiconducting properties and electrical transport properties have been studied.19–21 G. Steiner and R. Salzer studied the relationship between the temperature of CuMoO4 and its optical properties.22 At room temperature, the CuMoO4 crystal showed a strongly green color. Afterwards, with an increase in temperature, the color of CuMoO4 transformed to dark brown at around 400 °C. This change in CuMoO4's color was absolutely reversible and the crystal structure was not broken during the temperature cycle. CuMoO4 showed the similar color change during the temperature cycle at an oxygen partial pressure of PO2 = 100 Pa or PO2 = 2 × 10⁵ Pa.
In recent years, the application of molybdenum-based oxide materials in photocatalysis and lithium-ion batteries has been extensively explored.23,24 For instance, PbMoO4 and CdMoO4 showed good photodegradation performance for rhodamine B.25,26 CoMoO4 and Mn2Mo3O8 had higher reversible capacity and excellent cycle stability in lithium-ion batteries.27,28 In some aspects, spherical structural materials attracted more attention for the photocatalytic degradation of dyes, photocurrent response and lithium-ion batteries.29,30 Based on the above analysis, we strived to investigate whether highly monodispersed CuMoO4 particles had great application potential in numerous electroluminescent devices, such as photocatalysis, photocurrent and energy conversion.
In this paper, we studied the performance of CuMoO4 and made some characterizations of some properties. As for photocatalytic applications, previous studies have shown that semiconductor compounds could break down the most persistent organic pollutants, such as coloring matter, detergents and volatile organic compounds under ultraviolet light irradiation.31,32 Rhodamine B was utilized as a model contaminant in this paper to evaluate the degradation activity by CuMoO4 under visible light irradiation because of its wide use and difficult biodegradation. Moreover, the construction and photocatalytic characterization of CuMoO4 were also investigated in detail.
2 Experimental
2.1 Synthesis of nanocatalysts
CuMoO4 was synthesized by a hydrothermal method. CuCl2·2H2O and (NH4)6Mo7O24·4H2O with a purity of 99.99% (Sinopharm Group Chemical Reagent Co., Ltd., Shanghai, China) were used as the original materials. 5 mmol of CuCl2·2H2O was dissolved in 30 mL of deionized water, and at the same time 5/7 mmol of (NH4)6Mo7O24·4H2O was dissolved in 30 mL of deionized water. Subsequently, the dissolved (NH4)6Mo7O24·4H2O solution was poured into the CuCl2 solution. The molar ratio of copper element to molybdenum element was 1![[thin space (1/6-em)]](https://www.rsc.org/images/entities/char_2009.gif) :1 in all experiments. The mixed solution was stirred for 30 min at room temperature, and then it was transferred to a polytetrafluoroethylene liner and placed in an autoclave; finally, it reacted at 180 °C for 10 h (110 °C, 150 °C, 180 °C, 200 °C, 220 °C temperature gradient and 4 h, 8 h, 10 h, 12 h, 14 h time gradient experiments were done). After hydrothermal reaction, the sample was taken out and filtered through a 0.45 μm filter membrane. Subsequently, the filtered powder sample was baked in an oven for 4 h to obtain the precursor to CuMoO4. The precursor to CuMoO4 was placed in a muffle furnace (KSL 1700X, Hefei Kejing Materials Technology Co., Ltd., Hefei, China) and calcined at 500 °C to obtain a CuMoO4 sample.
:1 in all experiments. The mixed solution was stirred for 30 min at room temperature, and then it was transferred to a polytetrafluoroethylene liner and placed in an autoclave; finally, it reacted at 180 °C for 10 h (110 °C, 150 °C, 180 °C, 200 °C, 220 °C temperature gradient and 4 h, 8 h, 10 h, 12 h, 14 h time gradient experiments were done). After hydrothermal reaction, the sample was taken out and filtered through a 0.45 μm filter membrane. Subsequently, the filtered powder sample was baked in an oven for 4 h to obtain the precursor to CuMoO4. The precursor to CuMoO4 was placed in a muffle furnace (KSL 1700X, Hefei Kejing Materials Technology Co., Ltd., Hefei, China) and calcined at 500 °C to obtain a CuMoO4 sample.
2.2 Characterization of samples
The particle formation of CuMoO4 was measured with a transmission electron microscope (TEM, Tecnai F20 S-Twin, FEI Corporation, Hillsboro, Oregon, USA) with a 200 kV operating voltage. The chemical ingredients of CuMoO4 were determined with a scanning electron microscope (SEM) which was equipped with an X-ray energy dispersion spectrum (SEM-EDS, LEO 1530VP, LEO Corporation, Pegnitz, Germany) with a 20 kV operating voltage. The Cu2+ content, Mo6+ content and O2− content of CuMoO4 and the valence states of the above elements were analyzed by X-ray photoelectron spectroscopy (XPS, ESCALABMK-2, VG Scientific Ltd., East Grinstead, UK). The chemical ingredients within the depth profile of CuMoO4 were examined by the argon ion denudation method when X-ray photoelectron spectroscopy was utilized. The crystalline phase of CuMoO4 was analyzed with an X-ray diffractometer (XRD, D/MAX-RB, Rigaku Corporation, Tokyo, Japan) with Cu Kα radiation (λ = 0.154056 nm), and the patterns were collected at 295 K with a step-scan procedure in the range of 2θ = 10–70°; at the same time, the step interval was 0.02°, and the time per step was 1 s. Finally, the accelerating voltage and applied current were 40 kV and 40 mA, respectively. Fourier transform infrared spectroscopy (FTIR, Nexus, Nicolet Corporation, Madison, Wisconsin, USA) was applied to examine the FTIR spectra of CuMoO4; moreover, its spectral range was between 4000 and 400 cm−1 and the resolution was better than 0.09 cm−1. In addition to the Fourier transform infrared study, Raman spectroscopy (Raman, LSM 710, Zeiss, German) was used to further investigate the molecular vibration and make a judgment about the functional groups of CuMoO4. Differential thermal analysis (DTA) was performed on a thermal synthesis analyzer (DTA-TG, Netzsch STA449C, NETZSCH Grinding & Dispersing Corporation, German) from 25 °C to 1000 °C at a linear heating rate of 10 °C min−1.
2.3 Photoelectric response experiments
The UV-visible diffuse reflectance spectra of CuMoO4 were measured with a Shimadzu UV-2550 UV-visible spectrometer (Shimadzu, Santa Clara, California, USA), and BaSO4 was utilized as the reference material. Photoluminescence spectroscopy (Fluoromax-4, HORIBA, Japan) was utilized to test the recombination rate of photo-induced carriers derived from the sample. The excitation wavelength was 300 nm and the slit width was 1 nm.
The photocatalytic activities of CuMoO4 were assessed with rhodamine B (C28H31ClN2O3) (Tianjin Bodi Chemical Co., Ltd., Tianjin, China) or 1H-benzotriazole (C6H5N3) as the model substance. The photoreaction was implemented in a photochemical reaction apparatus (Nanjing Xujiang Machine Plant, Nanjing, China). The inner structure of the reaction apparatus was as follows: the lamp was put into a hollow quartz hydrazine structure, and laid in the middle of the reactor. The recycling water which flowed through the reactor was kept at a near constant reaction temperature (20 °C), and the solution was continuously stirred and aerated. Twelve holes were utilized for the insertion of quartz tubes which were evenly arranged around the lamp, and the distances between the lamp and each hole were equal. The photocatalyst within the rhodamine B solution or 1H-benzotriazole solution was in a state of suspension under the condition of magnetic stirring. In this paper, the photocatalytic degradation of rhodamine B or 1H-benzotriazole was carried out with 25 mg of CuMoO4 in 50 mL and 20 mg L−1 pollutant aqueous solutions in quartz tubes with a 500 W xenon lamp (the main range of wavelength was from 420 nm to 800 nm) as the visible light source. Prior to visible light irradiation, the suspensions which contained the catalyst and pollutant solution were magnetically stirred in darkness for 30 min to ensure the establishment of an adsorption/desorption equilibrium among CuMoO4, the pollutant and atmospheric oxygen. During visible light illumination, the suspension was stirred at 500 r s−1. The above experiments were carried out under conditions of oxygen saturation ([O2]sat = 1.02 × 10⁻³ mol L−1). One of the quartz tubes was taken out of the photochemical reaction apparatus at various time intervals. The suspension was filtered through 0.22 μm membrane filters. The rhodamine B filtrate was subsequently analyzed with a Shimadzu UV-2450 spectrometer (Shimadzu, Santa Clara, California, USA) with a detection wavelength of 554 nm. The 1H-benzotriazole filtrate was analyzed by liquid chromatography (LC, Dionex UltiMate 3000, Dionex, USA) with an EC-C18 column (5 μm, 4.6 mm × 250 mm). The mobile phase was a mixed solution of ultrapure water (A) and methyl alcohol (B) with a flow rate of 0.8 mL min−1 and an injection volume of 20 μL. The linear gradient elution method was determined as follows: the initial 90% A was reduced to 10% A within 20 min. Then the mobile phase was 100% B for 10 min. The column temperature was 303 K (30 °C).
The intermediate degradation products of rhodamine B were monitored with a liquid chromatography/mass spectrometer (LC/MS, Agilent 6530 Accurate-Mass Q-TOF LC/MS, Agilent, USA) with an EC-C18 column (2.7 μm, 4.6 mm × 50 mm) and a mode of positive electrospray ionization (ESI+). The mobile phase was a mixed solution of ultrapure water and methyl alcohol with a flow rate of 0.4 mL min−1 and the injection volume was 4 μL. The linear gradient elution method was determined as follows: the initial 90% ultrapure water was reduced to 10% ultrapure water within 13 min. Subsequently the mobile phase was 100% methyl alcohol for 5 min and the column temperature was 303 K (30 °C).
3 Results and discussion
3.1 Powder synthesis
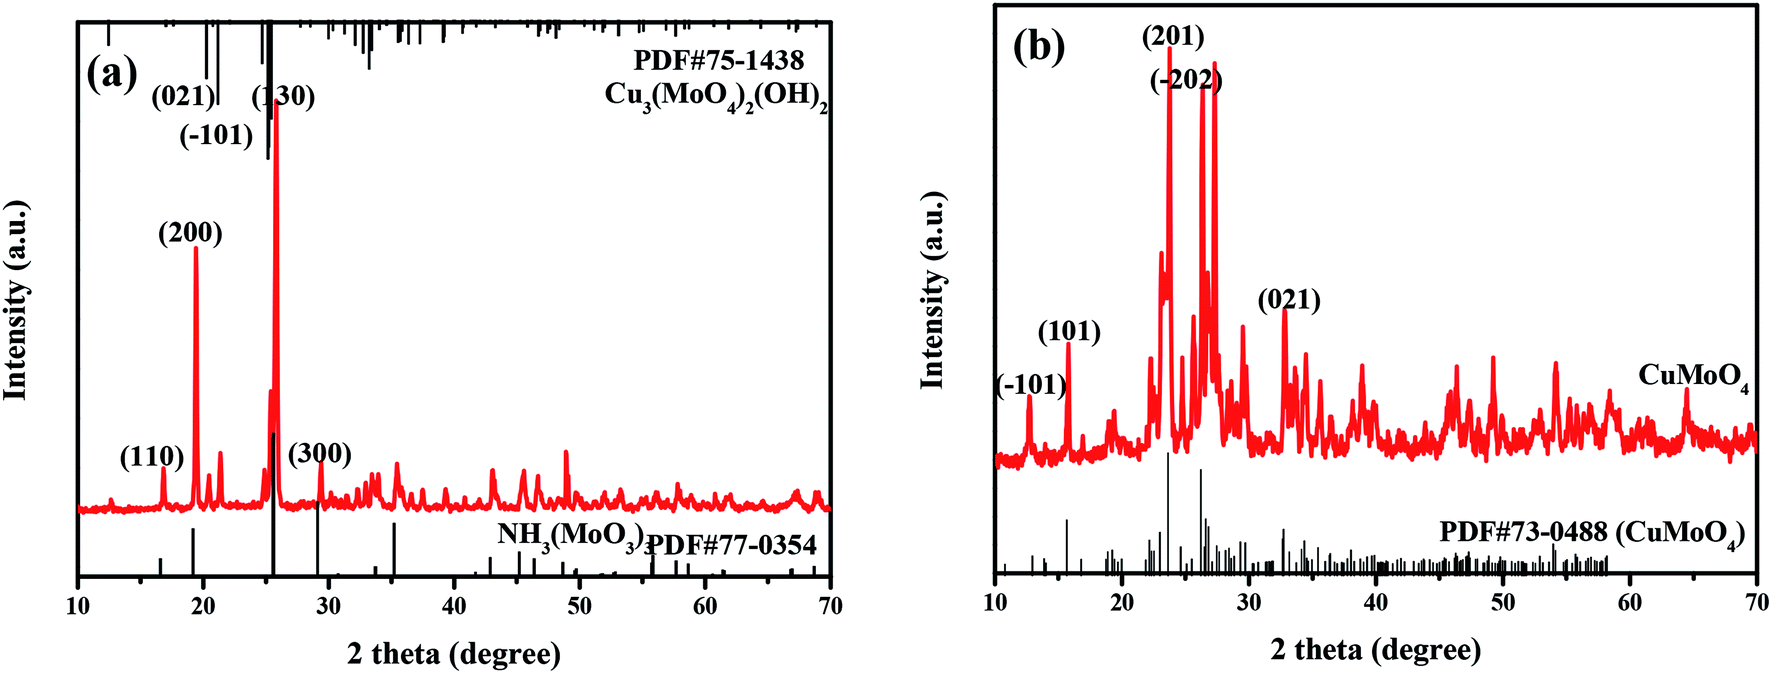
The phase structure and crystal structure of the as-prepared samples were further analyzed by the XRD method. The XRD patterns as well as the PDF standard cards of CuMoO4 together with its precursors are shown in Fig. 1. As can be seen from Fig. 1, the sample CuMoO4 and its precursors were consistent with the corresponding PDF card, indicating that the samples were successfully synthesized. Among them, the precursors which generated CuMoO4 corresponded to Cu3(MoO4)2(OH)2 and NH3(MoO3)3. After calcination at 500 °C, the prepared sample CuMoO4 was obtained from the precursors. The following reaction occurred during the calcination process:| | |
3Cu3(MoO4)2(OH)2 + NH3(MoO3)3 → 9CuMoO4 + NH3↑ + 3H2O
| (1) |
 |
| | Fig. 1 The XRD patterns of (a) Cu3(MoO4)2(OH)2 and NH3(MoO3)3, and (b) CuMoO4. | |
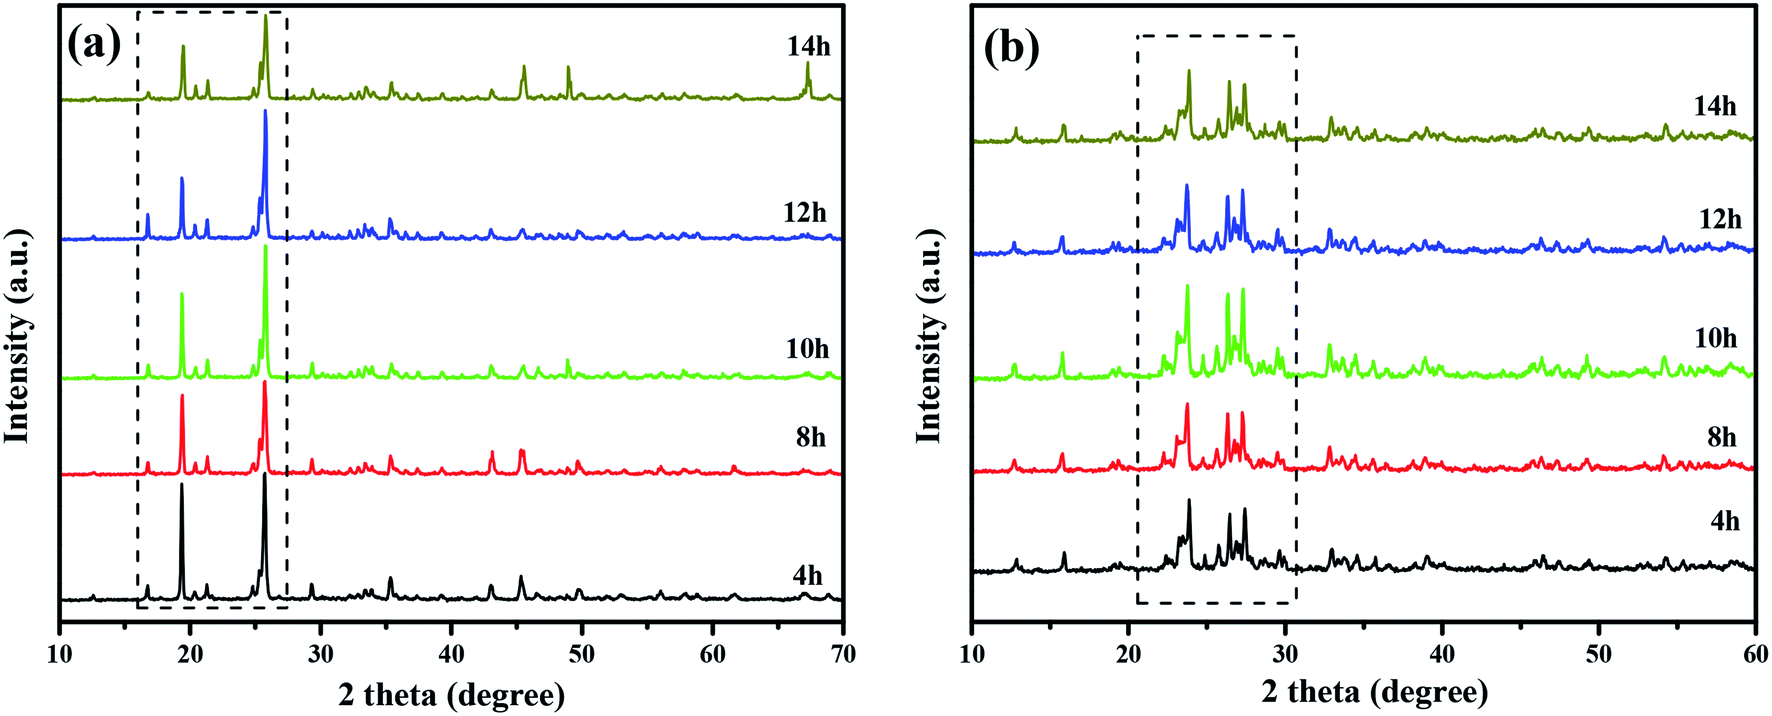
Fig. 2 shows the XRD patterns of CuMoO4 and its precursors under different conditions of hydrothermal time. Fig. 4 shows the SEM images of CuMoO4 at different hydrothermal times. Firstly, under different hydrothermal time conditions, CuMoO4 was consistent with the corresponding standard cards, indicating that the synthesized products were independent of the hydrothermal time. However, the intensity of the XRD peaks for CuMoO4 varied with different hydrothermal times. The XRD peak intensity of CuMoO4 was the highest under hydrothermal conditions for 10 h. And at this point the performance of the precursors was consistent with the results of the product CuMoO4. The intensity of the XRD peaks indicated that the crystallinity was good to some extent, which was important for the catalytic performance of the sample. Furthermore, the exposed crystal faces of the main peak for CuMoO4 were (101), (201) and (−202). Optimization of these exposed crystal faces was one method for improving the catalytic performance of the photocatalysts.
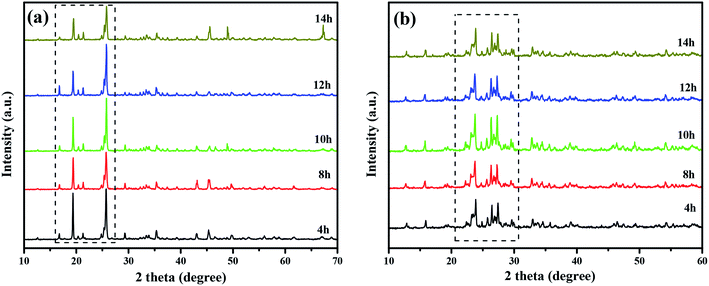 |
| | Fig. 2 The XRD patterns of (a) the CuMoO4 precursor at different hydrothermal times and (b) CuMoO4 at different hydrothermal times. | |
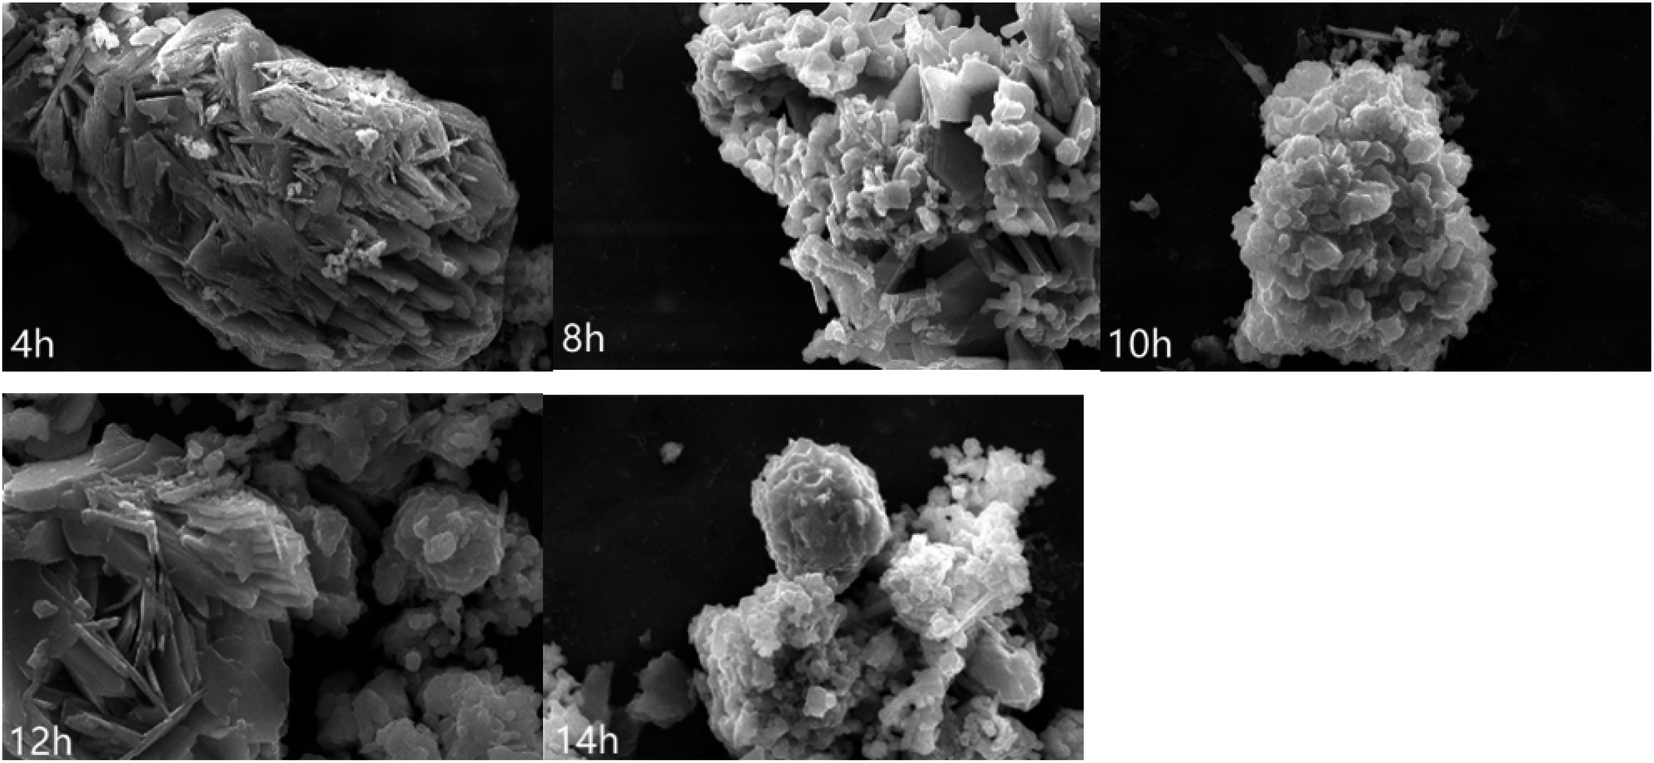
It can be seen from Fig. 3 that CuMoO4 was granulated and aggregated into a mass. When the hydrothermal time increased, the particles of CuMoO4 became more and more round.
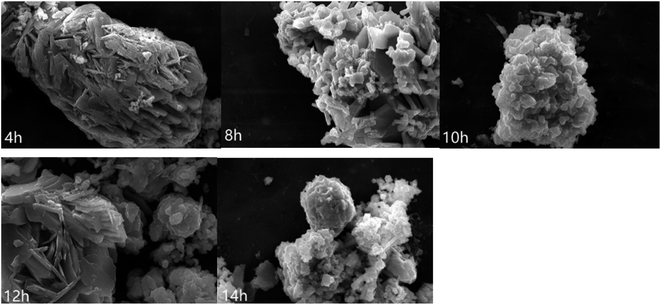 |
| | Fig. 3 SEM images of CuMoO4 at different hydrothermal times. | |
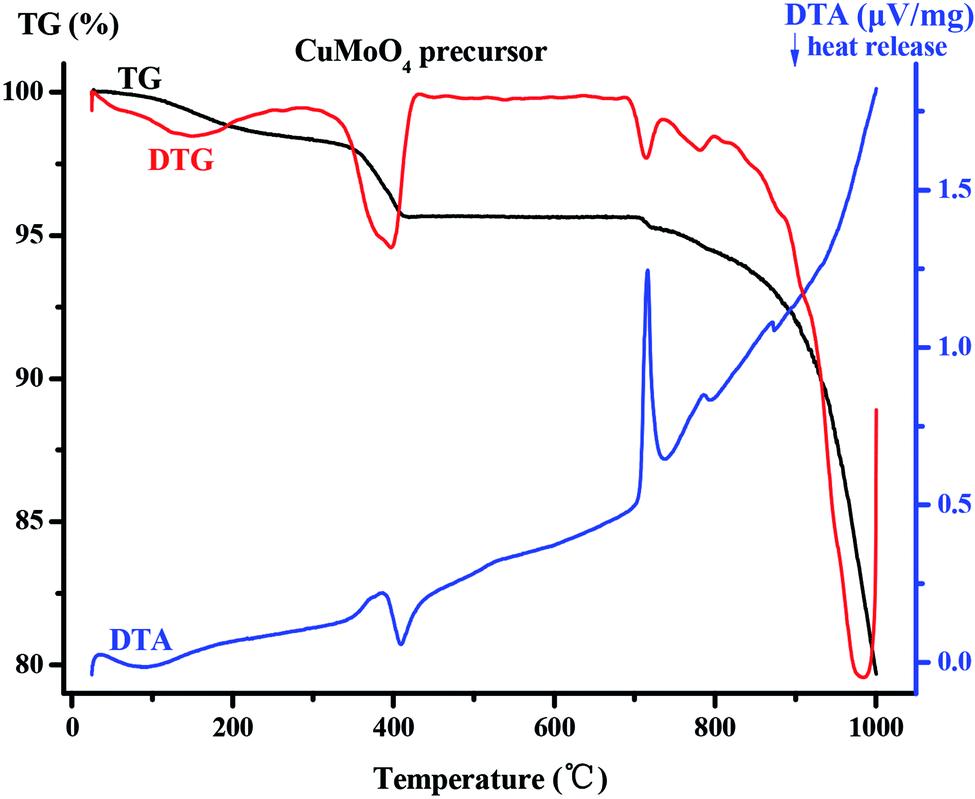
Fig. 4(a) shows the XRD patterns of CuMoO4 at different hydrothermal temperatures and Fig. 4(b) shows the SEM image of CuMoO4 at 200 °C. In Section 2.1, we demonstrated the ability to synthesize CuMoO4 with copper chloride and ammonium heptamolybdate. However, in the next experiment we found an interesting phenomenon which was that CuCl2·2H2O and (NH4)6Mo7O24·4H2O could be used to obtain Cu3Mo2O9 under certain conditions, and the above phenomenon was caused by temperature, as shown in Fig. 4(a). When the hydrothermal temperature was lowered below 150 °C, the substance which was synthesized with CuCl2·2H2O and (NH4)6Mo7O24·4H2O did not match with the X-ray diffraction standard card of CuMoO4, but matched the X-ray diffraction standard card of Cu3Mo2O9. The reason was that CuCl2·2H2O and (NH4)6Mo7O24·4H2O could not form NH3(MoO3)3 under a hydrothermal temperature of 150 °C, and only Cu3(MoO4)2(OH)2 was formed in the PTFE lining; as a result, a final product of Cu3Mo2O9 was produced. In other words, only when the hydrothermal temperature reached 180 °C or higher, could NH3(MoO3)3 be generated under high-temperature and high-pressure conditions; as a result, the final product CuMoO4 could be produced. And when the hydrothermal temperature was raised to 200 °C, it can be clearly seen from Fig. 4(b) that the particles of CuMoO4 became rounded and tiny. The above analysis also revealed that the increase in temperature was beneficial for the successful synthesis of the sample under critical hydrothermal conditions. Fig. S1† shows a schematic diagram of the synthesis route for the product CuMoO4. A comprehensive thermal analysis of CuMoO4's precursors is shown in Fig. 5. Combining the above analysis with the comprehensive thermal analysis which was shown in Fig. 5, the synthetic pathways of CuMoO4 could be roughly inferred, as shown in Fig. S1.†
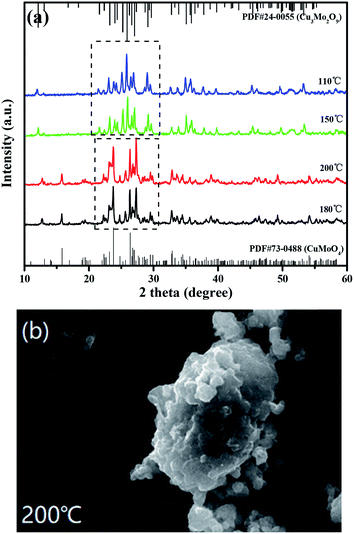 |
| | Fig. 4 (a) XRD patterns of CuMoO4 at different hydrothermal temperatures and (b) an SEM image of CuMoO4 at 200 °C. | |
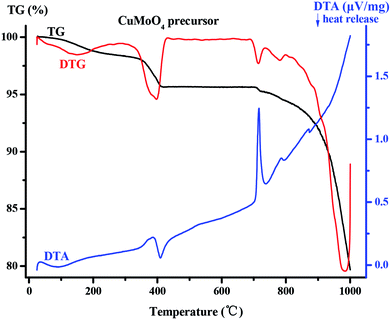 |
| | Fig. 5 Comprehensive thermal analysis of the CuMoO4 precursor. | |
As for CuMoO4's precursor which can be found in Fig. 5, the TG-DTA curve can also be divided into two stages. In the first stage, CuMoO4's precursor lost a part of the weight in the range 200–412 °C, and the DTA curve in this temperature range had an exothermic peak. This was due to a thermal decomposition reaction which occurred in this process: 3Cu3(MoO4)2(OH)2 + NH3(MoO3)3 = 9CuMoO4 + NH3 + 3H2O. In the second stage, new-phase CuMoO4 had been losing weight in the range 687–1000 °C, and at this time DTA had a sharp endothermic peak, which was caused by the melting of CuMoO4 and volatilization of CuMoO4. The total weight loss ratio of CuMoO4's precursor in the range 0–1000 °C was 20.32%.
3.2 Characterization of CuMoO4
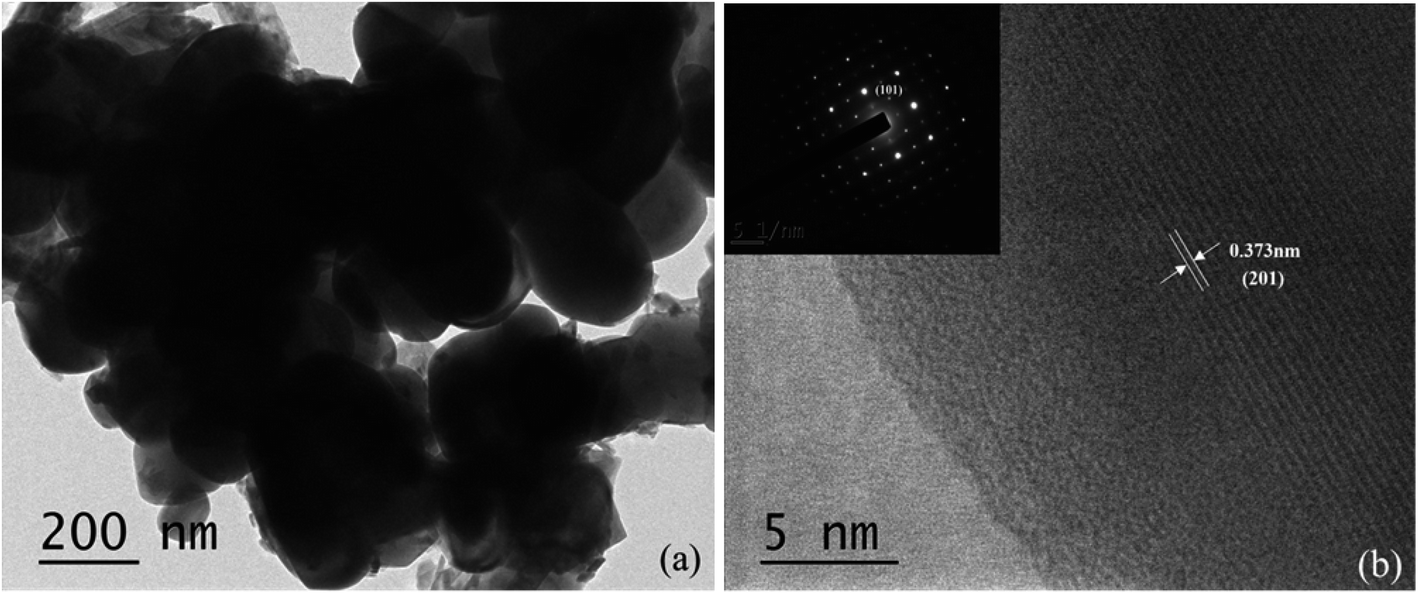
Fig. 6 shows a TEM image of CuMoO4 as well as the selected-area electron diffraction (SAED) pattern and lattice fringe of CuMoO4. It can clearly be seen that the microstructure and the interface properties of the CuMoO4 powders were further characterized. Fig. 6(a) shows that CuMoO4 was granular, and the above results are consistent with the SEM results for CuMoO4. The inset within Fig. 6(b) presents the selected-area electron diffraction pattern, which can further confirm that the sample CuMoO4 was single crystalline. The selected-area electron diffraction pattern of CuMoO4 conformed to the triclinic system, and the crystal plane in the selected-area electron diffraction pattern had (201) and (101) faces, and the lattice stripe pitch was 0.373 nm, which corresponded to the (201) crystal plane. This result was consistent with the crystal faces which corresponded to the XRD peaks of CuMoO4.
 |
| | Fig. 6 (a) A TEM image of CuMoO4, and (b) an SAED pattern of CuMoO4 and the lattice fringe of CuMoO4. | |
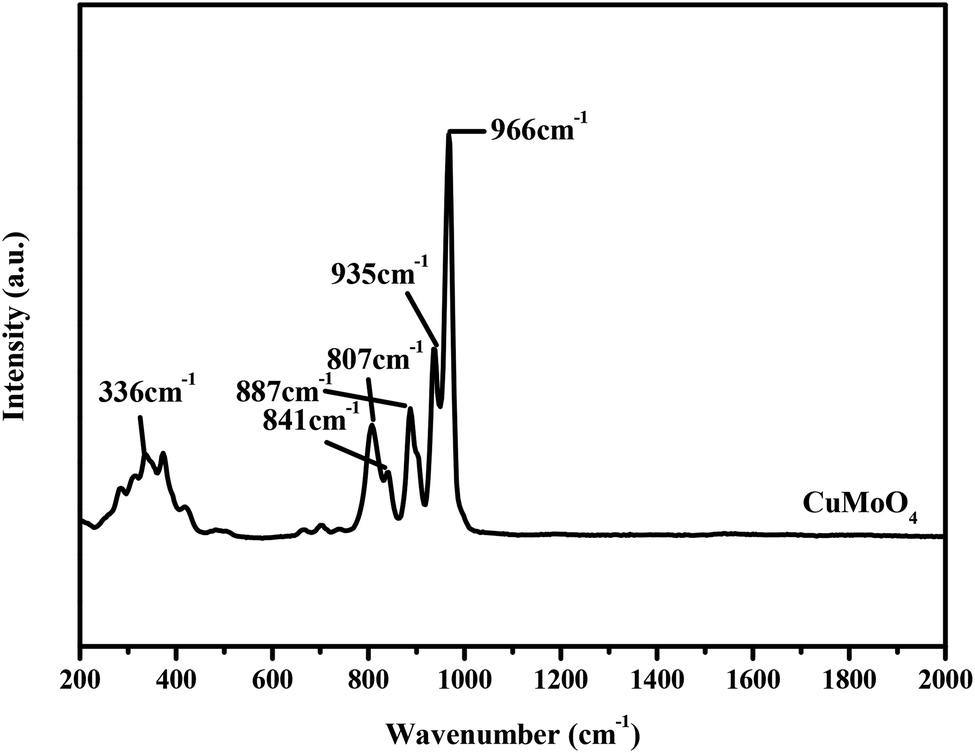
Fig. 7 shows the FTIR spectrum of CuMoO4. The FTIR spectrum analysis of CuMoO4 particles was investigated in detail. According to Fig. 7, we can see that the absorption bands of CuMoO4 that was prepared by a hydrothermal method were mainly concentrated within 1000 cm−1. The absorption peaks at 480–510 cm−1 for CuMoO4 were due to Cu–O bonds. In combination with the Raman spectrum (Fig. 8), the peaks at 796–937 cm−1 might correspond to the stretching vibration modes of the MoO4 tetrahedron. For a tetrahedral ion such as MoO4, the asymmetric Mo–O stretching is intensive in the FTIR spectrum, and weak in the Raman spectrum. In contrast, the symmetric Mo–O stretching is very weak in the FTIR spectrum and very intense in the Raman spectrum. This meant that the band at 966 cm−1 (Fig. 8) might only be the symmetric Mo–O stretching (strongest in the Raman spectrum, and weak in the FTIR spectrum). Similarly, the other three bands at 796–937 cm−1 (weak in the Raman spectrum, strong in the FTIR spectrum) belong to the three components of the Mo–O asymmetric stretching mode (F2, triple degenerated).17
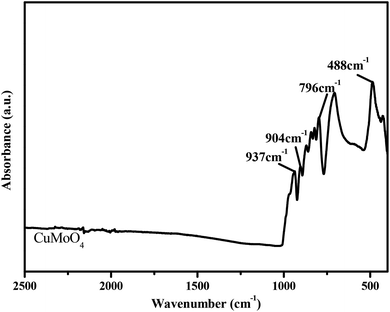 |
| | Fig. 7 The FTIR spectrum of CuMoO4. | |
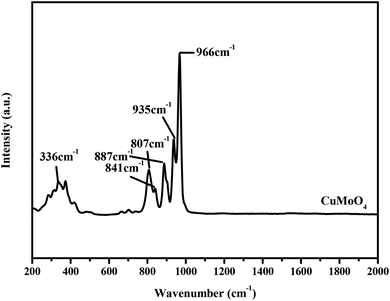 |
| | Fig. 8 The Raman spectrum of CuMoO4. | |
The Raman spectrum was used to further examine the structural properties of the prepared photocatalysts. The Raman spectrum of CuMoO4 is shown in Fig. 8. It can be observed from the Raman spectrum of CuMoO4 that the mode around 336 cm−1 is the bending vibration which corresponds to CuO.33,34 The stretching vibration modes of the MoO4 tetrahedron were observed at around 807 cm−1, 841 cm−1, 935 cm−1 and 966 cm−1.35–37 The characteristic peak around 935 cm−1 corresponded to the symmetric stretching vibration peak of Mo![[double bond, length as m-dash]](https://www.rsc.org/images/entities/char_e001.gif) O.38 Based on the above analysis, we can deduce that the characteristic peaks at 807 cm−1, 841 cm−1 and 935 cm−1 for CuMoO4 correspond to the stretching vibration modes of the MoO4 tetrahedron. According to Berrclough,39 the peak around 887 cm−1 for CuMoO4 corresponded to the Mo–O (3,3′) vibration.
O.38 Based on the above analysis, we can deduce that the characteristic peaks at 807 cm−1, 841 cm−1 and 935 cm−1 for CuMoO4 correspond to the stretching vibration modes of the MoO4 tetrahedron. According to Berrclough,39 the peak around 887 cm−1 for CuMoO4 corresponded to the Mo–O (3,3′) vibration.
In order to gain further insight into the interfacial electronic structures, we used the XPS technology to investigate the surface electronic structure and bonding configuration of CuMoO4. The survey XPS spectra of CuMoO4 are shown in Fig. 9(a–d). The peaks which originated from Fig. 9 corresponded to the C element, Cu element, Mo element and O element, which were also observed in the survey XPS spectra of CuMoO4. In the survey XPS spectra, the peak at 284.0 eV was attributable to the adventitious carbon in CuMoO4, and the adventitious carbon was determined to be standard carbon. In the O 1s spectrum of CuMoO4, the asymmetric peak at 530.8 eV was assigned to the binding energy of O2− species characteristic of oxide materials.40 The shoulder peak which was observed at 530.2 eV could be attributed to the chemisorbed oxygen species on the surface of CuMoO4. In the fitted peaks of Cu 2p in CuMoO4, a major peak at 934.8 eV with a shoulder at 932.1 eV was ascribed to the 2p3/2 core level of Cu2+. The binding energy of Mo 3d of CuMoO4 was 232.7 eV or 235.8 eV.
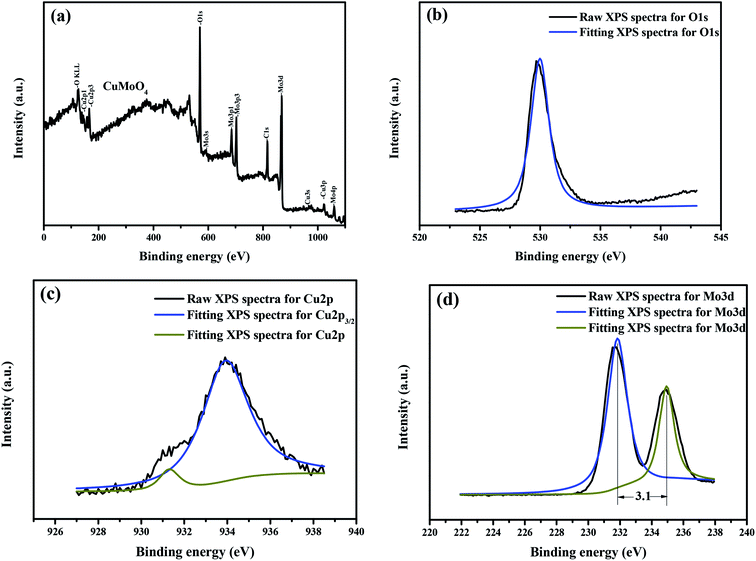 |
| | Fig. 9 CuMoO4, Cu element, Mo element and O element XPS spectra: (a) full XPS spectra of CuMoO4, (b) XPS spectrum of O 1s, (c) XPS spectrum of Cu 2p and (d) XPS spectrum of Mo 3d. | |
Table 1 provides the experimental binding energies of the characteristic peaks of all elements which exist in CuMoO4 and the binding energy information after C correction. The distance of the Mo element peaks was 3.1 eV, as shown in Fig. 9(d). By comparing the XPS standard binding energy data which is shown in Table 1 and the chemical shifts of each element, the valence state of each element in CuMoO4 was determined, and the results showed that the valence states of Cu, Mo or O are +2, +6 or −2.
Table 1 Binding energies for key elements of CuMoO4
| CuMoO4 |
Cu 2p3/2 |
Mo 3d3/2 |
Mo 3d5/2 |
O 1s |
C 1s |
| Binding energy/eV |
934.0 |
235.0 |
231.9 |
530.0 |
284.0 |
| Binding energy after C correction/eV |
934.8 |
235.8 |
232.7 |
530.8 |
284.8 |
3.3 Photocatalytic performance characterization of CuMoO4
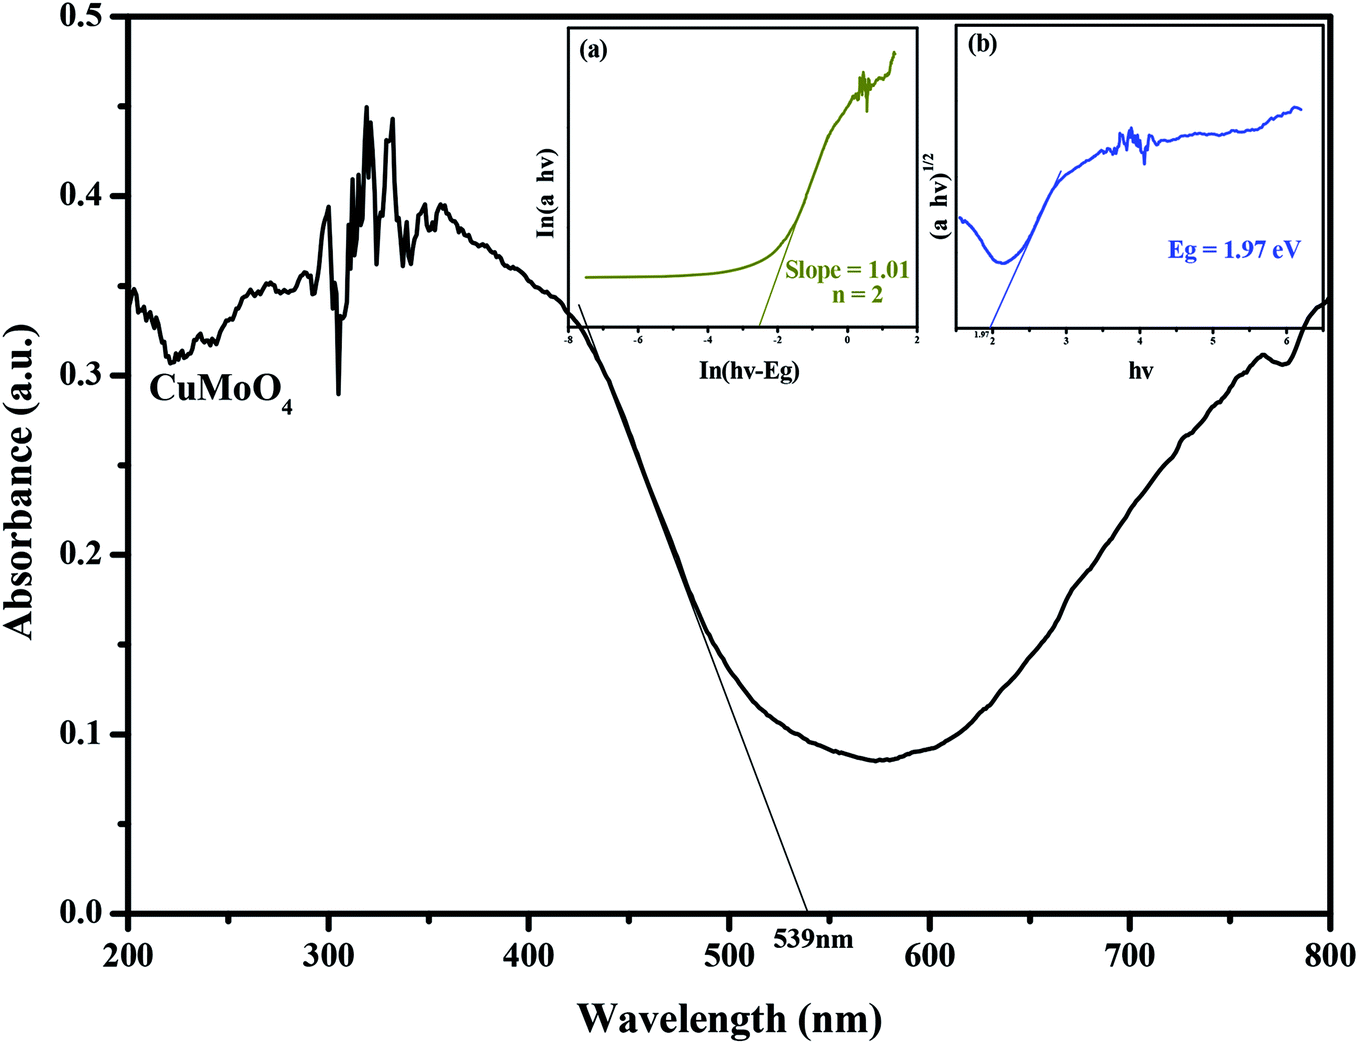
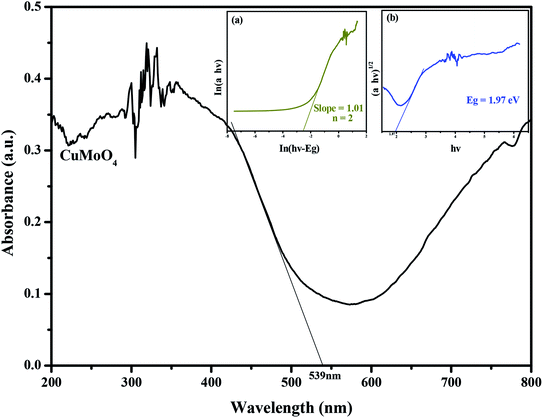
Fig. 10 shows the diffuse reflection spectra of CuMoO4. The optical absorption properties of the as-synthesized samples were studied by UV-vis diffuse reflectance spectroscopy, as shown in Fig. 10.
 |
| | Fig. 10 The diffuse reflection spectrum of CuMoO4. Insets: (a) plot of ln(αhν) versus ln(hν − Eg) and (b) plot of (αhν)1/2 versus hν. | |
The absorption spectrum of CuMoO4 can be found in Fig. 10. For a crystalline semiconductor, the optical absorption near the band edge of the crystalline semiconductor follows eqn (2):41
where
A,
α,
Eg,
ν and
λ are the proportional constant, absorption coefficient, band gap, light frequency and the wavelength which correspond to the absorption edge, respectively. In the above equation,
n determines the character of the transition in a semiconductor.
Eg and
n could be calculated by the following steps: (i) plotting ln(
αhν)
versus ln(
hν −
Eg) by assuming an approximate value of
Eg, which can be calculated from
eqn (3); (ii) deducing the value of
n; and (iii) refining the value of
Eg. From
Fig. 10, we find that the absorption edge of CuMoO
4 is about 539 nm, indicating that the estimated
Eg of CuMoO
4 was 2.30 eV. Subsequently, from the plot of ln(
αhν)
versus ln(
hν −
Eg), we find that the slope of the line part was about 1.01. Therefore, the
n which derived from CuMoO
4 was 2. After plotting (
αhν)
2 versus hν and extrapolating the plot to (
αhν)
2 = 0, the accurate value of
Eg for CuMoO
4 was calculated to be 1.97 eV. The above results indicated that the optical transition for CuMoO
4 was indirectly allowed, and, at the same time, CuMoO
4 possessed a narrow band gap.
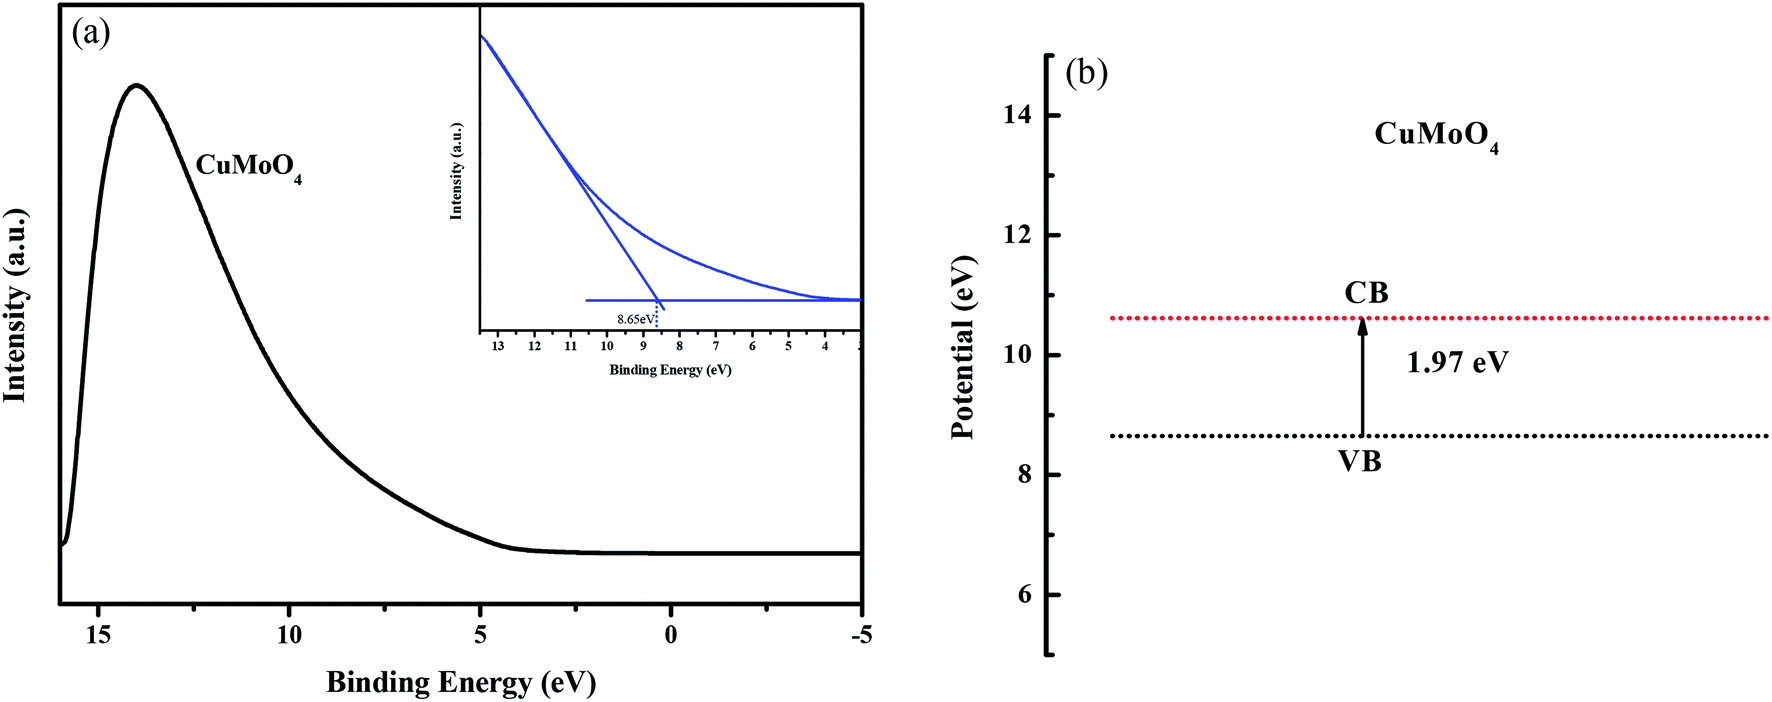
Fig. 11(a) shows the ultraviolet photoelectron spectroscopy (UPS) spectra of CuMoO4. According to the UPS results, the value of the valence band of CuMoO4 was calculated to be 8.65 eV which was related to the Fermi energy. Combined with the band gap, the value of the conduction band of CuMoO4 was found to be 10.62 eV. The band structure of CuMoO4 is shown in Fig. 11(b).
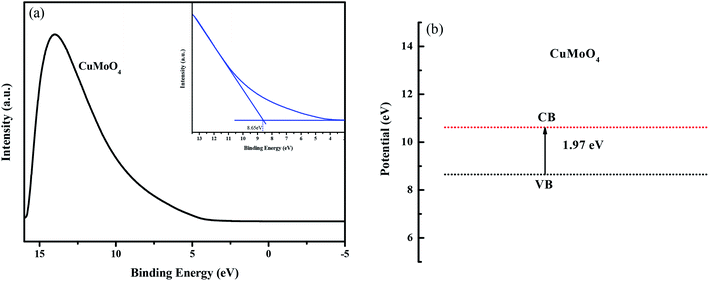 |
| | Fig. 11 (a) UPS spectrum of CuMoO4, and (b) the band structure of CuMoO4, which was related to the Fermi energy. | |
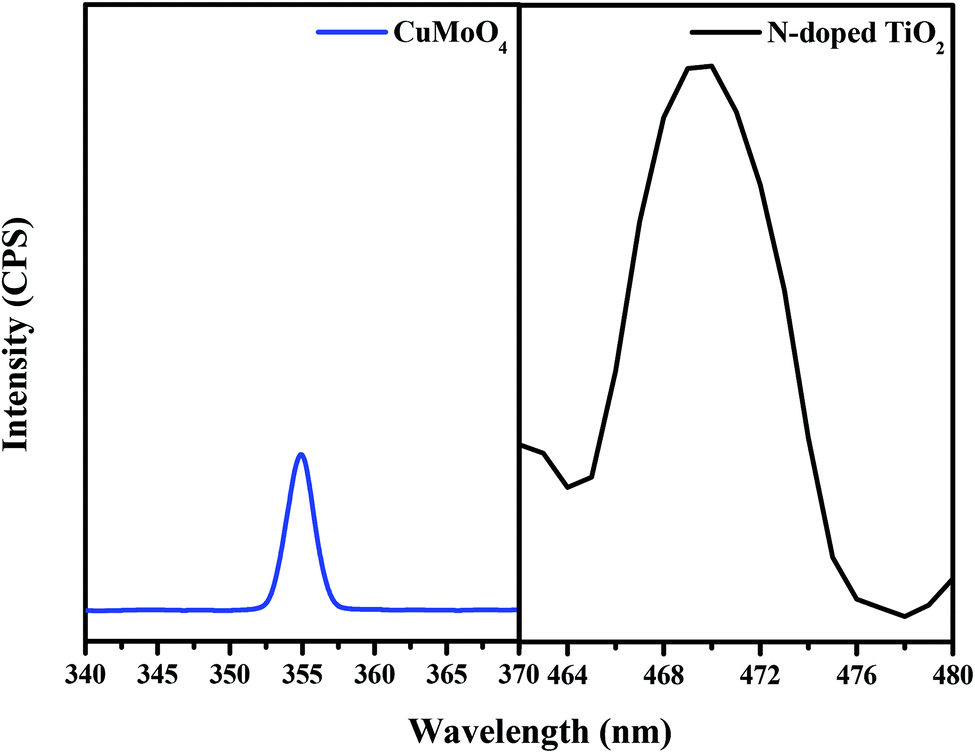
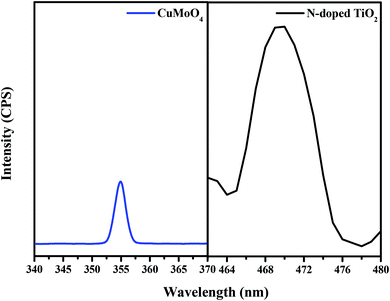
Fig. 12 presents the photoluminescence (PL) spectra of both N-doped TiO2 and CuMoO4 photocatalysts with an excitation wavelength of 300 nm. CuMoO4 showed a sharp emission peak at 355 nm. The PL spectra revealed that the emission of CuMoO4 was strongly dependent on its crystallinity. Benchikhi et al. attributed the PL emission of CuMoO4 to the intrinsic slightly distorted [MoO42−] tetrahedra.42 On the other hand, PL spectroscopy is a method for exploring both the transfer process of the charge carrier on the interface of photocatalysts and the recombination rate involved with the photogenerated electron–hole pairs. Herein, the PL spectra were employed to reveal the recombination abilities of N-doped TiO2 or CuMoO4. The intensity of the PL spectra for N-doped TiO2 was very much higher than that for CuMoO4. This showed that CuMoO4 had a lower recombination rate of photogenerated electron–hole pairs, which was more conducive to the progress of photocatalytic reactions.
 |
| | Fig. 12 Photoluminescence spectra of CuMoO4 and N-doped TiO2. | |
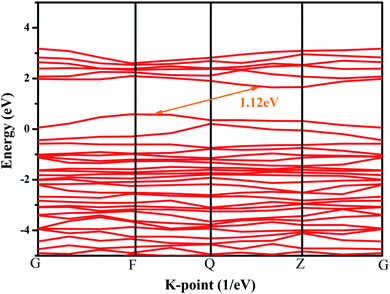
In order to further explore the photocatalytic properties of CuMoO4, the band structure of CuMoO4 was calculated. According to the DFT calculations, the band structure of CuMoO4 is shown in Fig. 13. For the band structure diagram, the k-points path G–F–Q–Z–G is presented in detail.43 The top of the valence band lay between the F point and the Q point, and the bottom of the conduction band was located between the Q point and the Z point. It was found that CuMoO4 was an indirect band gap semiconductor; moreover, the valence band maximum and conduction band minimum of the calculated CuMoO4 were not located at the same k-point. Therefore, in this case, the value of n in eqn (2) was 2, which was consistent with the results of the diffuse reflectance spectrum of CuMoO4. In contrast, the calculated band gap of CuMoO4 was only 1.12 eV. The reason was that the description of exchange–correlation effects utilized the general gradient approximation (GGA), which always leads to an under-estimation of band gaps for transition metals, resulting in a difference from the experimental result.44,45
 |
| | Fig. 13 Band structure of CuMoO4 from DFT calculations. | |
3.4 Photocatalytic properties of CuMoO4
The progress of photocatalysis with the semiconductor compound as catalyst could be described briefly as follows.46,47 Firstly, the semiconductor compound absorbs photons. As a result, photoinduced electron–hole pairs are generated within the semiconductor compound particles. Subsequently, the diffusion of the charge carriers to the surface of the semiconductor compound particle would follow. At the same time, the active sites of the surface of the semiconductor compound particles might adsorb a lot of organic pollutant particles. Finally, the decomposition of the organic pollutants would be performed by charge carriers.
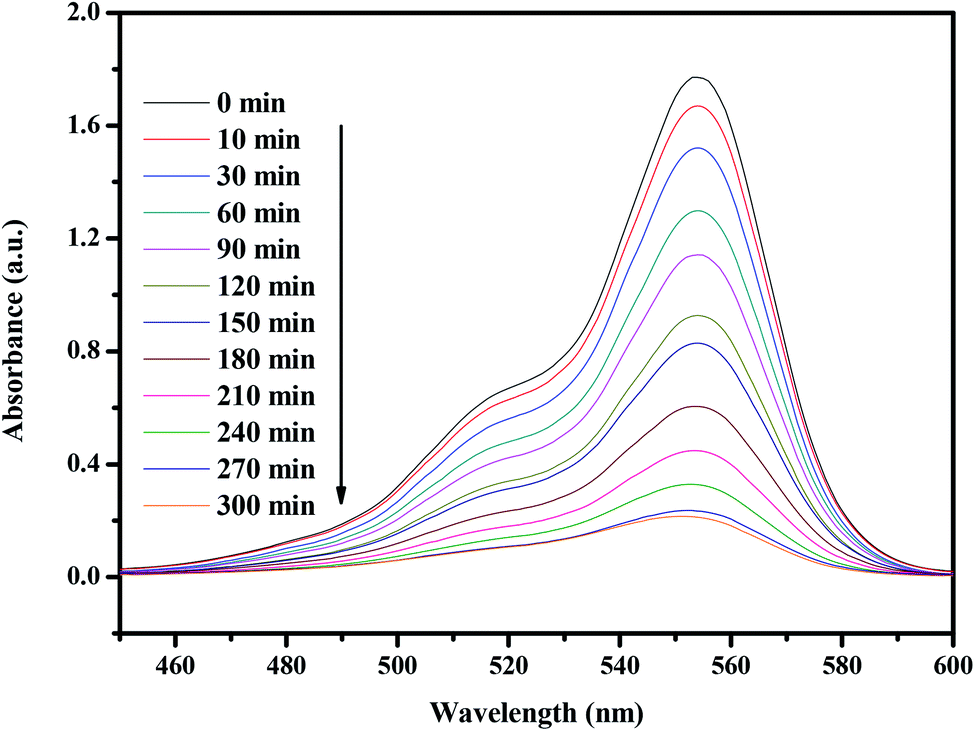
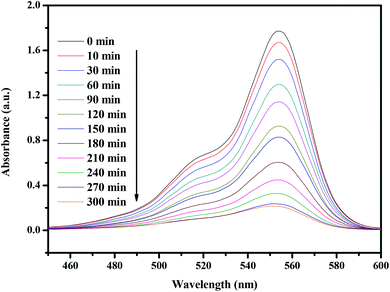
Fig. 14 presents the changes in the UV-vis spectra of rhodamine B under visible light irradiation (λ > 420 nm) in the presence of CuMoO4. The above measurements were performed under conditions of oxygen saturation ([O2]sat = 1.02 × 10⁻³ mol L−1). It can clearly be seen from Fig. 14 that the typical rhodamine B peak is at 554 nm. An obvious reduction in absorbance could be observed within 300 minutes.
 |
| | Fig. 14 Spectral changes of aqueous solutions of rhodamine B due to visible light irradiation in the presence of CuMoO4. | |
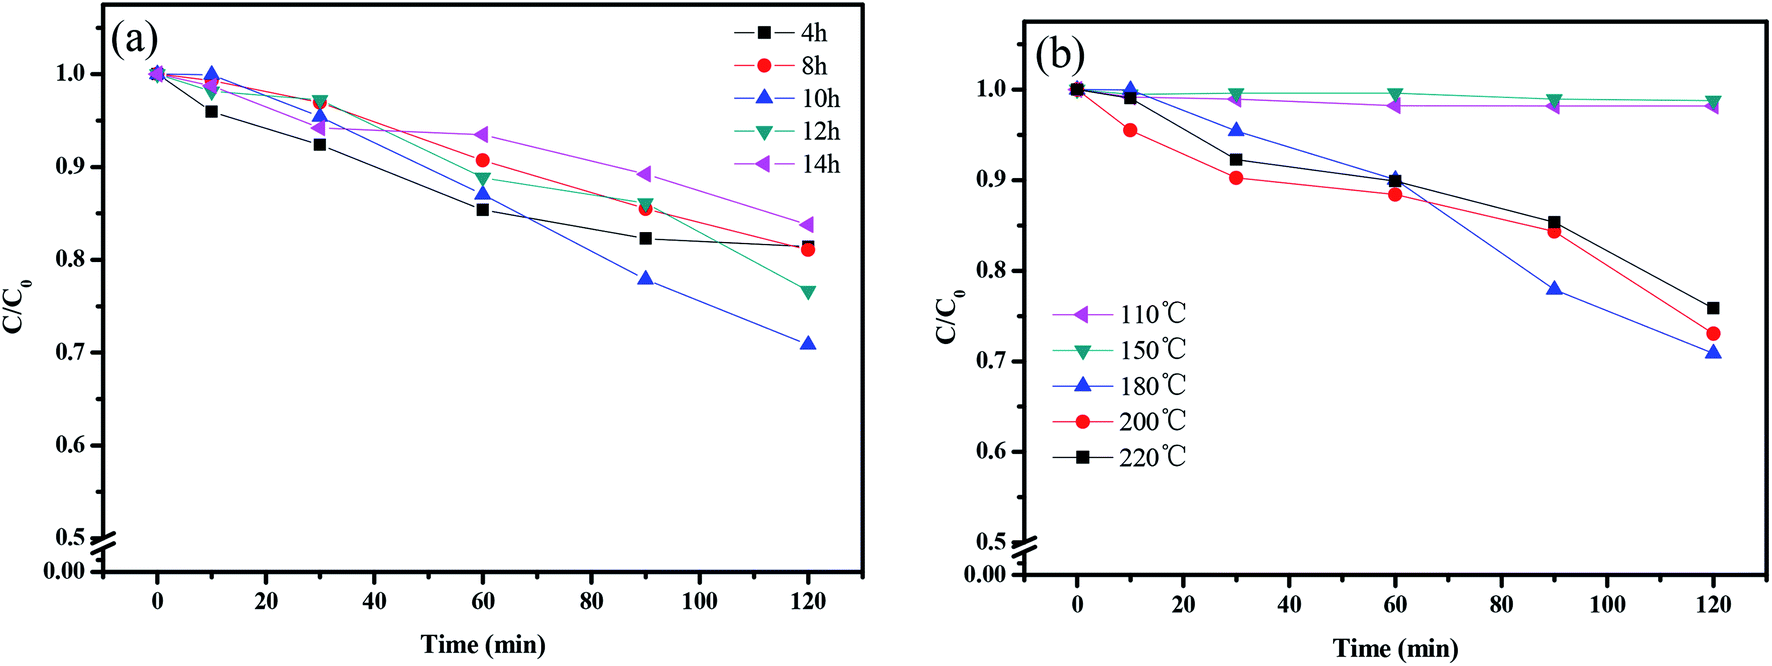
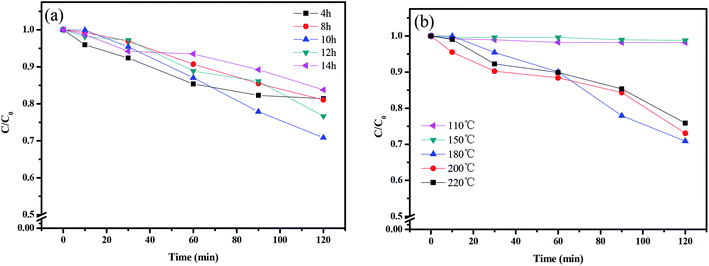
Fig. 15 shows the photocatalytic removal efficiency of rhodamine B under visible light irradiation for 120 min with CuMoO4 as photocatalyst using different hydrothermal times or temperatures. It can be seen from Fig. 15(a) that the CuMoO4-10 h group had the highest degradation efficiency for rhodamine B, and the degradation rate reached 30% within 120 min. The lowest degradation efficiency was with the CuMoO4-14 h group. Anyway, CuMoO4 still had a degradation effect on rhodamine B at different hydrothermal times under visible light irradiation. Fig. 15(b) shows the degradation of rhodamine B by the products which were synthesized at different hydrothermal temperatures. At a hydrothermal temperature of 110 °C or 150 °C, the sample had almost no degradation efficiency for rhodamine B. This was due to the product which was synthesized being Cu3Mo2O9 at this time instead of CuMoO4, which was consistent with the results of the previous analysis. The highest degradation efficiency came from CuMoO4 which was synthesized at a hydrothermal temperature of 180 °C.
 |
| | Fig. 15 The photodegradation of rhodamine B with (a) different hydrothermal times and (b) different hydrothermal temperatures in the presence of CuMoO4. | |
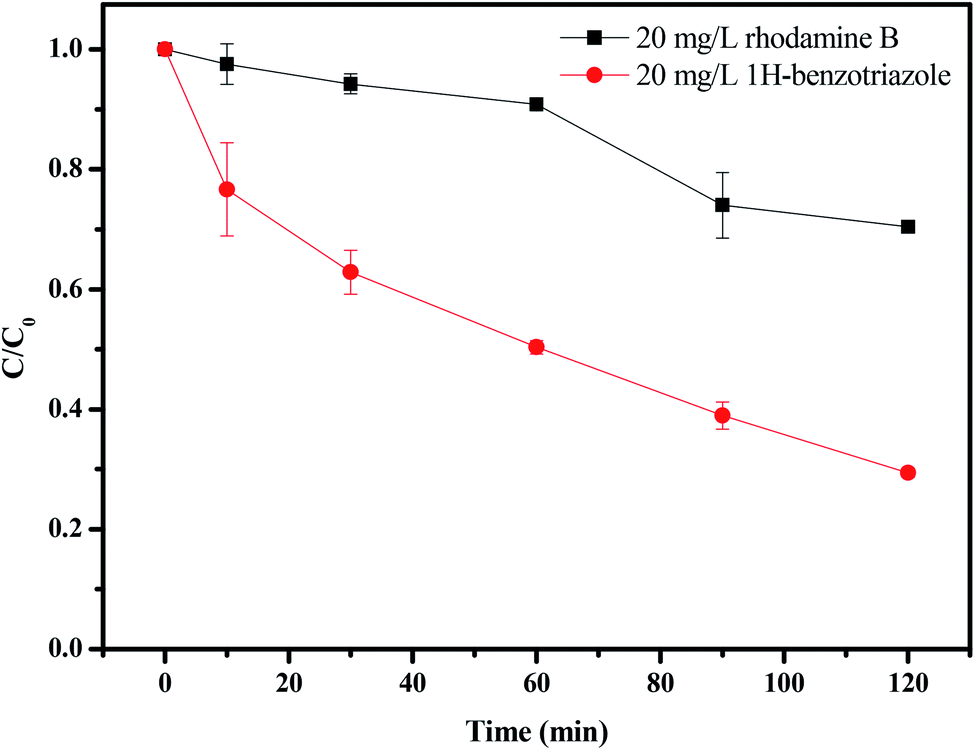
Fig. 16 and 17 show the photocatalytic degradation rate for rhodamine B or 1H-benzotriazole under visible light irradiation in the presence of CuMoO4. When rhodamine B was used as a contaminant, the photodegradation rate was 29.12% after visible light irradiation for 120 minutes, while the photodegradation rate for 1H-benzotriazole was 71.13% by CuMoO4. Based on the absorbance changes of rhodamine B with light irradiation time, the kinetic curves of rhodamine B degradation under visible light irradiation were figured out (Fig. S2(a)†). The first-order rate constant for CuMoO4 was estimated to be 0.00297 min−1 or 0.00933 min−1 with rhodamine B or 1H-benzotriazole as contaminant, respectively. This fact indicated that CuMoO4 was more efficient at degrading 1H-benzotriazole than rhodamine B under visible light irradiation.
 |
| | Fig. 16 The photodegradation of rhodamine B and 1H-benzotriazole under visible light irradiation in the presence of CuMoO4. | |
 |
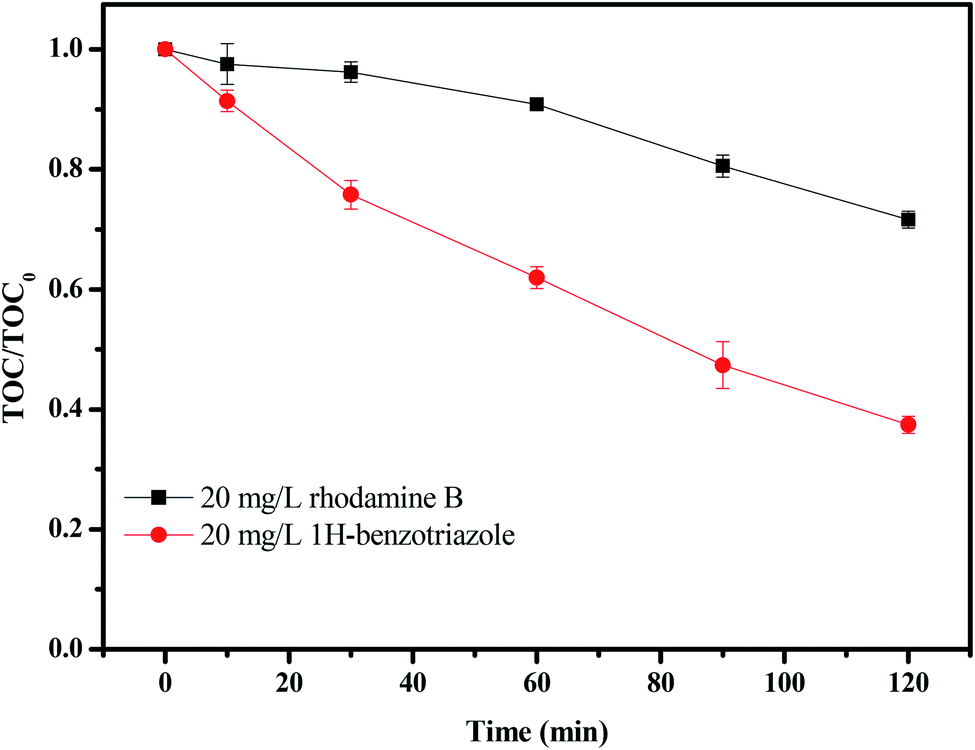
| | Fig. 17 TOC plots during the photocatalytic degradation of rhodamine B and 1H-benzotriazole under visible light irradiation in the presence of CuMoO4. | |
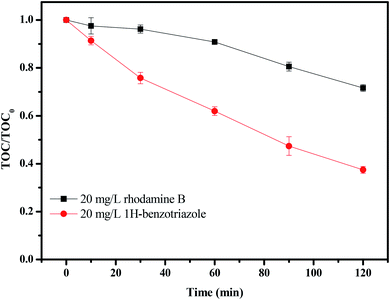
Fig. 17 shows the change in total organic carbon (TOC) during the photocatalytic degradation of rhodamine B or 1H-benzotriazole under visible light irradiation in the presence of CuMoO4. TOC was measured using a TOC detector (TOC, vario TOC, Elementar, Germany). It has a detection limit of 2 μg L−1 and an accuracy of RSD (C) < 1%. The TOC measurements revealed the disappearance of organic carbon when the IC solution which contained CuMoO4 or N-TiO2 was exposed to visible light irradiation. The results showed that 27.38% of the TOC decrease was obtained after visible light irradiation for 120 minutes when rhodamine B was degraded, while 63.58% of TOC had decreased when 1H-benzotriazole was degraded. The apparent first-order rate constant k was estimated to be 0.00268 or 0.00852 min−1 with rhodamine B or 1H-benzotriazole as the contaminant, respectively (Fig. S2(b)†).
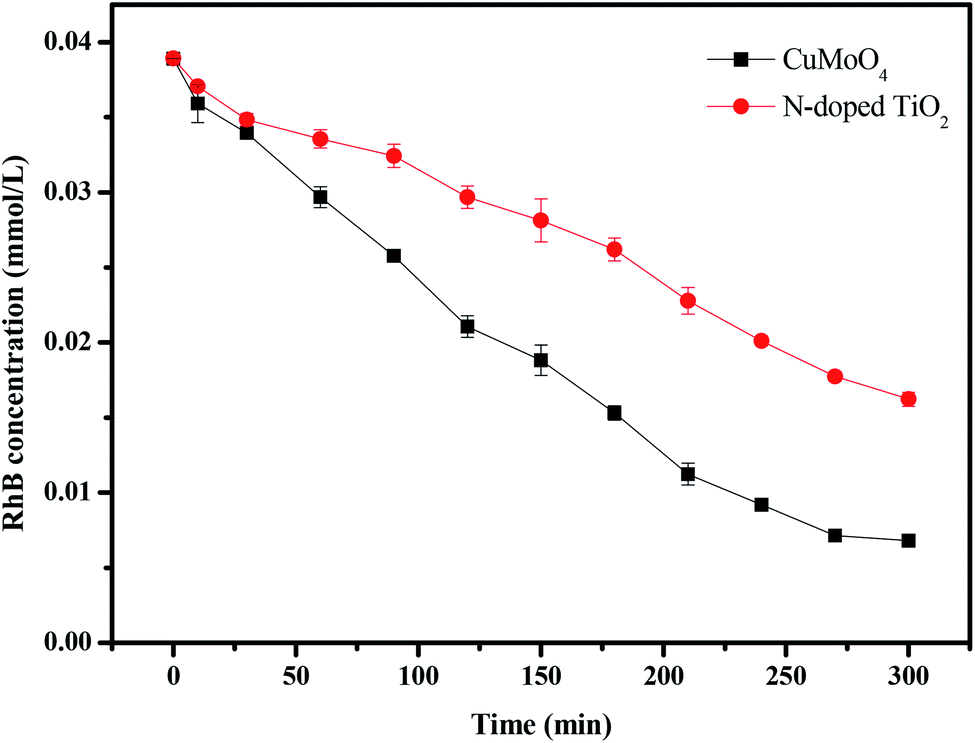
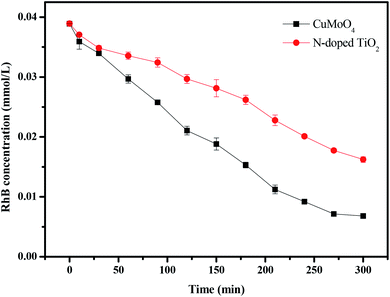
For further comparison, Fig. 18 and 19 depict the concentration of rhodamine B and the total organic carbon (TOC) concentration changes with CuMoO4 or N-doped TiO2 as photocatalyst under visible light irradiation, respectively. When N-TiO2 was utilized as a catalyst, the photodegradation rate of rhodamine B was 59.12% after visible light irradiation for 300 minutes, while the photodegradation rate of rhodamine B was 82.2% by CuMoO4. The results showed that the photodegradation rate of rhodamine B with CuMoO4 as a catalyst was higher than that with N-TiO2 as a catalyst. In addition, based on the absorbance changes of rhodamine B with light irradiation time, the kinetic curves of rhodamine B degradation under visible light irradiation were figured out (Fig. S3(a)†). The above results demonstrated that the photocatalytic kinetics of rhodamine B degradation with CuMoO4 or N-TiO2 as photocatalyst followed a first-order nature. The first-order rate constant for rhodamine B degradation was estimated to be 0.006 min−1 or 0.00285 min−1 with CuMoO4 or N-TiO2 as catalyst, respectively. This fact indicated that CuMoO4 was more efficient than N-TiO2 for the photocatalytic degradation of rhodamine B under visible light irradiation.
 |
| | Fig. 18 The photocatalytic degradation of rhodamine B under visible light irradiation with CuMoO4 and N-doped TiO2 as the photocatalyst, respectively. | |
 |
| | Fig. 19 TOC plots during the photocatalytic degradation of rhodamine B under visible light irradiation with CuMoO4 and N-doped TiO2 as the photocatalyst, respectively. | |
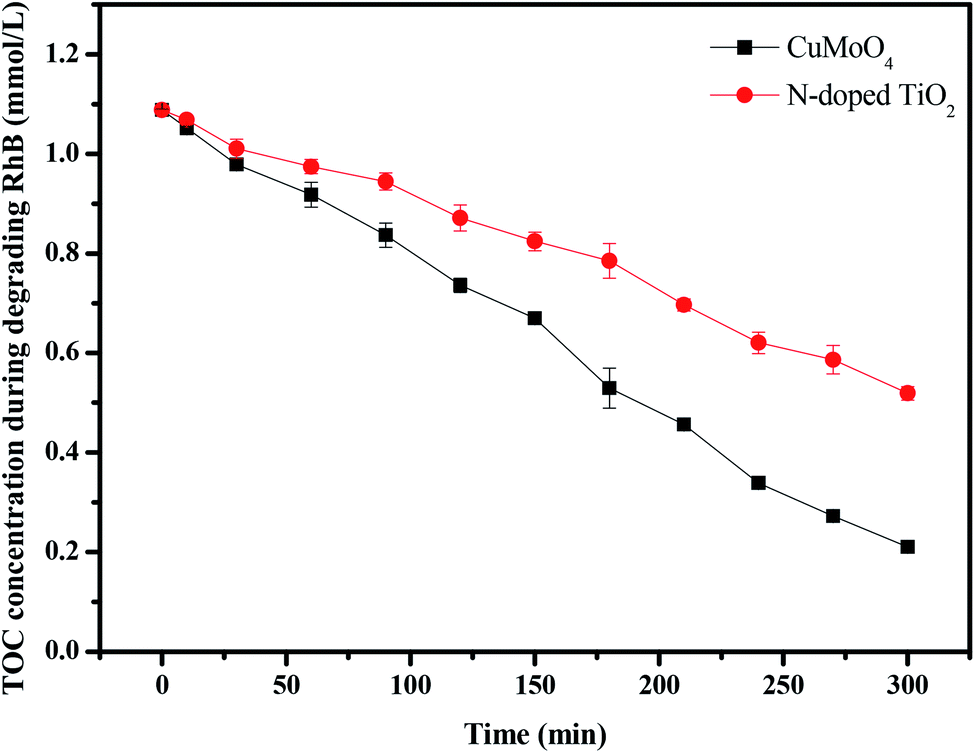
Fig. 19 shows the change in total organic carbon (TOC) during the photocatalytic degradation of rhodamine B with CuMoO4 or N-TiO2 as catalyst under visible light irradiation. The results showed that 53.21% of the TOC decrease was obtained after visible light irradiation for 300 minutes when N-TiO2 was utilized as the photocatalyst, while 81.16% of TOC decreased with CuMoO4. The apparent first-order rate constant k was estimated to be 0.00534 or 0.00245 min−1 with CuMoO4 or N-TiO2 as the photocatalyst, respectively (Fig. S3(b)†).
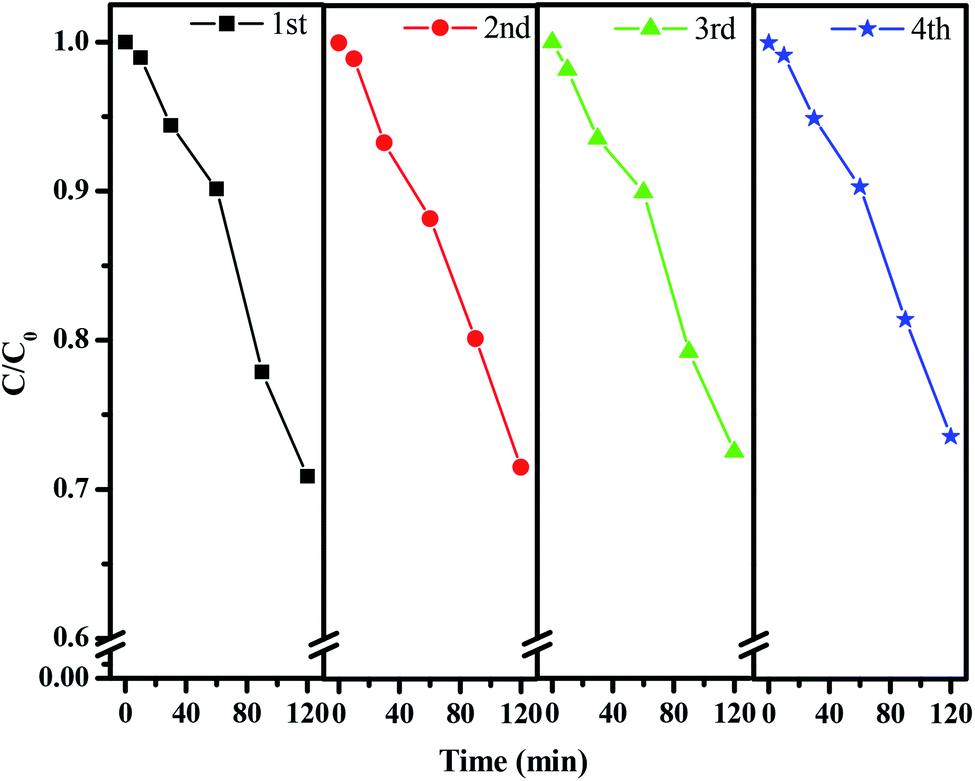
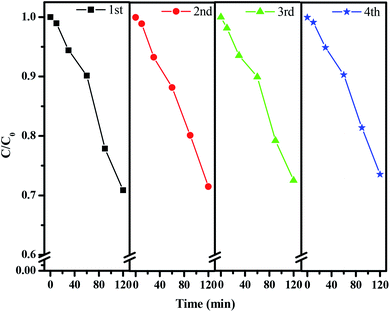
In order to probe the stability of the catalyst CuMoO4, we carried out an experiment of the repeated degradation of rhodamine B. Fig. 20 shows the experimental results of the repeated degradation of rhodamine B under the same experimental conditions after four cycles of CuMoO4 recovery. The results showed that the removal rates of rhodamine B showed little change after four reuses of CuMoO4. It could be inferred that the catalytic performance of CuMoO4 was relatively stable and repeatable.
 |
| | Fig. 20 Repeated photocatalytic degradation tests of rhodamine B with CuMoO4 as the photocatalyst. | |
For the sake of a detailed analysis of the photocatalytic degradation of rhodamine B, the chromatograms and mass spectra of degraded rhodamine B (taken after 0 min and 300 min of visible light irradiation with CuMoO4 as photocatalyst) were analyzed by LC/MS, as shown in Fig. 21 and S4.† It can be seen from the chromatogram that the retention time of rhodamine B was about 12 min. When the photocatalytic reaction proceeded, the peak intensity of rhodamine B was constantly decreasing, and it became extremely low at 300 min. The peaks of various intermediate products also appeared. The above results further indicated that rhodamine B was continuously degraded. By comparing the mass-to-charge ratio (m/z), the intermediate products which may be formed by the photocatalytic degradation of rhodamine B with CuMoO4 as photocatalyst are listed in Table 2.
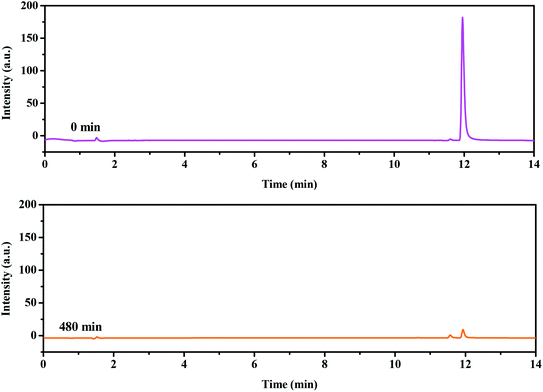 |
| | Fig. 21 Chromatograms of non-degraded (0 min) and degraded rhodamine B (300 min) during visible light irradiation with CuMoO4 as the photocatalyst. | |
Table 2 Possible intermediate products during the degradation process of rhodamine B
| Serial number |
Mass-to-charge ratio |
Intermediate product |
| I |
443.23 |
Rhodamine B |
| II |
415.20 |
N,N-Diethyl-N′-ethylrhodamine |
| III |
387.17 |
N,N-Diethyl-rhodamine |
| IV |
387.17 |
N-Ethyl-N′-ethylrhodamine |
| V |
359.14 |
N-Ethylrhodamine |
| VI |
289.15 |
7,9-Dihydro-2-methyl-7-methylene-10-phenylanthracene |
| VII |
170.86 |
3-Nitro-6-methylphenol |
| VIII |
126.86 |
3-Amino-6-methylcyclohexadienol |
By comparing the mass-to-charge ratio of the intermediate products, it was found that the II–VI of Fig. S4† corresponded to one de-ethylated product, two de-ethylated products, three de-ethylated products and four de-ethylated products of rhodamine B, wherein IV was the isomer of III, which corresponded to the intermediate product that was formed after two ethyl groups were removed from rhodamine B. One structural type of rhodamine B molecule had one ethyl group which was removed from each side, and the other structural type had two ethyl groups removed from one side of rhodamine B. The above results all indicated that rhodamine B was in the process of being gradually degraded under visible light irradiation. The conjectured degradation pathway of rhodamine B is shown in Fig. 22.
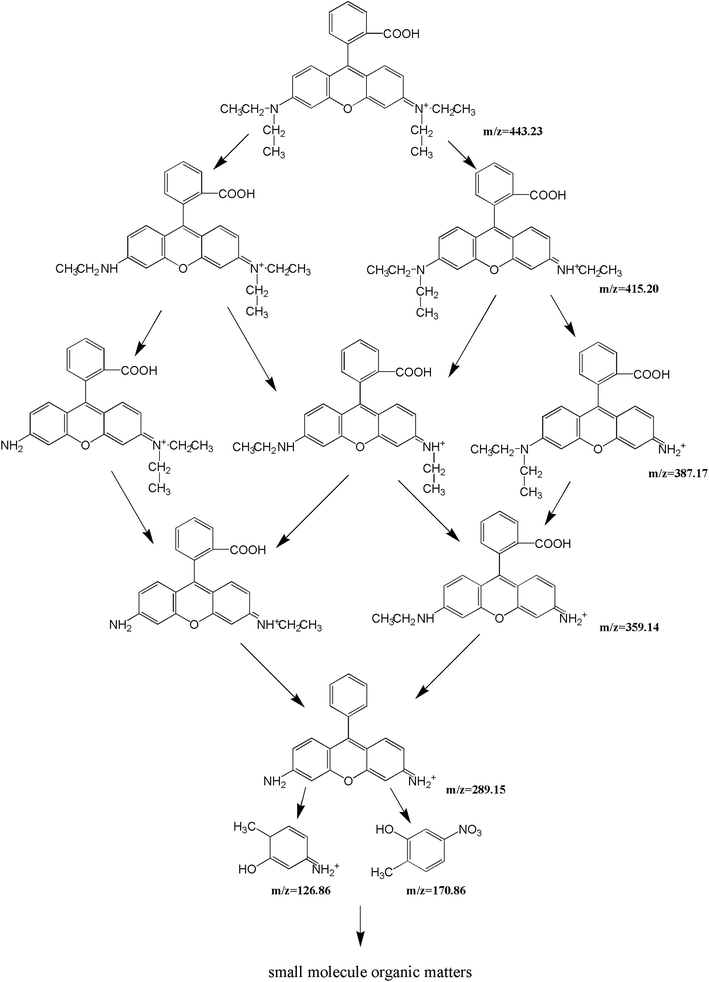 |
| | Fig. 22 A possible photodegradation pathway of rhodamine B in water. | |
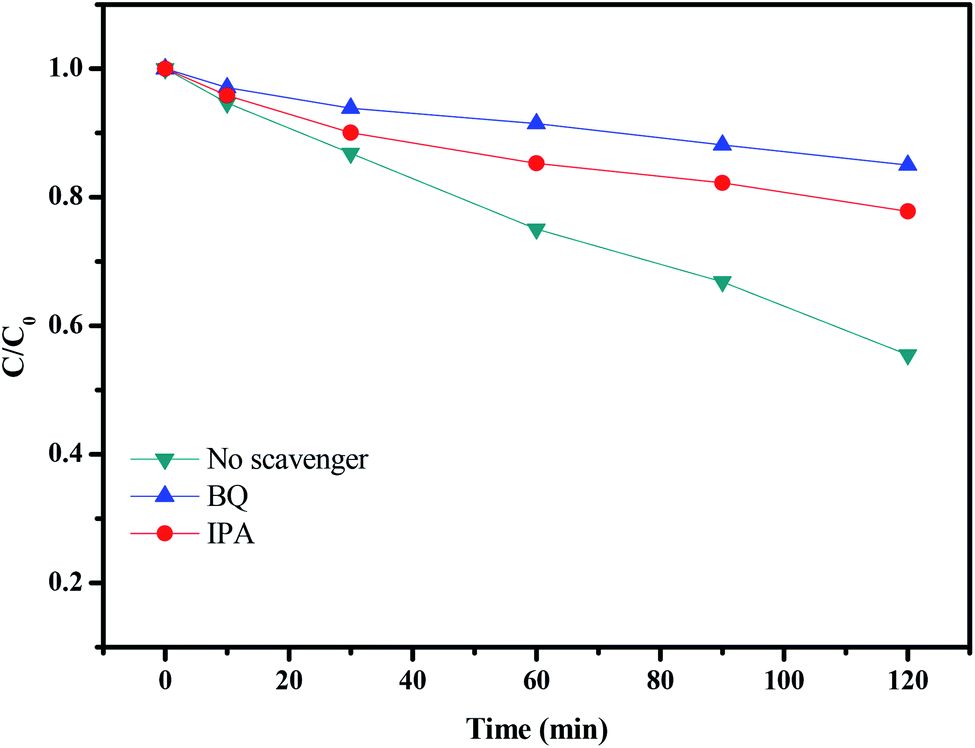
In order to verify the major reactive species inducing the degradation of rhodamine B with CuMoO4 as catalyst under visible light irradiation, dissociative scavenger experiments were carried out by adding different scavengers into the system. The photodegradation of rhodamine B over CuMoO4 in the face of various scavengers is expounded in Fig. 23. During the experiment, BQ (benzoquinone) and IPA (isopropanol) were used as scavengers for ˙O2− and ˙OH, respectively. The amount of BQ or IPA added was set to 1 mL and the concentration of BQ or IPA was set to 10 mmol L−1. As shown in Fig. 23, after the addition of BQ or IPA, the photocatalytic activity showed an obvious reduction. BQ had stronger inhibitory effect on photocatalytic activity than IPA. The above results suggested that the photoreaction process was dominated mainly by ˙O2− and ˙OH had a secondary effect on the photoreaction process. Additionally, the possible active radicals in the process of photocatalytically degrading rhodamine B were measured by the EPR characterization method, as shown in Fig. S5.† This showed a super response to ˙O2− and a certain response to ˙OH. Based on the above results, a possible mechanism for the charge separation and photocatalytic reaction for CuMoO4 was inferred:
| | |
CuMoO4 + hν → h+ + e−
| (4) |
| | |
(H2O ⇌ H+ + OH−) + h+ → H+ + ˙OH
| (6) |
| | |
Rhodamine B + ˙O2−/˙OH/h+ → intermediates → degradation products
| (7) |
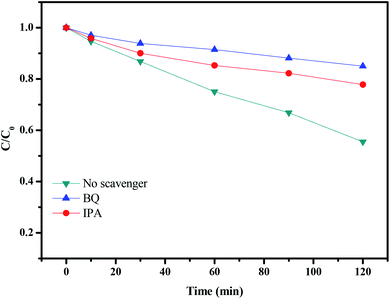 |
| | Fig. 23 The photodegradation of rhodamine B over CuMoO4 without a scavenger and in the presence of BQ and IPA. | |
In the first step, photogenerated holes (h+) and photogenerated electrons (e−) came into being on the surface of CuMoO4 particles (eqn (4)). Many published works48–50 have confirmed that two oxidative agents could mainly be concerned under visible light irradiation: ˙O2− radicals and ˙OH radicals. Subsequently, photogenerated electrons and photogenerated holes reacted with water and dissolved oxygen to form ˙O2− radicals and ˙OH radicals (eqn (5) and (6)). Then the free radicals in the solution reacted with rhodamine B to form intermediate products, which were eventually degraded into small molecular substances (eqn (7)). In the photocatalytic process, ˙O2− was the dominant active radical.
4 Conclusions
In summary, the synthetic route of CuMoO4 was systematically studied. When copper chloride and ammonium molybdate were utilized as raw materials, the obtained product changed with variations in temperature. When the hydrothermal temperature was lower than 150 °C, the obtained product was Cu3Mo2O9. When the hydrothermal temperature was above 180 °C, CuMoO4 was obtained. The reason for the above results was that copper chloride and ammonium molybdate reacted during the hydrothermal process at a hydrothermal temperature below 150 °C to form a precursor, Cu3(MoO4)2(OH)2, which was dehydrated to become Cu3Mo2O9 by calcination at 500 °C. Copper chloride and ammonium molybdate reacted at 180 °C or higher to form Cu3(MoO4)2(OH)2 and NH3(MoO3)3, which were chemically mixed after calcination at 500 °C to form CuMoO4. The reaction path was obtained by comprehensive thermal analysis. The XPS results for CuMoO4 indicated that the chemical valence values of Cu, Mo and O were +2, +6 and −2. The band gap of CuMoO4 was measured as 1.97 eV using a UV-visible diffuse reflectance spectrometer. The degradation of rhodamine B with CuMoO4 as catalyst under different synthesis conditions was investigated. Under different synthesis conditions, the hydrothermal time for the optimal degradation efficiency was 10 h, and the hydrothermal temperature for the optimal degradation efficiency was 180 °C. In experiments degrading rhodamine B and 1H-benzotriazole with CuMoO4, CuMoO4 had a higher degradation efficiency for 1H-benzotriazole. The photocatalytic decomposition of rhodamine B aqueous solution was realized under visible light irradiation in the presence of CuMoO4 or N-doped TiO2. The results showed that CuMoO4 had higher photocatalytic activity than N-doped TiO2 for degrading rhodamine B under visible light irradiation. CuMoO4 could degrade deep-red rhodamine B solution into a nearly colorless solution after 300 minutes under visible light irradiation, demonstrating that CuMoO4 showed high degradation activity. CuMoO4 showed strong potential application prospects in the field of photocatalysis.
Author contributions
Jingfei Luan was involved with all aspects of the work, including visualizing, planning and data explication. Wencheng Tan carried out the experiments, analyzed the data and wrote the paper. All authors read and approved the manuscript.
Conflicts of interest
The authors declare no conflicts of interest.
Acknowledgements
This study was supported by a grant from the Research Foundation of Innovative Research and Supporting Program of Changchun Normal University in 2019, a grant from the Research Foundation of Science and Technology Bureau of Jilin Province for Middleaged Technological Innovative Scientist and Team Based on Environmental Function Material and Water Pollution Control, a grant from China–Israel Joint Research Program in Water Technology and Renewable Energy (Grant No. [2010]30), and the National Natural Science Foundation of China (No. 20877040).
References
- B. I. Kharisov, H. V. R. Dias and O. V. Kharissova, et al., Cheminform, 2012, 2, 9325–9358 CAS.
- L. Cui, J. Wu and H. Ju, Biosens. Bioelectron., 2015, 63, 276–286 CrossRef CAS PubMed.
- X. Tan, Bioresour. Technol., 2016, 212, 318–333 CrossRef CAS PubMed.
- X. Gan, H. Zhao and X. Quan, Biosens. Bioelectron., 2017, 89, 56–71 CrossRef CAS PubMed.
- S. G. Ullattil, S. B. Narendranath and S. C. Pillai, et al., Chem. Eng. J., 2018, 343, 708–736 CrossRef CAS.
- S. M. Pourmortazavi, S. S. Hajimirsadeghi, M. Rahimi-Nasrabadi and M. M. Zahedi, Mater. Sci. Semicond. Process., 2013, 16, 131–137 CrossRef CAS.
- S. M. Pourmortazavi, S. S. Hajimirsadeghi, M. Rahimi-Nasrabadi and I. Kohsari, Synth. React. Inorg., Met.-Org., Nano-Met. Chem., 2012, 42, 746–751 CrossRef CAS.
- S. M. Pourmortazavi, S. S. Hajimirsadeghi, M. Rahimi-Nasrabadi and I. Kohsari, Chem. Eng. Commun., 2011, 198, 1182–1188 CrossRef CAS.
- R. Sundaram and K. S. Nagaraja, Sens. Actuators, B, 2004, 101, 353 CrossRef CAS.
- J. L. Brito, A. L. Barbosa, A. Albornoz and F. Severino, Catal. Lett., 1994, 26, 329 CrossRef CAS.
- J. H. Ryu, J. W. Yoon, C. S. Lim and K. B. Shim, Key Eng. Mater., 2006, 317, 223 Search PubMed.
- J. P. Liu, X. T. Huang, Y. Y. Li and Z. K. J. Li, J. Mater. Chem., 2007, 17, 2754 RSC.
- L. A. Palacio, A. Echavarría, L. Sierra and E. A. Lombardo, Catal. Today, 2005, 107–108, 338 CrossRef CAS.
- J. H. Ryu, S. M. Koo, J. W. Yoon, C. S. Lim and K. B. Shim, Mater. Lett., 2006, 60, 1702 CrossRef CAS.
- J. S. Xu and D. F. Xue, J. Solid State Chem., 2007, 180, 119–126 CrossRef CAS.
- M. Najafi, A. Abbasi, M. Masteri-Farahani and V. H. Nunes Rodrigues, Inorg. Chim. Acta, 2015, 433, 21 CrossRef CAS.
- E. Sajo, P. Bakos and M. Szilagyi, et al., Inorg. Chem., 2018, 57, 13679–13692 CrossRef PubMed.
- M. A. Hasan, M. I. Zaki, K. Kumari and L. Pasupulety, Thermochim. Acta, 1998, 320, 23–32 CrossRef CAS.
- G. Mul, J. P. A. Neeft, F. Kapteijn, M. Makkee and J. A. Moulijn, Appl. Catal., B, 1995, 6, 339–352 CrossRef CAS.
- C. H. Wang and H. S. Wenig, Appl. Catal., A, 1998, 170, 73–80 CrossRef CAS.
- J. Haber, T. Machej, L. Ungier and J. Ziolkowski, J. Solid State Chem., 1978, 25, 207–218 CrossRef CAS.
- G. Steiner, R. Salzer and W. Reichelt, Fresenius. J. Anal. Chem., 2001, 370, 731–734 CrossRef CAS PubMed.
- A. F. Gouveia, J. C. Sczancoski, M. M. Ferrer, A. S. Lima, M. R. M. C. Santos, M. S. Li, R. S. Santos, E. Longo and L. S. Cavalcante, Inorg. Chem., 2014, 53, 5589 CrossRef CAS PubMed.
- Z. Xu, Z. Li, X. Tan, C. M. B. Holt, L. Zhang, B. S. Amirkhiz and D. Mitlin, RSC Adv., 2012, 2, 2753 RSC.
- W. S. Wang, L. Zhen, C. Y. Xu, W. Z. Shao and Z. L. Chen, CrystEngComm, 2013, 15, 8014 RSC.
- M. R. D. Bomio, R. L. Tranquilin, F. V. Motta, C. A. Paskocimas, R. M. Nascimento, L. Gracia, J. Andres and E. Longo, J. Phys. Chem. C, 2013, 117, 21382 CrossRef CAS.
- C. T. Cherian, M. V. Reddy, S. C. Haur and B. V. R. Chowdari, ACS Appl. Mater. Interfaces, 2013, 5, 918 CrossRef CAS PubMed.
- Y. M. Sun, X. L. Hu, W. Luo and Y. H. Huang, J. Mater. Chem., 2011, 21, 17229 RSC.
- D. D. Cai, L. X. Ding, S. Q. Wang, Z. Li, M. Zhu and H. H. Wang, Electrochim. Acta, 2014, 139, 96 CrossRef CAS.
- D. Li, Q. Qin, X. C. Duan, J. Q. Yang, W. Guo and W. J. Zheng, ACS Appl. Mater. Interfaces, 2013, 5, 9095 CrossRef CAS PubMed.
- Y. Benshahar and U. Banin, Top. Curr. Chem., 2016, 374, 149–174 Search PubMed.
- M. Ahmad, E. Ahmed and Y. W. Zhang, et al., Curr. Appl. Phys., 2013, 13, 697–704 CrossRef.
- L. Debbichi, M. C. Marco de Lucas, J. F. Pierson and P. Krüger, J. Phys. Chem. C, 2012, 116, 10232–10237 CrossRef CAS.
- G. Kliche and Z. V. Popovic, Phys. Rev. B: Condens. Matter Mater. Phys., 1990, 42, 10060–10066 CrossRef CAS PubMed.
- R. Nakajima, M. Abe, Y. Benino, T. Fujiwara, H. G. Kim and T. Komatsu, J. Non-Cryst. Solids, 2007, 353, 85–93 CrossRef CAS.
- M. Maczka, J. Solid State Chem., 1997, 129, 287–297 CrossRef CAS.
- L. Seguin, M. Figlarz, R. Cavagnat and J. C. Lassegues, Spectrochim. Acta, Part A, 1995, 51, 1323–1344 CrossRef.
- C. E. Ciocan, E. Dumitriu, T. Cacciaguerra, F. Fajula and V. Hulea, Catal. Today, 2012, 198, 239–245 CrossRef CAS.
- C. Barraclough, G. J. Lewis and R. S. Nyholm, J. Chem. Soc., 1959, 3552–3555 RSC.
- Y. Yao, F. Lu, Y. Zhu, F. Wei, X. Liu, C. Lian and S. Wang, J. Hazard. Mater., 2015, 297, 224–233 CrossRef CAS PubMed.
- J. Tauc, R. Grigorovici and A. Vancu, Phys. Status Solidi, 1966, 15, 627–637 CrossRef CAS.
- M. Benchikhi and R. E. Ouatib, et al., Int. J. Miner., Metall. Mater., 2016, 23, 1340–1345 CrossRef CAS.
- Z. Zhao, H. Wu, H. He, X. Xu and Y. Jin, Adv. Funct. Mater., 2014, 24, 4698–4705 CrossRef CAS.
- C. Xu, Y. Zhang, J. Chen, J. Lin, X. Zhang, Z. Wang and J. Zhou, Appl. Catal., B, 2017, 204, 324–334 CrossRef CAS.
- K. Yang, W. Q. Huang, L. Xu, K. W. Luo, Y. C. Yang and G. F. Huang, Mater. Sci. Semicond. Process., 2016, 41, 200–208 CrossRef CAS.
- Y. J. Yang and J. F. Luan, Molecules, 2012, 17, 2752–2772 CrossRef CAS PubMed.
- M. J. Chang, H. Wang and H. L. Li, et al., J. Mater. Sci., 2018, 53, 3682–3691 CrossRef CAS.
- S. Q. Huang, Y. G. Xu and M. Xie, et al., Colloids Surf., A, 2015, 478, 71–80 CrossRef CAS.
- B. Subash, B. Krishnakumar and M. Swaminathan, et al., Langmuir, 2013, 29, 939–949 CrossRef CAS PubMed.
- H. Q. Sun, G. L. Zhou and S. Z. Liu, et al., Chem. Eng. J., 2013, 231(9), 18–25 CrossRef CAS.
Footnote |
| † Electronic supplementary information (ESI) available. See DOI: 10.1039/d0ra00496k |
|
| This journal is © The Royal Society of Chemistry 2020 |
Click here to see how this site uses Cookies. View our privacy policy here. 
 Open Access Article
 This Open Access Article is licensed under a Creative Commons Attribution-Non Commercial 3.0 Unported Licence
 *ab
*ab