
 Open Access Article
 This Open Access Article is licensed under a Creative Commons Attribution-Non Commercial 3.0 Unported Licence
Giant pressure sensitivity in piezo/ferro-electric ceramics
Vikas N. Thakur ab,
Bhanu P. Singhab,
Sanjay Yadavab and
Ashok Kumar*ab
ab,
Bhanu P. Singhab,
Sanjay Yadavab and
Ashok Kumar*ab
aCSIR-National Physical Laboratory, Dr K. S. Krishnan Marg, New Delhi 110012, India. E-mail: ashok553@nplindia.org
bAcademy of Scientific and Innovative Research (AcSIR), CSIR-National Physical Laboratory (CSIR-NPL) Campus, Dr K. S. Krishnan Road, New Delhi 110012, India
First published on 3rd March 2020
Abstract
We report the fabrication of single-phase polycrystalline Pb0.85Bi0.10(Zr0.52Ti0.48)O3 (PBiZT) ceramic which shows large polarization, i.e., ∼40 μC cm−2 and piezoelectric coefficients ∼130 pC N−1 and giant linear change in capacitive reactance and dielectric properties with increasing and decreasing pressure in the range of 1 kHz to 5 MHz. Nearly 70% change in dielectric constant and 56% change in capacitive reactance were obtained in the pressure range of 20–200 MPa, which makes it suitable for applications as a capacitive pressure sensor/gauge. The sensitivity of the device is calculated as 0.66 MPa−1 and 18.2 MPa−1 at 1 MHz and 5 MHz, respectively, which is the highest ever reported value so far for any bulk polycrystalline ceramic. The compressive stress of the device was tested according to the standard test method as a function of linear and volumetric strain, which yields the Young's modulus, Bulk modulus, and Poisson's ratio of the device. These values were further utilized to calculate actual stress in the sample and energy density using ANSYS software, which indicates at least four orders smaller pressure in the sample compared to the applied pressure.
Introduction
It is well known that all the ferroelectric materials are piezoelectrics, and hence external pressure deforms the dimensions of these systems, which yields suitable pressure transducers depending on their sensing ability. Among all the ferroelectric materials, lead (Pb) based ferroelectric materials have been invented and utilized as pressure sensors due to its large sensitivity and endurance.1–7 These systems have been utilized as capacitors, transducers, actuators, and electrostatic devices, etc. for the last many decades.8–17 In the past, many authors, including our group have reported lead-based materials for suitable pressure sensors in the low and high-pressure range, where a significant change in dielectric constant, piezoelectric coefficient and capacitive reactance was observed as a function of pressure.1–3,5–7,13,18–26 However, the effect of pressure on change in dielectric constant was not as significant that it can be realized for real high-pressure sensor devices. Another drawback was the linearity in dielectric constant as a function of pressure. To overcome these shortcomings, we have been searching for novel ceramic materials that illustrate high sensitivity and linearity. To reach the goal, we have selected well known Pb(Zr0.52Ti0.48)O3 (PZT) as a parent matrix with a suitable substitution of Bi concentration.The perovskite ferroelectrics having the general formula of ABO3 with cations like Pb2+ and Bi3+ at A-site has special properties like large fatigue-free polarization, high dielectric constant, high piezoelectric coefficients, electro-optic effects, and high ferroelectric phase transition temperature (Tc), etc.27–32 These properties make PZT potential materials for pressure sensor devices. The substitution of Bi3+ at Pb2+ site within their solubility limit makes it further potential candidates for pressure sensors. Since both bismuth and lead have similar ionic radii and also having a lone pair so they can substitute each other and maintain charge neutrality within their solubility limit. The substitution of Bi at Pb site leads to a significant change in piezoelectric coefficients, which further improve the electromechanical coupling coefficient. Recently we have reported a bismuth-doped PZT and ZrO2 ceramic composite, which is ferroelectric as well as pressure-sensitive in nature,26 however it shows low sensitivity and non-linear capacitance as a function of pressure.
In this manuscript, we report single-phase Bi-substituted PZT within their solubility limit, which shows giant pressure sensitivity and linearity (99.95%) in dielectric constant and capacitive reactance over a high-pressure range for 20 MPa to 200 MPa. We also performed the ANSYS simulation of real experimental data that the actual stresses on the samples are nearly four orders lower than the applied pressure in the pressure cell.
Experimental details
The high purity precursors PbO, Bi2O3, ZrO2 and TiO2 from Alfa Aesser (99.9%) have utilized to prepare the charge neutrality and compositional stoichiometry of Pb1−xBi2x/3(Zr0.52Ti0.48)O3 (PBiZT for x = 0.15) using solid-state reaction method. The green powder was further mixed and grinded in pestle mortar in liquid medium (isopropyl alcohol (IPA)) for 2 hours. The mixed powder was calcined at 900 °C for 9 hours. After calcination, the light yellowish powder was reground and remixed with polyvinyl alcohol and then the pressure of ∼70 MPa to make the pellets of ∼10 mm diameter and ∼1 mm thickness. These pellets were sintered at 1200 °C for 4 hours in the air to achieve the 95–97% of theoretical density.33 The X-ray diffraction (XRD) patterns were taken using CuKα (λKα = 1.5405 Å) monochromatic radiation in the 2θ range of 20° to 60° to obtain the crystal structure, space group, phase purity, and lattice constant. The surface morphology, grain size, and elemental composition were obtained using scanning electron microscopic (SEM) using the instrument Zeiss EVOMA-10. The metal–ferroelectric–metal structure with both side silver electrodes was used to carry out electrical and pressure-dependent dielectric and capacitive reactance properties using LCR meter (HIOKI-3532-50). The choice of electrodes for making the capacitor is very important for the transport and ferroelectric properties with Schottky interface.34–36 Radiant ferroelectric tester was used to measure the polarization at room temperature at various frequencies from 1 to 10 Hz. To test the pressure sensitivity of the material, piezoelectric coefficient (d33) was measured using Piezometer System (model no. PM300) at 110 Hz with the dynamic force of 0.25 N. The pressure-dependent properties were measured by LCR meter in the pressure range of 20–200 MPa for various frequencies from 1 kHz to 5 MHz using a homemade pressure cell (shown in Fig. 1). The experimental setup used to measure pressure-dependent dielectric and capacitive reactance properties is shown in Fig. 1. The sample is kept in the pressure cell. The electrodes of the sample are connected to the high voltage (H) and low voltage (L) of the LCR meter using the coaxial cables which are taken out of the pressure cell using electrical feed through. Hydraulic pressure was applied to the sample with the help of a hydraulic pressure pump using sebacate oil (kept in oil tank). The applied pressure was measured by a pressure gauge and after completing the measurement the data was stored in the computer for further process.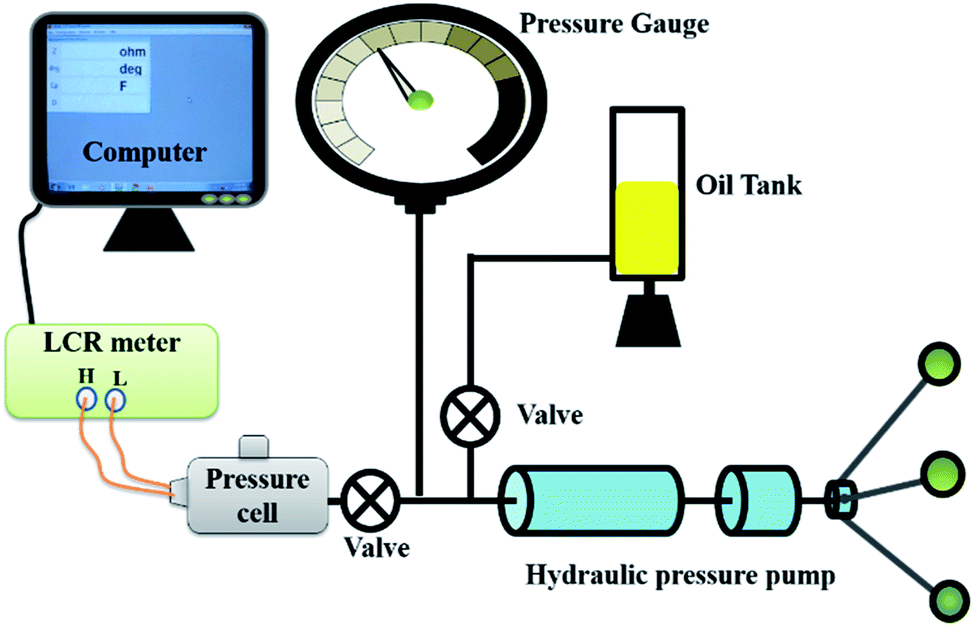 | ||
| Fig. 1 Schematic diagram of the experimental setup for the measurement of the pressure dependent dielectric properties. | ||
Results & discussion
Microstructural and electrical analysis
Fig. 2 describes the Rietveld refined XRD patterns of PBiZT from 20° to 60° Braggs angle with the fitted parameter χ2 = 2.55. The Bragg peaks were indexed, which were matched with the JCPDS file no. 33-0784. The Rietveld refined XRD patterns confirm that PBiZT has a tetragonal crystal structure with a space group of P4mm. It was observed that there is a small peak of impure phase near Bragg's angle 28.4°, which identified as PbBiTi6O21 alloys confirmed by JCPDS no. 35-0007. It is well known that both lead (Pb) and bismuth (Bi) are volatile in nature which leads to the formation of a small amount of pyrochlore (impurity phase) in the matrix. It is very difficult to optimize only single-phase matrix without any impurity phase. The amount of impurity phase is negligible (1–2%) considering the polycrystalline nature of PBiZT, which hardly affects the physical properties. The SEM image (Fig. 3(a)) clearly illustrates single-phase diamond-like grains attached with grain boundaries without any voids. These images also demonstrate that grains are uniformly distributed in the matrix with coalesces of grains near grain boundaries, which signify a high-quality microstructure. The ferroelectric nature of PBiZT is shown in the Fig. 3(b), in which polarization is measured with the varying electric field in the range of frequency of 1–10 Hz. It can be seen that polarization is well saturated, square-like, and its magnitude is high, i.e. 40–50 μC cm−2.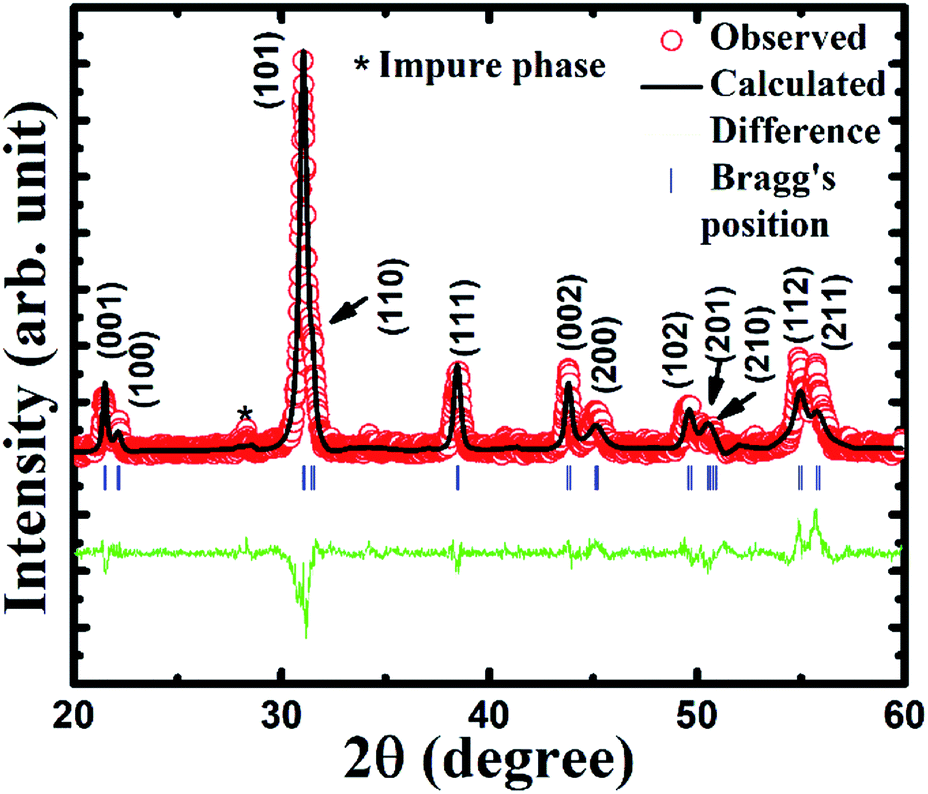 | ||
| Fig. 2 XRD patterns with Rietveld refinement analysis of PBiZT. | ||
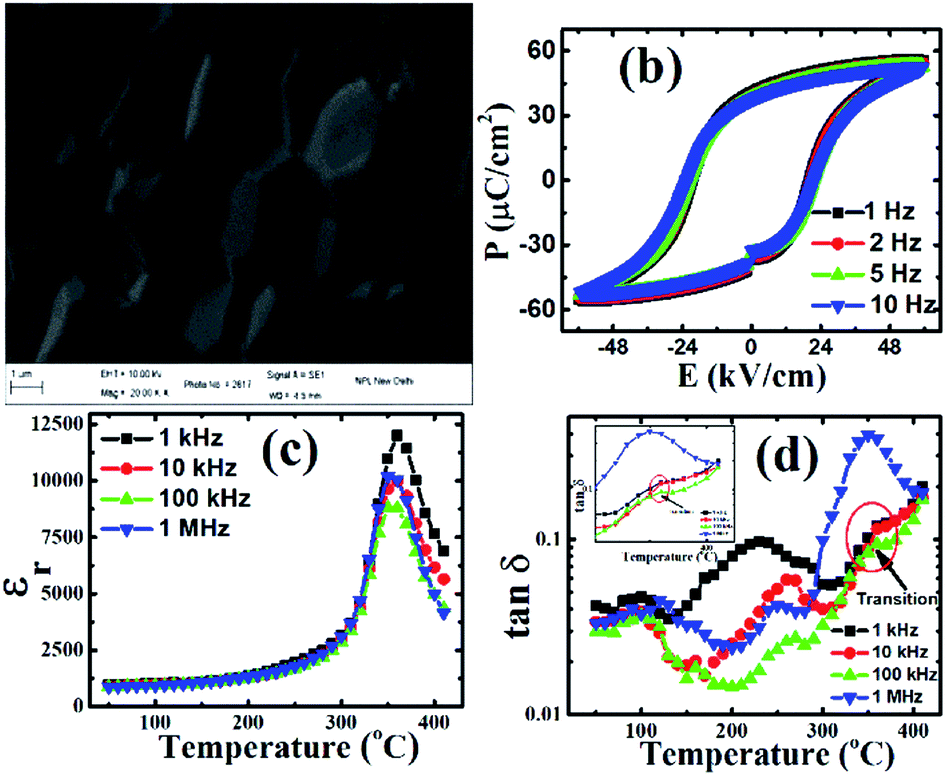 | ||
Fig. 3 (a) SEM image of PBiZT (b) polarization (P) versus electric field (E), (c) dielectric constant (εr) a function of temperature and (d) tan![[thin space (1/6-em)]](https://www.rsc.org/images/entities/char_2009.gif) δ with varying temperature of PBiZT. δ with varying temperature of PBiZT. | ||
The temperature-dependent dielectric constants were measured using LCR meter from 1 kHz to 1 MHz starting from room temperature (25 °C), as shown in Fig. 3(c). The curie temperature of PBiZT is found approximately at 355 °C (±10 °C). There was a negligible change in dielectric constant (εr) below 100 °C, which suggests that the pressure sensor has a negligible effect of temperature. Therefore it can be used as a pressure sensor up to 100 °C. The tangent loss (tanδ) was also obtained in a wide range of frequency from 1 kHz to 1 MHz with varying temperatures (shown in Fig. 3(d)). The inset of the Fig. 3(d) shows the zoom-in of the transition point for the frequencies from 1–100 kHz. The tanδ gives the ratio of the imaginary part of dielectric constant to the real part of dielectric constant, in the present case, it is nearly 4%, which suggests the quality factor of physical parameters are quite high. In other words, up to 100 °C, the material shows more than 96% real behavior.
Pressure dependent properties
To see the pressure-sensitive nature of the material, d33 was calculated, and the value obtained is 130 pC N−1, which is a significant value considering the polycrystalline nature of PBiZT. The dielectric constant was measured at room temperature with varying pressure from 20–200 MPa in the wide range of frequency of 1 kHz to 5 MHz using the experimental setup shown in Fig. 1. The variation of the dielectric constant of PBiZT with pressure and probe frequencies is shown in Fig. 4. The effect of pressure is noteworthy; it increases with an increase in pressure. However, the effect was significant for high probe frequency (1 MHz to 5 MHz) due to electro-mechanical coupling and resonance in the frequency range.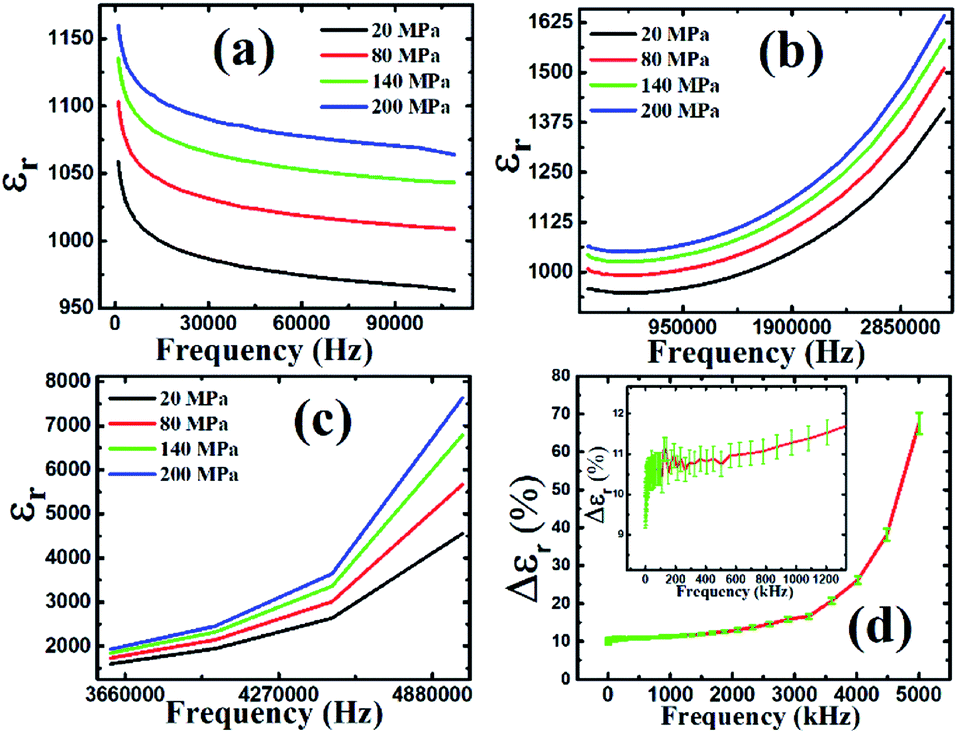 | ||
| Fig. 4 Variation of dielectric constant as function of frequency (f); (a) (1 kHz < f < 110 kHz), (b) (110 kHz < f < 3.2 MHz), and (c) (3.2 MHz < f < 5 MHz) at various pressure (20 to 200 MPa) (d) percentage change in dielectric constant (Δεr) at 200 MPa with respect to 20 MPa at various frequencies. | ||
Fig. 4(a) shows the magnitude of the εr decreases with an increase in probe frequency from 1–15 kHz which may be due to strong contribution of mobile charge carriers in the low-frequency range, however, it is nearly constant above 15 kHz up to 110 kHz due to negligible effect of mobile charge carriers. From Fig. 4(b), we observed that dielectric constant starts increasing with frequency from 120 kHz to 3.2 MHz because of large electromechanical coupling and system resonance condition towards probe frequency. Due to measurement limitations, we could not achieve the resonance frequency. As shown in Fig. 4(c), the magnitude of dielectric constant is increasing with frequency; however, the change in dielectric constant is large with applied pressure (large spacing). Fig. 4(d) shows the change in dielectric constant at 200 MPa concerning 20 MPa with varying frequency (1 kHz to 5 MHz). The % change in εr is given by eqn (1a). It is clear from Fig. 4(d) that the change in εr is almost constant at a lower frequency, however, after 1 MHz it started increasing slowly, and at 5 MHz a giant change in dielectric constant is observed, i.e., ∼70%.
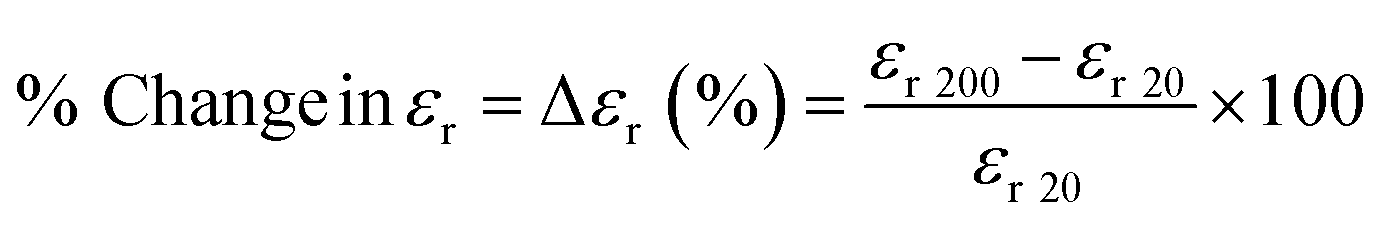 | (1a) |
There are very few reports related to hydraulic pressure sensors in the range of 20–200 MPa. The sensitivity of PBiZT ceramic is in the same range as reported earlier in the ref. 11 and 12. The repeatability is the standard deviation of the values of the change in dielectric constant (Δεr). The experiment was performed many times to ensure the real behavior of the device as a function of pressure. The standard deviation among all the Δεr values obtained for any given frequency was calculated which found in the range of 10−2. The repeatability Δεr (%) for complete frequency range is shown by error bars in Fig. 4(d) (inset shows the magnified image of Δεr (%) in below 1 MHz). Note that the error bar shown in Fig. 4(d) is of the order of ≈10−2. By looking at repeatability, one can assure that the material is highly reliable and sensitive.
In place of gauge factor, we have taken the term ‘sensitivity’ as the parameter as a figure of merit of the device. In our case, the sensitivity is given by eqn (1b),
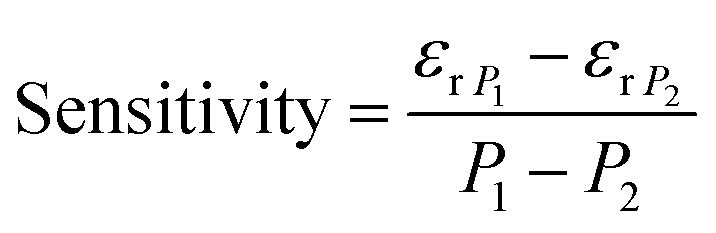 | (1b) |
Using eqn (1b), the sensitivities of the device were calculated to be 0.66 MPa−1 and 18.2 MPa−1 at 1 MHz and 5 MHz, respectively.
Based on the data of Fig. 4(d), we have chosen two frequencies, i.e. 1 MHz and 5 MHz. The change in dielectric constant as a function of pressure for lower (<1 MHz) frequency was almost the same. The high frequencies (>1 MHz and <5 MHz) are also suitable to make electronics for the digital display unit. Further, by giving special attention to these two frequencies the graphs were plotted as shown in Fig. 5 and hence the sensitivities were calculated as 0.66 MPa−1 and 18.2 MPa−1 at 1 MHz and 5 MHz, respectively.
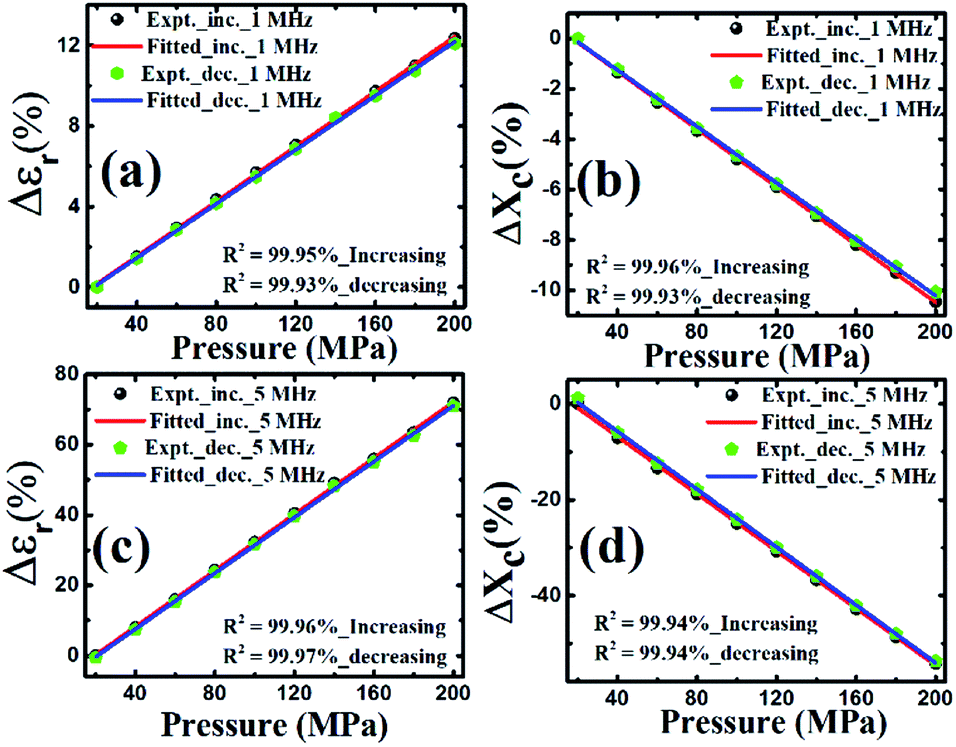 | ||
| Fig. 5 Percentage change in εr at (a) 1 MHz and (c) 5 MHz, respectively and % change in Xc at (b) 1 MHz and (d) 5 MHz, respectively with varying pressure from 20–200 MPa. | ||
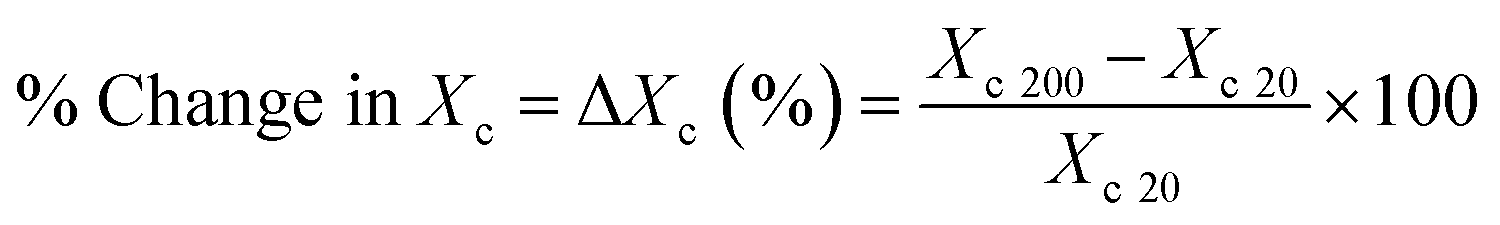
Above 1 MHz, the εr started increasing with frequency and at 5 MHz the highest frequency at which the significant change in εr was observed. These frequencies were selected due to their characteristics for the development of microelectronics and sensor display unit. We have also obtained the values of dielectric constant as well as the capacitive reactance (Xc) while increasing and decreasing the pressure in the range of 20–200 MPa at 1 MHz and 5 MHz. The Xc is the imaginary part of the impedance (Z) of the material which is a complex quantity, given by eqn (2a),
| Z = R − jXc | (2a) |
 , R is the resistance and given by eqn (2b),
|
R = Zcosθ
| (2b) |
Similarly, Xc can be given by eqn (2c),
|
Xc = Zsinθ
| (2c) |
The % change in Xc (given by eqn (2d)) and εr are calculated and drawn with varying pressure from 20–200 MPa, as shown in Fig. 5.
% Change in Xc is given by eqn (2d)
 | (2d) |
The capacitive reactance data at 5 MHz will be used to make the electronics for the digital display unit.
Strength analysis
The design of the pressure cell does not allow to check the real stress on the sample and pressure sensing limit during pressure-dependent dielectric and capacitive measurement. Therefore, to understand the material properties, a separate stress–strain study has been carried out using the Instron universal testing machine model: 5967 as per defined test procedure for ceramics in ASTM C1424-15.37 Cylindrical shaped real sample of PBiZT ceramic is shown in Fig. 6(a) having the diameter = 8.6 mm and height = 14.56 mm. But the effective diameter of the sample was calculated to be 5.6 mm because after loading the sample in the spacer (shown in Fig. 6(b)) to measure the compressive strength of the material, below the elastic limit of sample, starts breaking partially from edges and left with nearly half the surface area under load cell (as shown by Fig. 6(c)). Finally, the material/sample was completely crushed as can be seen in Fig. 6(d); the crushing point of the sample gives compressive strength (398 MPa).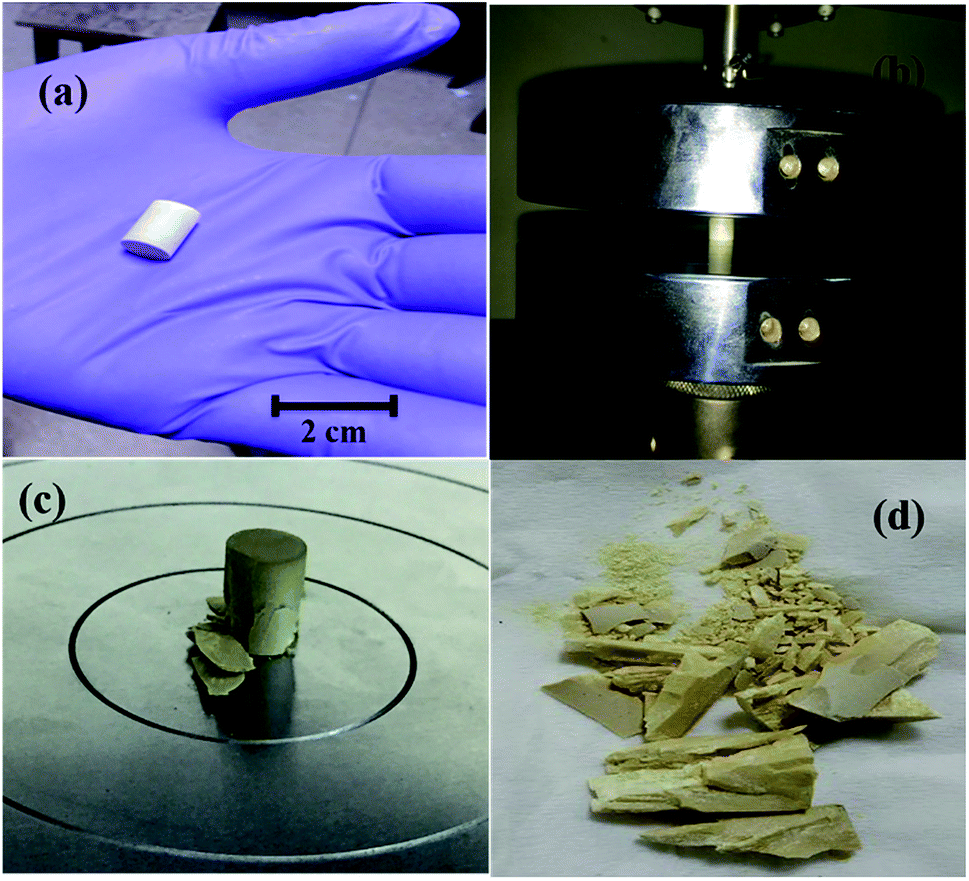 | ||
| Fig. 6 (a) Real sample (as used) (b) kept in the spacer of the instrument i.e. Instron universal testing machine model: 5967, (c) below the elastic limit, the sample started breaking near one surface and (d) completely broken structure after crossing the compressive strength of the sample. | ||
After the measurement, the compressive stress is plotted with linear strain and volumetric strain, as shown in Fig. 7(a) and (b), respectively. Up to a point A, the load is not enough to make the change in dimensions of the sample, then from point A to point B the stress is increasing almost linearly with the strain and follows' the Hooke's law which further used to calculate the slopes of the line AB in Fig. 7(a) and (b) which give the Young's modulus of elasticity (i.e. Y = 10.3 GPa) and Bulk modulus of elasticity (i.e. B = 3.4 GPa), respectively and then using the relation between Y, B and σ (Poisson's ratio) i.e. Y = 3B(1 − 2σ), sigma is calculated as 0.01. These values of modulus of elasticities are a little bit lower than the previously reported values.38 In the work of ref. 34, the experiment was performed with a little bit different specimen whereas we have used the dimensions according to ASTM C1424-15 guidelines.
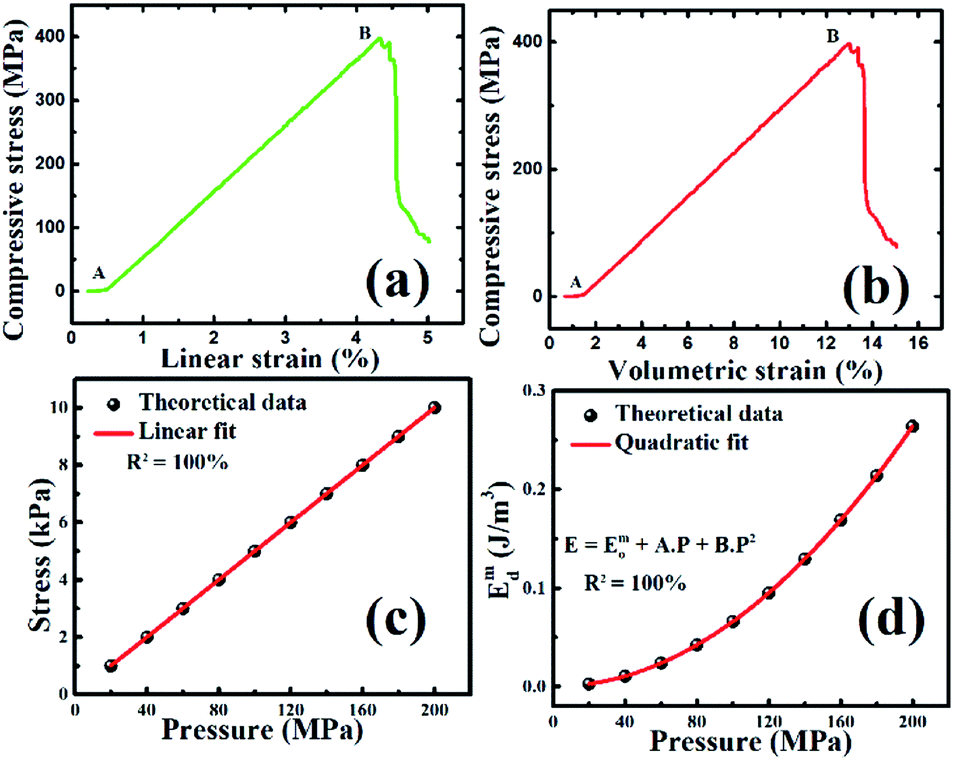 | ||
| Fig. 7 (a) Compressive stress versus linear strain graph of real PBiZT sample, (b) compressive stress versus volumetric strain graph (c) stress analysis using ANSYS with varying applied pressure, (d) mechanical energy density as a function of applied pressure from ANSYS. | ||
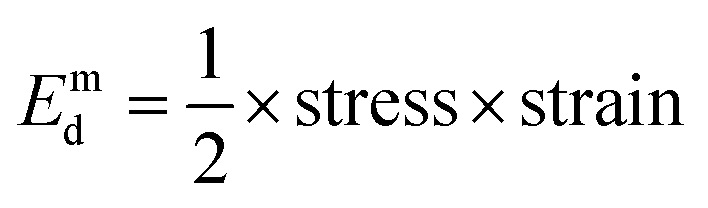
Beyond point B, the sample broke down, which means point B gives the compressive strength of the material. Hence the material can tolerate ≈398 MPa compressive stress on direct contact to the surface. The values of Y, B, and σ are used in ANSYS software to calculate the actual stress and mechanical energy density. Fig. 8(a) and (b) give the sample model, and the meshed sample was drawn in ANSYS, respectively. Further, the pressure applied in the range of 20–200 MPa in ANSYS and simulated the results in the form of stress (shown in Fig. 7(c)), strain, and deformation. Deformation distribution is shown in Fig. 8(c) throughout the sample in which the red part is most stressed, and blue is the least deformed from the original shape, which is shown in shadow form. Similarly, a simulated stressed sample is shown in Fig. 8(d), in which stress is distributed all over the sample, and red is the most stressed part, and blue is the least stressed part. ANSYS analysis indicates that the actual stress applied on the samples nearly 104 times smaller than the real hydrostatic stress/pressure applied during the measurement (as can be seen from Fig. 7(c)). Since the compressive strength of the material is measured nearly ∼4 × 10⁸ Pa (Fig. 7(a)), therefore it can be concluded from Fig. 7(a) and (c) that the material can tolerate the hydrostatic pressure of the order of ∼1012 Pa. To have an idea about the energy density observed by the device, the stress and strain obtained from ANSYS results were used to calculate mechanical energy density (Emd) using the formula given by eqn (3).
 | (3) |
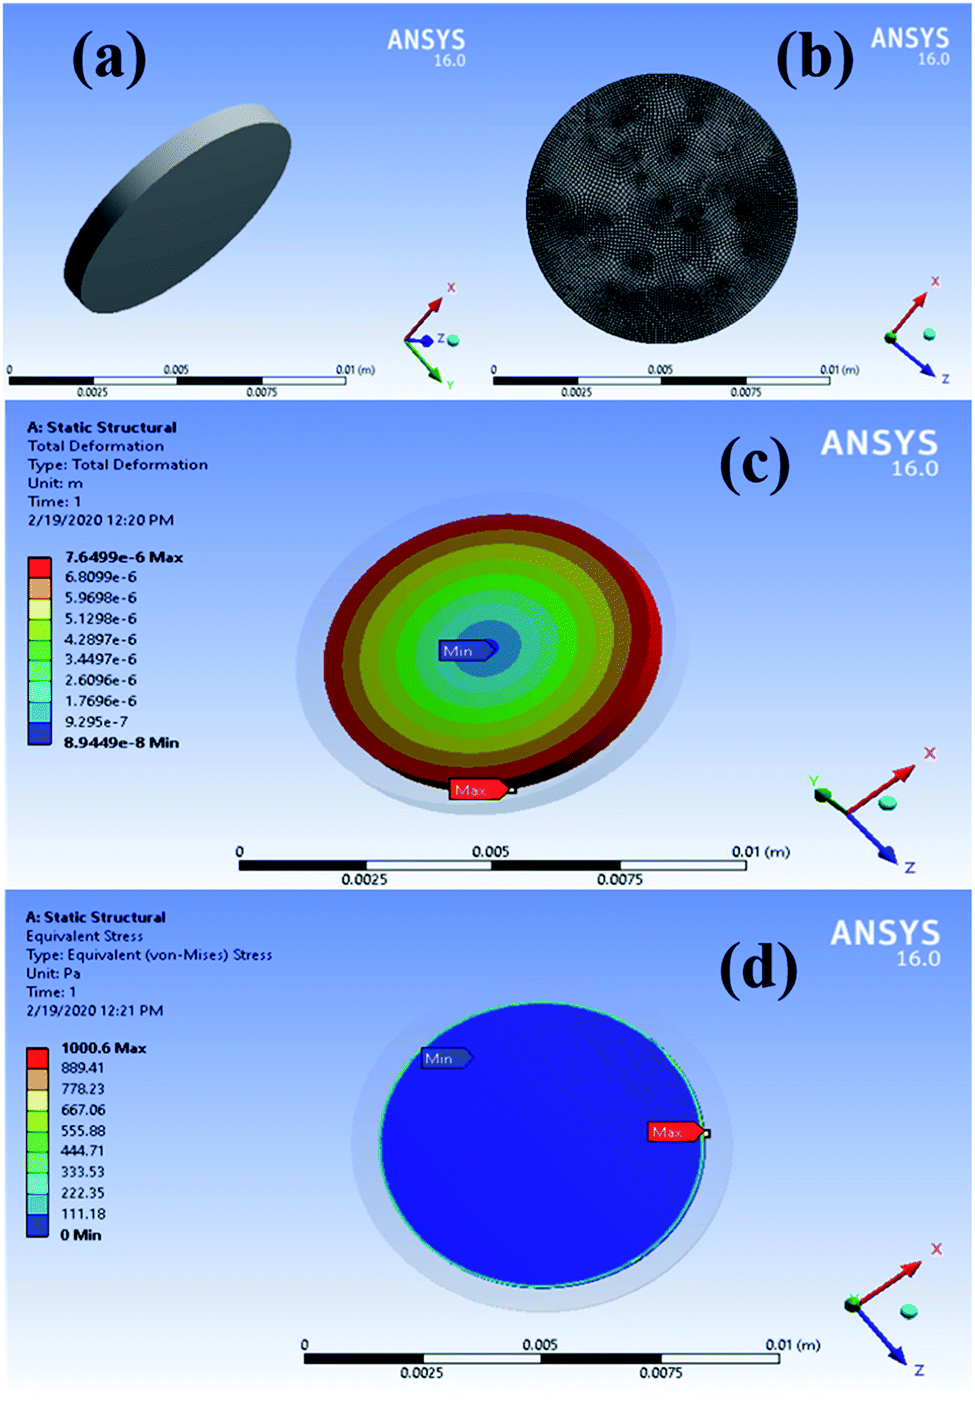 | ||
| Fig. 8 (a) Real dimension of PBiZT ceramic using for ANSYS analysis (b) mesh size all over the pellet using ANSYS, (c) maximum deformation (red) to minimum deformation (blue); shadow part represents the original size and shape of the pellet (d) stress distribution is shown from most stressed part (red) to least stressed part (blue). | ||
From Fig. 7(d), it can be seen that energy density varies non-linearly with the applied pressure (p) with the relation given by eqn (4),
| Emd = Emo + Ap + Bp2 | (4) |
The pressure-sensing device holds energy density ∼260 mJ m−3 at 200 MPa applied hydrostatic pressure, which may increase several orders since the device can sustain the pressure in the range of 1000 GPa, which is a large amount in case of polycrystalline bulk ceramics.
Conclusion
Nearly single-phase PBiZT shows a giant change in capacitive reactance and dielectric constant under large hydrostatic pressure, which makes it a suitable candidate for high-pressure sensing devices. The almost temperature-independent dielectric constant is obtained below 100 °C which supports its suitability for pressure sensor applications. As per our knowledge, there is no report of 70% change in dielectric constant and 56% change in capacitive reactance in the high-pressure range from 20 MPa to 200 MPa. It demonstrates large sensitivity in dielectric constant, i.e., 0.66 MPa−1 and 18.2 MPa−1 at 1 MHz and 5 MHz, respectively. The real stress on the sample is several orders lower than the applied hydrostatic pressure, which suggests that material can sustain the stress of several GPa and hold many orders higher energy density as obtained from ANSYS.Conflicts of interest
There are no conflicts to declare.Acknowledgements
The authors would like to thank Ms Shweta, the Advanced Carbon Products group, CSIR-NPL for experimental support. The authors also want to thank CSIR-NPL for the partial departmental funding to pursue the project. The authors also want to thank the Director, CSIR-NPL, for constant encouragement. Mr Vikas Narayan Thakur wants to thank the AcSIR for pursuing PhD and UGC for the fellowship.References
- Z.-Y. Cheng, R. S. Katiyar, X. Yao and A. Guo, Phys. Rev. B: Condens. Matter Mater. Phys., 1997, 55, 8165–8174 CrossRef CAS.
- J. Kuwata, K. Uchino and S. Nomura, Ferroelectrics, 1978, 22, 863–867 CrossRef.
- N. Mizutani, C.-H. Lu, K. Shinozaki and M. Kato, J. Am. Ceram. Soc., 1990, 73, 1214–1220 CrossRef CAS.
- T. Hachiga, S. Fujimoto and N. Yasuda, J. Phys. D: Appl. Phys., 1987, 20, 1291–1296 CrossRef CAS.
- A. A. Bokov and V. Y. Shonov, Ferroelectrics, 1990, 108, 237–240 CrossRef CAS.
- N. Setter and L. E. Cross, Phys. Status Solidi, 1980, 61, K71–K75 CrossRef CAS.
- R. Liang and Q.-M. Wang, Sens. Actuators, A, 2015, 235, 327 CrossRef.
- M. Yonezawa, Am. Ceram. Soc. Bull., 1983, 62, 1375–1383 CAS.
- S. Nomura and K. Uchino, Ferroelectrics, 1983, 50, 197–202 CrossRef.
- D. A. Ciubotariu, I. A. Ivan, C. Clévy and P. Lutz, Sens. Actuators, A, 2016, 252, 242–252 CrossRef CAS.
- M. V. Radhika Rao, A. M. Umarji, Y. Kumar, K. K. Jain and E. S. Rajgopal, J. Mater. Sci. Lett., 1997, 16, 122–125 CrossRef.
- Y. Kumar, V. Kumar, K. K. Jain and S. C. Kashyap, Sens. Actuators, B, 1999, 55, 217–221 CrossRef CAS.
- V. Kumar and S. Yadav, Sens. Actuators, A, 2017, 258, 101–104 CrossRef CAS.
- R. Zhang, X. Wu, Y. Li, W. Shao, Y. Zhang, Z. Liu, J. Nie, J. Tan and W. Ye, RSC Adv., 2020, 10, 7443–7451 RSC.
- L. Ma, X. Shuai, Y. Hu, X. Liang, P. Zhu, R. Sun and C. P. Wong, J. Mater. Chem. C, 2018, 6, 13232–13240 RSC.
- J. Li, R. Bao, J. Tao, Y. Peng and C. Pan, J. Mater. Chem. C, 2018, 6, 11878–11892 RSC.
- Y. Zang, F. Zhang, C. A. Di and D. Zhu, Mater. Horiz., 2015, 2, 140–156 RSC.
- Y. Feng, W. L. Li, D. Xu, W. P. Cao, Y. Yu and W. D. Fei, RSC Adv., 2016, 6, 36118–36124 RSC.
- J. Yao, C. Xiong, L. Dong, C. Chen, Y. Lei, L. Chen, R. Li, Q. Zhu and X. Liu, J. Mater. Chem., 2009, 19, 2817–2821 RSC.
- J. Chang, Y. Shen, X. Chu, X. Zhang, Y. Song, Y. Lin, C. W. Nan and L. Li, RSC Adv., 2015, 5, 51302–51307 RSC.
- W. Jin, Z. Wang, H. Huang, X. Hu, Y. He, M. Li, L. Li, Y. Gao, Y. Hu and H. Gu, RSC Adv., 2018, 8, 7422–7427 RSC.
- Y. Yang, H. Tian, B. Yan, H. Sun, C. Wu, Y. Shu, L. G. Wang and T. L. Ren, RSC Adv., 2013, 3, 24900–24905 RSC.
- L. Q. Cheng, Z. Xu, C. Zhao, H. C. Thong, Z. Y. Cen, W. Lu, Y. Lan and K. Wang, RSC Adv., 2018, 8, 35594–35599 RSC.
- N. F. K. Bahanurddin, M. H. Jumali, J. J. Mohamed and Z. A. Ahmad, J. Ceram. Process. Res., 2015, 16, 258–261 Search PubMed.
- T. Hachiga, S. Fujimoto and N. Yasuda, J. Phys. D: Appl. Phys., 1987, 20, 1291–1296 CrossRef CAS.
- V. N. Thakur, A. Zafer, S. Yadav and A. Kumar, Sens. Actuators, A, 2019, 297, 111536 CrossRef.
- J. Wang, J. B. Neaton, H. Zheng, V. Nagarajan, S. B. Ogale, B. Liu, D. Viehland, V. Vaithyanathan, D. G. Schlom, U. V Waghmare, N. A. Spaldin, K. M. Rabe, M. Wuttig and R. Ramesh, Science, 2003, 299, 1719–1722 CrossRef CAS PubMed.
- J. Wang, C. S. Sandu, E. Colla, Y. Wang, W. Ma, R. Gysel, H. J. Trodahl, N. Setter and M. Kuball, Appl. Phys. Lett., 2007, 90, 133107 CrossRef.
- S. R. Basu, L. W. Martin, Y. H. Chu, M. Gajek, R. Ramesh, R. C. Rai, X. Xu and J. L. Musfeldt, Appl. Phys. Lett., 2008, 92, 091905 CrossRef.
- A. J. Hauser, J. Zhang, L. Mier, R. A. Ricciardo, P. M. Woodward, T. L. Gustafson, L. J. Brillson and F. Y. Yang, Appl. Phys. Lett., 2008, 92, 222901 CrossRef.
- H. Borkar, V. Rao, M. Tomar, V. Gupta, J. F. Scott and A. Kumar, Mater. Today Commun., 2018, 14, 116–123 CrossRef CAS.
- G. H. Haertling, J. Am. Ceram. Soc., 1999, 82, 797–818 CrossRef CAS.
- Z. G. Zhu, B. S. Li, G. R. Li, W. Z. Zhang and Q. R. Yin, Mater. Sci. Eng., B, 2005, 117, 216–220 CrossRef.
- P. W. M. Blom, R. M. Wolf, J. F. M. Cillessen and M. P. C. M. Krijn, Phys. Rev. Lett., 1994, 73, 2107–2110 CrossRef CAS PubMed.
- L. Pintilie, I. Boerasu, M. J. M. Gomes, T. Zhao, R. Ramesh and M. Alexe, J. Appl. Phys., 2005, 98, 124104 CrossRef.
- L. Pintilie and M. Alexe, J. Appl. Phys., 2005, 98, 124103–124109 CrossRef.
- ASTM Compass, https://compass.astm.org/EDIT/html_annot.cgi?C1424+15(2019), accessed 16 January 2020.
- H. Cao and A. G. Evans, J. Am. Ceram. Soc., 1993, 76, 890–896 CrossRef CAS.
| This journal is © The Royal Society of Chemistry 2020 |