DOI:
10.1039/D0RA00483A
(Paper)
RSC Adv., 2020,
10, 10134-10143
Comparison of electrocatalytic activity of Pt1−xPdx/C catalysts for ethanol electro-oxidation in acidic and alkaline media†
Received
16th January 2020
, Accepted 24th February 2020
First published on 10th March 2020
Abstract
In this paper, a comparision of Pt1−xPdx/C catalysts for ethanol-oxidation in acidic and alkaline media has been investigated. We prepared Pt1−xPdx/C catalysts with different ratios of Pt/Pd (x at% = 0, 27, 53, 77 and 100) by the formic acid reduction method. The obtained Pt1−xPdx/C catalysts were characterized by X-ray diffraction (XRD), energy dispersive X-ray spectroscopy (EDX), induced coupled plasma-atomic emission spectroscopy (ICP-AES), X-ray photoelectron spectroscopy (XPS) and transmission electron microscopy (TEM). Structural and morphological investigations of the as-prepared catalysts revealed that the metallic particle size increases with increasing Pd content in the catalyst. The electrocatalytic performances and stabilities of Pt1−xPdx/C catalysts were tested by cyclic voltammetry (CV), linear sweep voltammetry (LSV) and chronoamperometry (CA) measurements for ethanol oxidation in acidic and alkaline media. The electrochemical measurements demonstrate that Pt1−xPdx/C catalysts exhibit much higher electrocatalytic activity for alcohol oxidation in alkaline media than that in acidic media. The composition of Pt/Pd has a significant impact on the ethanol-oxidation in both acidic and alkaline media. The Pt23Pd77/C catalyst shows the highest electrocatalytic performance with a mass specific peak current of 2453.7 mA mgPtPd−1 in alkaline media, which is higher than the Pt77Pd23/C with the maximum of peak current of 339.7 mA mgPtPd−1 in acidic media. Meanwhile, the effect of electrolyte, CH3CH2OH concentrations and scan rates was also studied for ethanol-oxidation in acidic and alkaline media.
1. Introduction
Direct ethanol fuel cells (DEFCs) have received considerable interest due to their high energy density, low toxicity and price, and environmentally friendly nature.1,2 Currently, Pt is the most efficient electrocatalyst that has been utilized in DEFCs.3 However, it is still a challenge to realise large-scale commercialization due to their low abundance, high cost, and poor tolerance of reaction intermediates (mainly CO).4,5 Thus, to solve the issue, many researchers have been devoted to decreasing the Pt loading by incorporating alternative lower cost metals into the Pt such as Cu,6 Pd,7 Ni,8 Fe,9 etc, and enhancing the CO tolerance by introducing some metal oxides into the catalyst such as CeO2,10 TiO2,11 SnO2,12 RuO2,13 etc. Hence, the catalytic performances and CO resistance of Pt can be boosted by modifying the surface electronic structure of Pt and the bifunctional mechanism between the two metals14,15 Among various metals, Pd is known to be an excellent candidate to form bimetallic Pt-based catalysts towards ethanol oxidation,16 due its ability to remove CO species adsorbed on Pt and then enhance the activity and the anti-poison ability.17 Moreover, Pd easily forms alloys with Pt due to the similar atom structure,18 and has a lower price than Pt.
Recently, some researchers have been devoted to fabricating various PtPd nanostructures for ethanol oxidation, including alloys,19 nanocubes,20 nanoflowers,21 nanorods,22 nanodendrites23 and core–shell structures.24 For instance, Liu et al.25 prepared a PtPd alloy catalyst supported on graphene for ethanol oxidation in alkaline solutions and found that PtPd with the ratios of 0.46![[thin space (1/6-em)]](https://www.rsc.org/images/entities/char_2009.gif) :0.54 possessed excellent catalytic activity and durability. Lu and co-workers26 fabricated three-dimensional platinum–palladium hollow nanospheres with a dendritic shell (PtPd-HNSs) through a facile and economic route, which show remarkable activity and durability toward the methanol oxidation reaction (MOR) in acidic media, owing to the coupled merits of bimetallic nanodendrites and a hollow interior. And Alcaide et al.27 revealed that prepared Pd–Pt catalysts with a Pd:Pt atomic ratio of 25:75 showed the best performance in direct methanol single fuel cells in acidic media. Shen and co-workers28 reported that Pd/C has a higher catalytic activity and better steady-state performance for ethanol electrooxidation than Pt/C in alkaline media, which probably due to the fact that OH species formed easily on the Pd surface react with CO-like intermediate species to produce CO2 and release the active sites.29 Carvalho et al.30 prepared carbon-supported Pd, Pt, Pt1Pd1, and Pt3Pd1 electrocatalysts for ethanol oxidation and compared the electrochemical activities of catalysts in acid and alkaline media. Although many papers about the best ratio of PtPd for ethanol electro-oxidation in acidic or alkaline medium were investigated, the involving comparision of the electroactivity toward ethanol oxidation in both acid and alkaline solution is not available in the literature in details.
:0.54 possessed excellent catalytic activity and durability. Lu and co-workers26 fabricated three-dimensional platinum–palladium hollow nanospheres with a dendritic shell (PtPd-HNSs) through a facile and economic route, which show remarkable activity and durability toward the methanol oxidation reaction (MOR) in acidic media, owing to the coupled merits of bimetallic nanodendrites and a hollow interior. And Alcaide et al.27 revealed that prepared Pd–Pt catalysts with a Pd:Pt atomic ratio of 25:75 showed the best performance in direct methanol single fuel cells in acidic media. Shen and co-workers28 reported that Pd/C has a higher catalytic activity and better steady-state performance for ethanol electrooxidation than Pt/C in alkaline media, which probably due to the fact that OH species formed easily on the Pd surface react with CO-like intermediate species to produce CO2 and release the active sites.29 Carvalho et al.30 prepared carbon-supported Pd, Pt, Pt1Pd1, and Pt3Pd1 electrocatalysts for ethanol oxidation and compared the electrochemical activities of catalysts in acid and alkaline media. Although many papers about the best ratio of PtPd for ethanol electro-oxidation in acidic or alkaline medium were investigated, the involving comparision of the electroactivity toward ethanol oxidation in both acid and alkaline solution is not available in the literature in details.
Herein, we report Pt1−xPdx/C catalysts with different ratios of Pt/Pd by formic acidic reduction method for ethanol electro-oxidation in acidic and alkaline media. The obtained samples were characterized by X-ray diffraction (XRD), energy-dispersive X-ray analysis (EDX), transmission electron microscopy (TEM), induced coupled plasma-atomic emission spectroscopy (ICP-AES). The catalytic performance and stability of the composite electrodes for the ethanol oxidation under both in acid and alkaline conditions were explored by cyclic voltammetry and chronoamperometry. In addition, the effect of electrolyte and CH3CH2OH concentrations, scan rates were also studied for ethanol-oxidation in acidic and alkaline media.
2. Experimental
2.1 Materials and reagents
H2PtCl6·6H2O, PdCl2, KOH, HCOOH and H2SO4 were purchased from Sinopharm Chemical Reagent Co., Ltd. All chemicals were of analytical grade purity. Carbon black was obtained from Suzhou Baohua Carbon Black Co., Ltd. A deionized water (resistance: 18.25 MΩ cm−1) was used for the preparation of aqueous solution.
2.2 Catalyst preparation
In a typical preparation, the carbon-supported Pt1−xPdx (x = 0, 0.27, 0.53, 0.77, and 1) catalysts were prepared by formic acidic reduction method.31 Briefly, 0.61 mL H2PtCl6 (7.723 mM) and 0.72 mL H2PdCl4 solution (22.55 mM) with a corresponding Pt to Pd molar ratio of 25:75 were added to 30 mL deionized water and mixed with 50 mg carbon black. This mixture solution was stirred for 30 min and ultrasonicated for 30 min at room temperature. Then, an aqueous solution of formic acidic (2.0 M, 40 mL) was added slowly to the above mixture under rapid stirring. After that, the above obtained solution was heated to 80 °C by an oil bath while stirring and refluxing for 3 h. Finally, the Pt1−xPdx/C catalysts were washed and dried in a vacuum oven at 60 °C. In addition, Pt/C, Pd/C, PtPd (50:50)/C and PtPd (75:25)/C catalysts were also prepared by a similar way. Here, a theoretical amount of PtPd loading on carbon black was controlled at 10 wt% with a nominal Pt:Pd atomic ratios of 75:25, 50:50 and 25:75. The EDS spectra showed that the Pt and Pd elements in the Pt1−xPdx/C compositions with the atomic ratios of 83:17, 54:46 and 39:61 summarized in Table 1, which were close to the feed ratio of the precursors. In addition, the actual loading and the atomic ratios of Pt:Pd were 73:27, 47:53 and 23:77 according to the measurement of inductive coupled plasma emission spectrometer (ICP) and the data were summarized in Table 1, which is similar to the results of nominal compositions. Based on the results of the ICP data, the as-prepared catalysts were denoted as Pt/C, Pt73Pd27/C, Pt47Pd53/C, Pt23Pd77/C and Pd/C, respectively.
Table 1 Comparison of parameters on as – prepared catalysts
| Catalysts |
Metal loading (wt%) |
Pt:Pd (at/at) |
α/Å |
d/nm by XRD |
ECSA/m2 g−1 |
| Pt |
Pd |
By EDX |
By ICP |
| Pt/C |
9.14 |
— |
— |
— |
3.921 |
4.0 |
27.07 |
| Pt73Pd27/C |
6.53 |
1.33 |
83:17 |
73:27 |
3.911 |
4.3 |
25.35 |
| Pt47Pd53/C |
5.06 |
3.15 |
54:46 |
47:53 |
3.901 |
5.9 |
23.12 |
| Pt23Pd77/C |
3.02 |
5.60 |
39:61 |
23:77 |
3.891 |
9.8 |
21.98 |
| Pd/C |
— |
7.79 |
— |
— |
3.891 |
11.5 |
16.89 |
2.3 Characterizations
A S-4700 energy dispersive X-ray spectrometry (EDX) and 710-ES ICP were used to obtain the composition of as-prepared PtPd alloy catalysts. Transmission electron microscope (TEM, JEM-1011, Japanese Electronics Co. Ltd, Japan) was used to characterize the morphology and structure of the as-prepared materials. Power X-ray diffraction (XRD, PANalytical X'Pert PRO MRD system with Cu Kα radiation) spectra were used to analyse the structure characterisation of PtPd alloy catalysts. X-ray photoelectron spectroscopy (XPS) experiments were carried on a K-Alpha instrument (ThermoFisher), and the binding energies were calibrated by C 1s (284.8 eV).
2.4 Electrochemical measurements
In order to perform the electrochemical measurements, it was prepared a dispersion of catalysts, which consists in 10.0 mg as-prepared catalyst powders dispersing in the mixture of 4.0 mL deionized water and 50 mL Nafion solution for 30 min. Then, a 10.0 μL homogeneous catalyst ink was spread on the surface of glass carbon electrode (GCE) and dried at 60 °C. The metallic loading for Pt/C, Pt73Pd27/C, Pt47Pd53/C, Pt23Pd77/C and Pd/C on GCE were about 0.032 mg cm−2, 0.028 mg cm−2, 0.029 mg cm−2, 0.031 mg cm−2, and 0.027 mg cm−2, respectively.
Electrochemical measurements were performed in a classical three-electrodes-cell by a CHI 660B electrochemical workstation at room temperature. A GCE (3.0 mm in diameter), Pt plate and a saturated calomel electrode (SCE) were used as the working, counter and reference electrodes, respectively. Unless otherwise stated, all the applied potential were referenced to SCE. The electrocatalytic activity of ethanol in acid medium was carried out 0.5 M H2SO4 + 1.0 M CH3CH2OH solution while the alkaline oxidation of ethanol was performed in 1.0 M KOH + 1.0 M CH3CH2OH by cyclic voltammogram (CV) measurement at the scan rate of 50 mV s−1. Chronoamperometries (CA) tests of samples were recorded at 0.5 V in acid solution or −0.5 V in alkaline solution for 3600 s, respectively. The CA curves were performed in the same electrolyte as CV measurement.
3. Results and discussion
3.1 XRD analysis
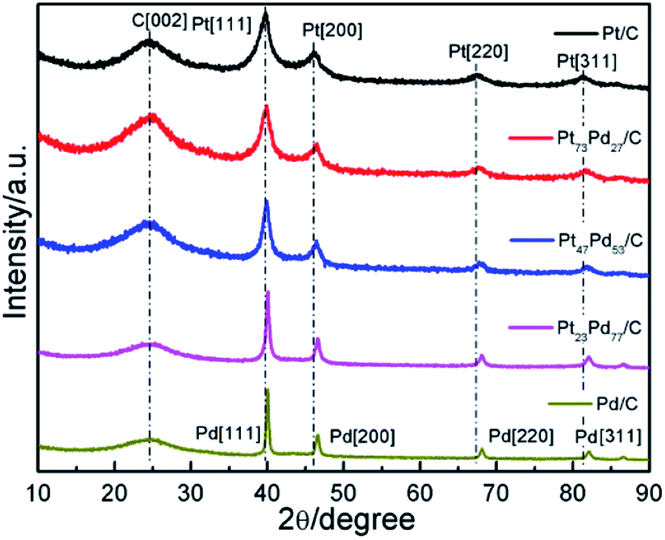
The crystal structures of as-prepared Pt1−xPdx/C catalyst were determined using XRD and recorded in Fig. 1. All the catalysts show a broad diffraction peak at about 25°, ascribed to the reflection of C (002) plane. For the pure Pt, the diffraction peaks situated at the 2θ value of 39.8°, 46.4°, 67.5°, 81.3° are corresponding to (111), (200), (220) and (311) planes of face-centered-cubic (fcc) crystalline Pt [JCPDS 04-0802], respectively.32 Meanwhile, the four peaks of the monometallic Pd at about 40.1°, 46.7°, 68.1°, 82.0° are attributed to the (111), (200), (220) and (311) lattice planes of fcc crystalline Pd [JCPDS no. 46-1043], respectively.14 For the Pt73Pd27/C, Pt47Pd53/C, Pt23Pd77/C catalysts, the diffraction peaks shift slightly to higher 2θ angles with respect to Pt, with the increment of Pd amount. The lattice constant in Table 1 and the average particle size were estimated based on the diffraction peaks of (220). The lattice parameters of Pt1−xPdx/C are smaller than that of Pt/C (3.921 Å) and larger than that of Pd/C (3.891 Å), revealing the formation of Pt1−xPdx alloy.33,34 The average particle size was calculated from the XRD analysis according to the Debye–Scherrer formula:35
| d = κλ/Bcosθ |
where d is the crystalline size in nanometers, λ is the wavelength of the radiation (1.54056 Å for CuKα radiation), κ is a constant with value of 0.89, B is the peak width at half maximum intensity, and θ is the peak position. The average particle size for the Pt, Pt73Pd27, Pt47Pd53, Pt23Pd77 and Pd on carbon black was about 4.0, 4.3, 5.9, 9.8, and 11.5 nm, respectively. Obviously, the particle size of carbon supported metals increases with the Pd content increases, which is consist with the previous report.36,37 The quick reduction reaction for Pt catalysts could form a large amount of product with a very tiny nucleus in a short time and result in the well-dispersed nanoparticles, while for Pd catalyst could result in the uneven dispersion of nanoparticles.38 The increase of particle size for Pt1−xPdx alloy and Pd has an effect on the electrochemical active surface area (ECSA) of catalyst. As seen from the Table 1, the small size of particles possess larger ECSA compared to the large particles. The higher ECSA of catalyst is most likely ascribed to the high dispersions of metal nanoparticles with small size on the substrates, contributing to its high electrocatalytic performance for ethanol oxidation.39,40
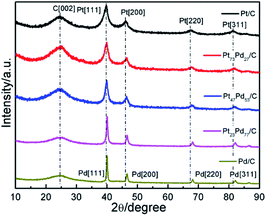 |
| | Fig. 1 XRD patterns of Pt/C, Pt73Pd27/C, Pt47Pd53/C, Pt23Pd77/C and Pd/C catalysts. | |
3.2 TEM analysis
To investigate the morphological and structural feature of the Pt/C, Pt73Pd27/C, Pt47Pd53/C, Pt23Pd77/C and Pd/C catalysts, TEM analysis was conducted and recorded in Fig. 2. As shown in Fig. 2A, for Pt/C catalyst, the Pt nanoparticles are uniformly distributed on the carbon support without obvious agglomerations. However, the Pd nanoparticles with large size on the Pd/C catalyst appear agglomeration and connect together (Fig. 2E). Compared with the mono-Pd counterpart, the dispersion of Pt and PtPd nanoparticles in the mono/bimetallic catalysts exhibits more uniform. Previous study revealed that Pd tends to form twinned or multiple twinned seeds while Pt prefers to form single crystal seeds,41,42 which may be responsible for the less agglomeration of Pt-containing Pd1−xPtx/C electrocatalysts. Obviously, the sizes of the metallic nanoparticles increase with the increasing the content of Pd in all samples, of which Pd/C catalyst shows the largest particle size. The results of dimensions of metallic nanoparticles in TEM analysis are consist with the XRD patterns.
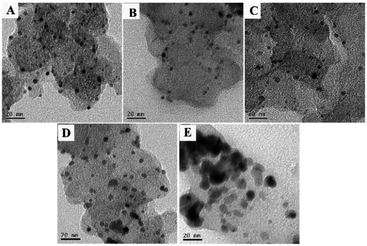 |
| | Fig. 2 TEM images of Pt/C (A), Pt73Pd27/C (B), Pt47Pd53/C (C), Pt23Pd77/C (D) and Pd/C (E) catalysts. | |
3.3 XPS analysis
X-ray photoelectron spectroscopy (XPS) was employed to investigate the surface composition and oxidation states of the as-prepared samples. Fig. 3A shows the Pt 4f XPS spectra of Pt/C, Pt73Pd27/C, Pt47Pd53/C and Pt23Pd77/C. Each curve exhibits two prominent peaks located at 71.10 and 74.41 eV, which can be assigned to the Pt 4f7/2 and Pt 4f5/2, respectively.43 Compared to the XPS spectrum of Pt/C, the binding energies of Pt 4f slightly shift to lower values for the other Pt1−xPdx/C catalysts. Meanwhile, the shift of the peak increases with the Pd content. The Pt 4f peaks of Pt/C can be resolved into two doublets, as shown in Fig. 3C. The two prominent peaks with binding energies at 71.3 and 74.5 eV correspond to the metallic Pt, meanwhile, the other two small peaks at 72.0 and 77.1 eV are assigned to Pt oxide, such as PtO2 and PtO.44 Based on the relative integrated intensity values, metallic Pt is found to be predominant on the Pt/C catalyst. The Pd 3d spectra of Pd/C, Pt73Pd27/C, Pt47Pd53/C and Pt23Pd77/C are given in Fig. 3B. For the Pd/C sample, two peaks at about 335.45 eV and 340.65 eV are associated with Pd 3d5/2 and Pd 3d3/2, respectively. As shown in Fig. 3D, for Pd/C sample, the spectrum of Pd 3d can be deconvoluted with two doublets, the main peaks located at 335.1 eV and 340.4 eV can be assigned to the Pd 3d5/2 and Pd 3d3/2 spin orbit states of Pd(0), and the less intense peaks around 336.0 eV and 341.3 eV can be assigned to Pd 3d5/2 and Pd 3d3/2 peaks of Pd(II) species.1 Notably, by alloying with Pt, the binding energies of Pd 3d for the binary Pt1−xPdx/C catalysts are also found to negatively shift to a lower binding energy compared with pure Pd/C as the Pt content increases. Together, compared with Pt/C and Pd/C catalysts, the same phenomenon of shifts of the binding energy for Pt and Pd to a lower peak value in binary Pt1−xPdx/C catalysts, which suggests a change in the electronic density of Pt and Pd.45 The above results could be ascribed to the electronic interactions due to the addition of Pd, leading to electron transfer from Pd to Pt (electro-negativity: Pt, 2.28; Pd, 2.20).46 The XPS analysis results further indicate the formation of PtPd alloys with a shift in binding energy, which is consistent with the previous literature.47,48
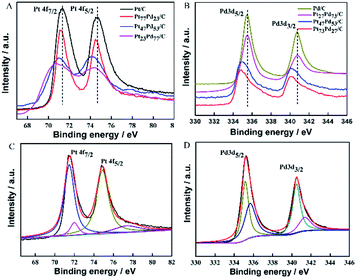 |
| | Fig. 3 XPS spectra of the samples in the binding energy range of Pt 4f (A) and Pd 3d (B); the fitted XPS spectra of Pt/C for Pt 4f (C) and Pd/C for Pd 3d (D). The spectra were obtained by calibration based on the C 1s peak at 284.5 eV. | |
3.4 Electrochemical properties of Pt1−xPdx/C
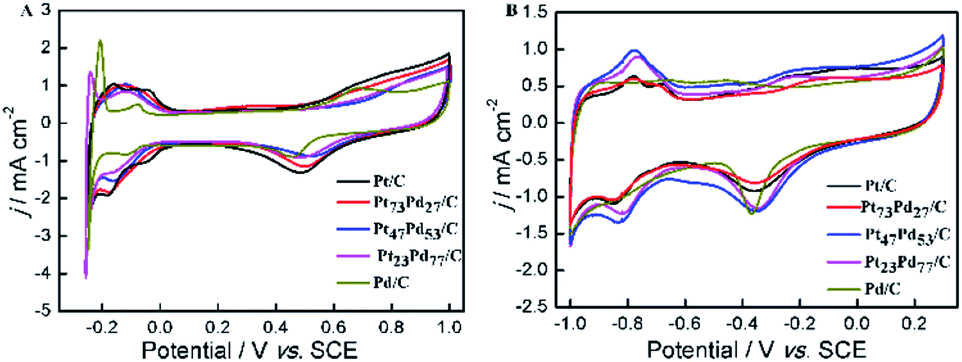
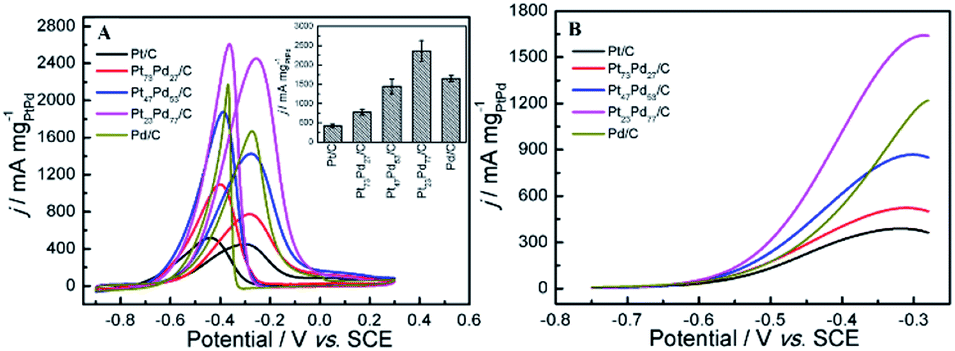
Fig. 4 shows cyclic voltammetry (CV) for Pt/C, Pt73Pd27/C, Pt47Pd53/C, Pt23Pd77/C and Pd/C catalysts in 0.5 M H2SO4 (A) and 1.0 M KOH (B) aqueous electrolytes. It can be seen that both the Pt/C and Pd/C show well defined CV shapes similar to those reported in previous literatures in acidic and alkaline electrolytes.27,28,49,50 The CV curves for Pt1−xPdx/C catalysts show slight variation in shape characteristics took to evolve from a typical for pure Pt/C to one typical for pure Pd/C as the increase of Pd content. At the high potential range (>0.23 V in H2SO4 and >−0.55 V in KOH), the peaks in the CV curves are ascribed to the oxidation and reduction of metal nanoparticles (Pt, Pd, and Pt1−xPdx alloy). The peaks associated with the typical features characteristic of hydrogen adsorption and desorption are observed in the CV curves for all-prepared catalysts at a low potential range (<0.06 V in H2SO4 and <−0.62 V in KOH). However, the hydrogen absorption/desorption peak in the low potential region on Pd/C catalyst is weaker in comparison to Pt/C and Pt1−xPdx/C in alkaline media, indicating that the Pd nanoparticles are more easily associated with OH at a low potential region. Relative to Pt/C, the hydrogen absorption/desorption peak of the Pt1−xPdx/C sample appeared to be depressed, which is due to the changes in the crystal lattice parameter and electronic properties.51 It is worth to note that the CV curves at a lower potential (<−0.17 V) presents a high peak current density on the Pt23Pd77/C and Pd/C in 0.5 M H2SO4 solution, which is due to the absorption/desorption of the large quantities of hydrogen in bulk Pd.49,52 The similar phenomena for Pt–Pd alloys have already been observed by Łukaszewski et al.53,54 and Seweryn et al.50 In acidic media, it is noted that the CV curves for all catalysts present an obvious double layer region (0.06–0.23 V) as well. However, no obvious double layer region is appeared in CV curves of alkaline media just like that in acidic media, since the adsorption of OH may even start in the hydrogen desorption region leading to the formation of metal oxides immediately after the hydrogen desorption.49 The ECSA of Pd and/or Pt-based electrocatalysts was estimated by the oxide reduction peak according to the following equation:30,55
where QS is the coulombic charge (in 1 × 10⁻⁶ C), determined by integrating the current peak of Pd (or Pt) oxide reduction divided by the scan rate; QC is the conversion factor, commonly taken as 424 × 10−6 C cm−2, corresponding to PdO (or PtO) reduction; and M is the metal loading (mg) on the GC surface. By integrating the coulombic charge associated with oxide reduction peak from the CV curves, the SECSA of the catalysts follows the sequence: Pt/C (27.07 m2 g−1) > Pt73Pd27/C (25.35 m2 g−1) > Pt47Pd53/C (23.12 m2 g−1) > Pt23Pd77/C (21.98 m2 g−1) > Pd/C (16.89 m2 g−1). It can be seen that the ECSA value decreases gradually as the increase of Pd content. This result shows that the larger ECSA value for pure Pt/C catalyst is attributed to the smaller particle size for pure Pt nanoparticles than Pt1−xPdx alloy and pure Pd, which is consistent with the results of XRD and TEM. To evaluate the catalyst anti-CO poisoning ability, we further carried out CO stripping experiments. Fig. S1 in the ESI† shows the CO stripping voltammetry on the Pt1−xPdx/C catalysts. The onset potential (Eonset) and peak potential (ECO) of CO oxidation are used to evaluate the anti-CO poisoning ability of catalysts.56 The Eonset and ECO are observed at 0.27 and 0.61 V on the Pt73Pd27/C catalyst, which are both lower than those on the Pt47Pd53/C (0.32 and 0.63 V) and Pt23Pd77/C (0.39 and 0.67 V) catalysts. The Eonset and ECO of Pt73Pd27/C are the most negative among the Pt1−xPdx/C catalyst, which indicate that the CO adsorption on Pt73Pd27/C can be more oxidized easily and removed.
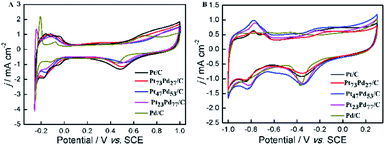 |
| | Fig. 4 CV curves in 0.5 M H2SO4 (A) and 1.0 M KOH (B) solution on Pt/C, Pt73Pd27/C, Pt47Pd53/C, Pt23Pd77/C and Pd/C. The current scale was normalized by the ESCA based on the oxide reduction peak. | |
3.5 Ethanol electro-oxidation
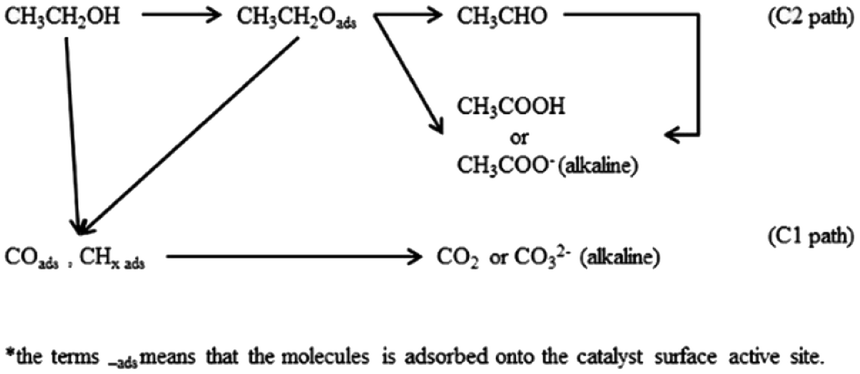
3.5.1 Ethanol electro-oxidation in acidic medium. The electrocatalytic activity toward ethanol oxidation on as-prepared catalysts were investigated by cyclic voltammograms (CV), linear sweep voltammetry (LSV), and chronoamperometry (CA) in both acidic and alkaline solutions. Initially, Fig. 5 shows the results of electrochemical measurements for ethanol oxidation in acidic media. The main steps for the oxidation of ethanol were described as follows.57,58 The current for ethanol oxidation on Pt-based catalysts mainly originated from the C1 and C2 pathway (Scheme 1). The final reaction product is supposed to the acetic acid in acid medium. Moreover, there are other possible species that can be formed during the ethanol electro-oxidation, including reduced species.
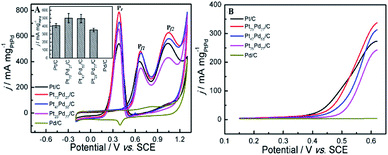 |
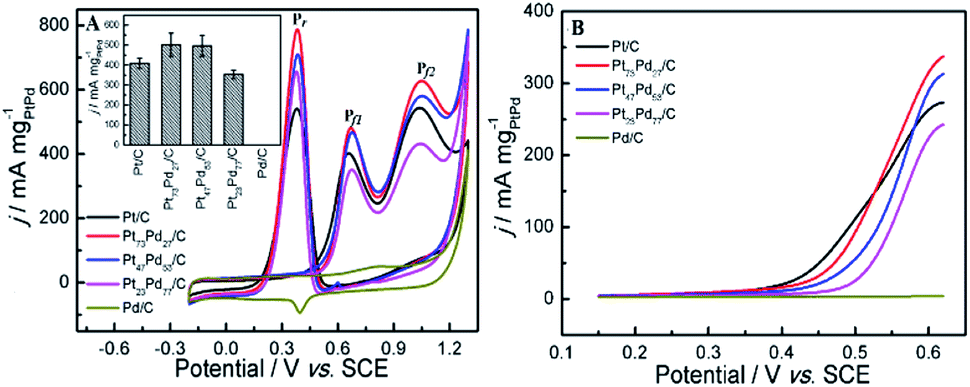
| | Fig. 5 CV curves (A) and LSV curves (B) of ethanol oxidation on different electrodes in 0.5 M H2SO4 + 1.0 M CH3CH2OH. Inset image in panel A is the histograms of calculated mass activity of first forward scan peaks (Pf1) on different electrocatalysts for ethanol oxidation. | |
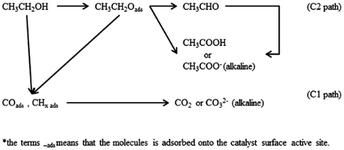 |
| | Scheme 1 C1 and C2 pathway of ethanol oxidation on Pt-based catalysts. | |
The typical CV curves for ethanol electro-oxidation on Pt1−xPdx/C catalysts in acidic media are presented in Fig. 5A, featuring three well-defined current peaks,59,60 two on the forward and the other on the reverse potential scan signed as Pf1 (at ∼0.655 V), Pf2 (at ∼1.037 V), and Pr (at ∼0.374 V), respectively. The first oxidation peak (Pf1) is ascribed to the dehydrogenation of ethanol, whereas the second peak (Pf2) refers to the oxidation process involving with surface-adsorbed oxygen-like species.42 It can be seen in inset of Fig. 5A, that the catalyst with the Pd content less than 50% presents slightly higher electrocatalytic activities (shown as the peak current densities at Pf1) than pure Pt/C. Nevertheless, the electrocatalytic performance decreases obviously when the Pd content is more than 50% in Pt1−xPdx/C, and the electrocatalytic activity is close to zero on pure Pd/C. However, for the formation of reverse scan peak (Pr) is still unclear.61 Consequently, the ratio of the two forward peak current density (jf1/jf2) could be used to quantify the capacity of catalysts for the ethanol oxidation.61 As seen in Table 2, the jf1/jf2 ratio were calculated to be 0.809 for Pt23Pd77/C catalyst, which is higher than Pt47Pd53/C (0.798), Pt73Pd27/C (0.769) and Pt/C (0.748). The results indicate that the Pt1−xPdx/C catalysts with high Pd loading can enhance the ability to break the C–C bond in ethanol and thus achieve complete oxidation of ethanol to CO2.
Table 2 Comparison of parameters of measurements on catalysts in acidic medium
| Catalysts |
In acidic media |
| Eop (V) |
Ep (V) |
jf1 (mA mg−1) |
jf2 (mA mg−1) |
jf1/jf2 |
| Pt/C |
0.332 |
0.655 |
403.3 |
538.9 |
0.748 |
| Pt73Pd27/C |
0.358 |
0.678 |
482.1 |
627.1 |
0.769 |
| Pt47Pd53/C |
0.385 |
0.674 |
463.1 |
580.3 |
0.798 |
| Pt23Pd77/C |
0.421 |
0.674 |
349.6 |
432.1 |
0.809 |
| Pd/C |
— |
— |
— |
|
— |
Also, it can be found in Fig. 5B that the onset potential (Eop) of ethanol electro-oxidation on as-prepared catalysts is shifted to the positive direction as the increase of Pd content in Pt1−xPdx/C compared to pure Pt/C, in agreement with the results by Seweryn et al.50 and Lopes et al.62 The result indicates that, as in the case of ethanol oxidation in acid media on Pt, the cleavage of the C–C bond is rather difficult on the Pd catalyst.63 Likewise, the oxidation of ethanol on the Pt1−xPdx/C (x > 0.5) is more difficult than on pure Pt/C, which is probably attributed to that the dissociative chemisorption of ethanol requires the existence of several adjacent Pt ensembles and the presence of atoms of the second metal around the Pt active sites could block ethanol adsorption on Pt sites due to the dilution effect.62,64
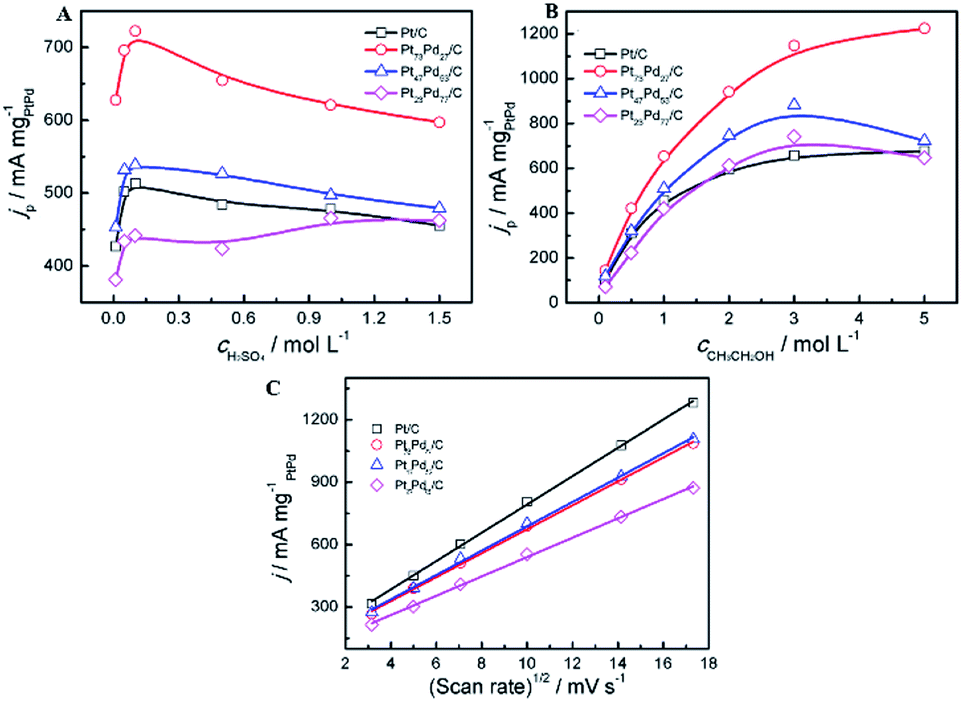
The effect of the concentration of electrolyte (H2SO4, CH3CH2OH) and the scan rates on the peak current density at the electrodes was investigated. As shown in Fig. 6, the oxidation peak current density is closely related to the concentration of electrolyte solution and scan rates. For all catalysts, it can be observed that the peak current density increases with the concentration of H2SO4 at the initial stage and then declines gradually to a stable value (Fig. 6A). In acid media, the current density on the Pt73Pd27/C is always higher than that on the other catalyst. And the forward peak current density reaches the maximum at the concentration of 0.1 mol L−1 of H2SO4. Electro-activity of the all the samples for the ethanol oxidation was further examined at different ethanol concentrations, as shown in Fig. 6B. For the Pt/C and Pt73Pd27/C catalysts, the peak current density increases as the ethanol concentration increases. The increase in the current density with ethanol can be clarified by the adsorption reaction of ethanol and its further oxidation.20,65 For the Pt1−xPdx/C (x > 0.5) catalyst, when the ethanol centration reaches 3.0 mol L−1, the forward peak current density reaches the maximum and a saturation of the current response is observed at the ethanol concentration of 3.0 mol L−1. This indicates that oxidation rate of the electrode surface is related to the concentration of ethanol, and the active sites of the electrode reach the saturation at the ethanol concentration of 3.0 mol L−1. Subsequently, the peak current shows a decrease gradually with higher ethanol concentrations, which may be due to the accumulation of absorbed species on the surface of catalyst. The oxidation peak current densities increase as the scan rate increased in acid media. As depicted in Fig. 6C, the peak current densities are proportional to the square root of the scan rate (v1/2). The above results suggest that the process of ethanol electrooxidation on all samples is under diffusion controlled process. This implies that the reaction between catalysts and ethanol relies on the rate of diffusion of ethanol in order to reach the catalysts.
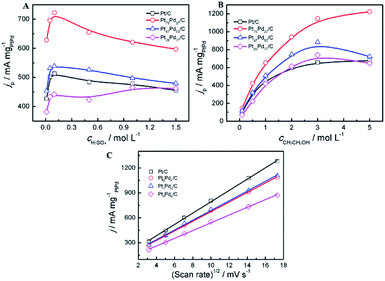 |
| | Fig. 6 Effect of the concentrations of H2SO4 (A), CH3CH2OH (B) and the scan rates (C) on the peak current density in acid media, respectively. Inset of (C) jp vs. the square root of scan rates. Catalysts: Pt/C, Pt73Pd27/C, Pt47Pd53/C, Pt23Pd77/C and Pd/C. | |
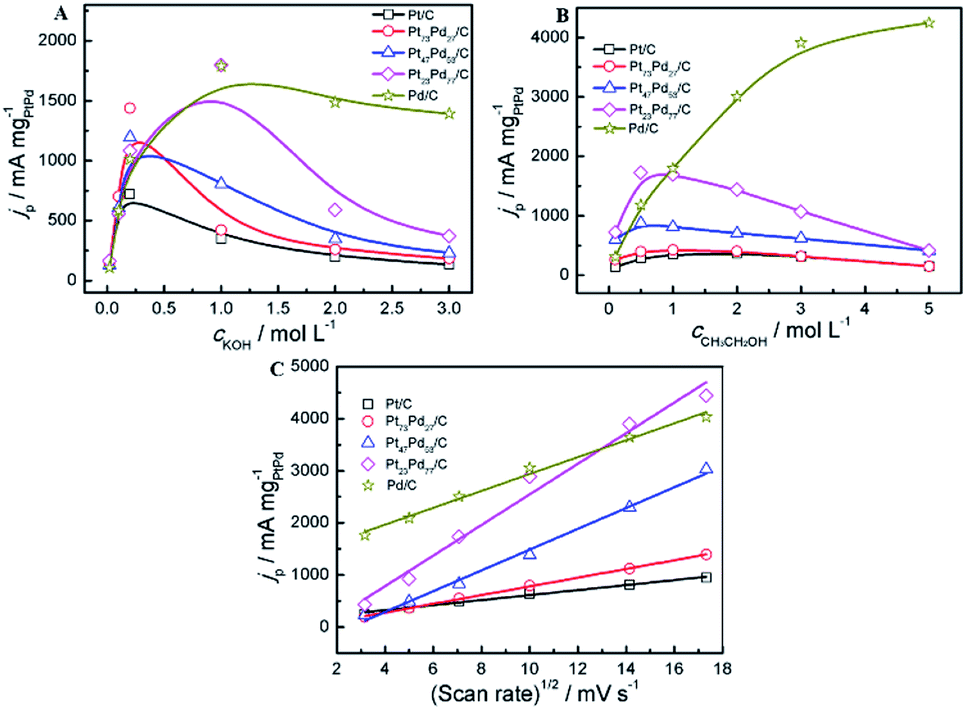
3.5.2 Ethanol electro-oxidation in alkaline medium. Fig. 7 shows the relevant electrochemical measurements on as-prepared catalysts for ethanol oxidation in 1.0 M KOH + 1.0 M CH3CH2OH solution. As shown in Fig. 7A, the CV curves only present two well-defined oxidation peaks (Pf1 in the forward scan and Pr in reverse scan). The forward scan peak (Pf1) is related to the oxidation of freshly chemisorbed species issued from alcohol adsorption, whereas the other peak (Pr) in the reverse scan is ascribed to the removal of the incompletely oxidized carbonaceous species formed during the forward scan.32 The electrocatalytic activities for EOR of pure Pd and Pt1−xPdx/C alloy catalysts are remarkably higher than that of pure Pt in alkaline media. This result is quite in agreement with the previous reports.63 As we known, both Pt-based and Pd-based catalyst exhibits much higher electrocatalytic activity for alcohol oxidation in alkaline media than that in acidic media.33 Furthermore, the activity of Pd for ethanol electro-oxidation in alkaline media is higher than that of Pt, which is mainly attributed to the higher oxyphilic characteristics of Pd/C and the relatively inert nature of Pd/C on C–C bond cleavage.29,49 Simultaneously, during the whole process, the Pt23Pd77/C exhibits the highest oxidation peak current density of 2453.7 mA mg−1, which is 3.15, 1.73, 5.41 and 1.46 times as large as those of Pt73Pd27/C (778.4 mA mg−1), Pt47Pd53/C (1421.6 mA mg−1), Pt/C (453.2 mA mg−1), and Pd/C (1676.4 mA mg−1), respectively. Compared to various Pt or Pd-based catalysts reported in previously literatures previously literatures (summarized in Table S1 in the ESI†), it is noteworthy that the mass activity of the Pt23Pd77/C catalyst is also obviously higher.
 |
| | Fig. 7 CV curves (A) and LSV curves (B) of ethanol oxidation on different electrodes in 1.0 M KOH + 1.0 M CH3CH2OH. Inset image in panel A is the histograms of calculated mass activity of different electrocatalysts for ethanol oxidation. | |
The onset potential of ethanol electro-oxidation (Table 3) is obtained on as-prepared catalysts in alkaline media based on the LSV curves in Fig. 7B. The pure Pd/C and Pt1−xPdx/C show a lower onset potential compared to pure Pt/C. It can be found that the onset potential for ethanol electro-oxidation on Pt23Pd77/C and Pt47Pd53/C shift negatively 125 mV and 118 mV in comparison with that on pure Pt/C, respectively. More than 100 mV reduction on the onset potential for anodic reaction indicates the significant enhancement in the kinetics of the ethanol oxidation reaction (EOR).29,66
Table 3 Comparison of parameters of measurements on catalysts in alkaline medium
| Catalysts |
In alkaline media |
| Eop (V) |
Ep (V) |
jf (mA mg−1) |
jb (mA mg−1) |
jf/jb |
| Pt/C |
−0.576 |
−0.294 |
453.2 |
516.8 |
0.877 |
| Pt73Pd27/C |
−0.582 |
−0.281 |
778.4 |
1104.1 |
0.705 |
| Pt47Pd53/C |
−0.694 |
−0.276 |
1421.6 |
1875.5 |
0.758 |
| Pt23Pd77/C |
−0.701 |
−0.254 |
2453.7 |
2615.9 |
0.938 |
| Pd/C |
−0.608 |
−0.273 |
1676.4 |
2157.5 |
0.777 |
The effect of the concentration of electrolyte (KOH, CH3CH2OH) and the scan rates on the peak current density at the electrodes was investigated in alkaline media. Fig. 8A shows the peak current density on the different electrodes (Pt/C, Pd/C and Pt1−xPdx/C) in a 1.0 M ethanol solution containing various concentrations of KOH solutions ranging from 0.010 to 3.0 M. For all catalysts, it can be observed that the peak current density increases with the concentration of KOH at the initial stage and then declines gradually to a stable value in alkaline media, which is consist with the acid media (Fig. 7A). The above results show that the kinetics of the ethanol oxidation were improved by the greater availability of OH− ions in solution and/or a higher OH− coverage of the electrode surface.67 For Pt/C, Pt73Pd27/C and Pt47Pd53/C catalysts, the forward peak current density reaches the maximum at the concentration of 0.2 mol L−1, while the other catalyst appears at the concentration of 1.0 mol L−1 in alkaline media. At the initial stage, the increase of the KOH concentration not only accelerate the dehydrogenation process but also lead to a higher coverage of the reactive Pd–OHads, which facilitates the ethanol oxidation by the removal of the adsorbed ethoxi in alkaline medium. However, at higher KOH concentrations, excessive hydroxyl coverage on the catalysts will be dominant, thereby confining the adsorption of ethanol with inadequate coverage of ethoxi.68 As a result, the imbalance in the coverage of hydroxyl and ethoxi will lead to the decrease in the peak current density of ethanol oxidation. To investigate the effect of CH3CH2OH on the catalytic performance, different concentration of CH3CH2OH ranging from 0.01 to 5.0 mol L−1 was applied (Fig. 8B). In alkaline media, for Pt/C and Pt1−xPdx/C catalysts, the peak current reaches the maximum value at the ethanol centration of 1.0 mol L−1. The increase in the peak current density with the concentration of ethanol between 0.1 M and 1 M can be explained by the adsorption reaction of ethanol and its further oxidation. The increase of ethanol concentration can promote the formation of the adsorbed ethanol, thereby yielding an increase in the oxidation peak density of ethanol.69 While, ethanol concentrations higher than 1.0 M, adsorption of ethanol on the catalyst reaches to the saturated state, leading to the reduction of the ethanol oxidation current. However, for Pd/C electrode, the peak current is enhanced with increasing the ethanol concentration. And it is worth mentioning that the peak current can not reach a maximum value when the concentration of ethanol reaches to 5.0 mol L−1, which is attributed to the intrinsic property of Pd in alkaline media, in agreement with the results by Zhao et al.68 The result indicates that the increase in the coverage of adsorbed ethoxi as the ethanol concentration increase yields an increase in the oxidation current of the EOR. The peak current densities of the catalysts via varying the scan rates were investigated 1.0 M KOH + 1.0 M CH3CH2OH (Fig. 8C). The oxidation peak current densities increase as the scan rate increased in alkaline media. The peak current densities are proportional to the square root of the scan rate (v1/2) during the whole process of electrooxidation of ethanol in alkaline media. The correlation coefficient of Pt/C, Pt73Pd27/C, Pt47Pd53/C, Pt23Pd77/C and Pd/C is 0.9905, 0.9993, 0.9925, 0.9778, 0.9902, respectively. Accordingly, the ethanol electrooxidation is dominated by the diffusion-controlled process in alkaline media.70
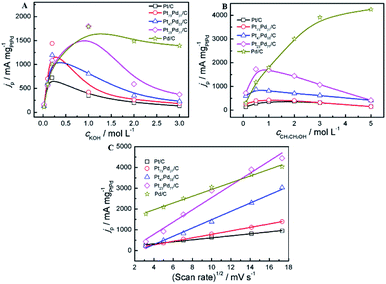 |
| | Fig. 8 Effect of the concentrations of KOH (A), CH3CH2OH (B) and the scan rates (C) on the peak current density in alkaline media, respectively. Catalysts: Pt/C, Pt73Pd27/C, Pt47Pd53/C, Pt23Pd77/C and Pd/C. | |
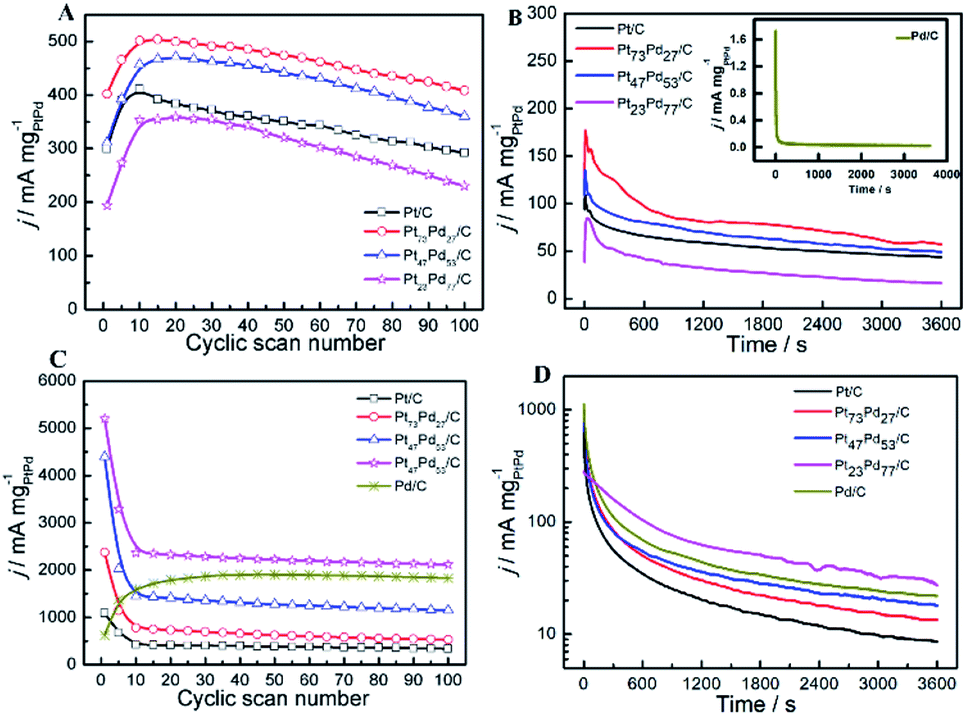
3.5.3 Stability of catalyst. As the long-term stability of catalyst has been recognized as another important factor for fuel cells,71,72 we also evaluated the long-term stability of as-prepared catalysts through repeated CV scan for 100 cycles and CA for 3600 s in both acid and alkaline solution. Fig. 9A and C exhibits the forward oxidation peak (Pf1) current density for ethanol electro-oxidation as a function of cyclic scan number in acid and alkaline media, respectively. In acid media, the peak current density on Pt73Pd27/C and Pt47Pd53/C is about 19.4% and 13.2% higher than pure Pt/C at the 10th cycle, respectively. In contrast, the lower peak current density was observed on Pt23Pd77/C compared to Pt/C. A similar phenomenon has been observed by Wang et al.73 and Zhang et al.74 on Pd@Pt for ethanol electro-oxidation. For the enhancement of peak current density, it is directly related to the electronic structure of PtPd alloy.75 Pd as an oxyphilic metal in Pt1−xPdx alloy accelerates the oxidative removal of COads species by the addition of a large number of active oxygen-containing species (such as PdO/PdOx), but too low a Pt atom content decreases the probability of finding the neighboring Pt atoms for ethanol chemisorption and hinders ethanol oxidation.74,75 Also, it can be seen that the electrocatalytic activity suffers from the loss in the order of Pt73Pd27/C (18.6%) < Pt47Pd53/C (21.4%) < Pt/C (28.9%) < Pt23Pd77/C (34.8%). While in alkaline solution, it should be noted that the oxidation peak current density for the first cycle on Pt73Pd27/C is about five and eight times higher than that on pure Pt/C and Pd/C catalysts, respectively (Fig. 9C). During the first 10 cycles, the oxidation peak current density drastically decreases on pure Pt/C and Pt1−xPdx/C catalysts due to the accumulations of poisonous carbonaceous species.46 Contrastingly, the peak current density of pure Pd/C catalyst shows a rapid increase in the first 20 cycles and then decreases gradually with successive scans. The Pt23Pd77/C catalyst exhibits the highest oxidation peak current density with a higher jf/jb value of 0.938 during the whole process. After 100 cycles, the oxidation peak current density of Pt23Pd77/C catalyst retains ca. 40.7% relative to the maximum value of 5238.94 mA mg−1. However, the values for the current density of the Pt47Pd53/C, Pt73Pd27/C and Pt/C catalysts are 26.85%, 22.06%, and 31.52%, respectively.
 |
| | Fig. 9 Long-term electrocatalytic stability referring to jf over 100 cycles on Pt/C, Pt73Pd27/C, Pt47Pd53/C, Pt23Pd77/C and Pd/C catalysts in acid (A) and alkaline (C) solutions, respectively, scan rate: 50 mV s−1; chronoamperometric curves of different catalysts at the potential of 0.5 V or −0.5 V in acid (B) and alkaline media (D). Solution: 0.5 M H2SO4 + 1.0 M CH3CH2OH (A and B); 1.0 M KOH + 1.0 M CH3CH2OH (C and D). | |
Fig. 9B shows chronoamperometric experiments at a fixed potential of 0.5 V to further determine the stability of as-prepared catalysts. A decay of current density normalized by the mass of Pt1−xPdx can be observed at the CA curves for all the catalysts, indicating that the catalyst surface is prone to poisoning by an accumulation of ethanolic residues.76 At 3600 s, the electrocatalytic activity is the highest on Pt73Pd27/C, followed by Pt47Pd53/C, Pt/C, Pt23Pd77/C and Pd/C catalysts. The result is consistent with the repeated CV scan mentioned above, further confirming that the Pt73Pd27/C catalyst has a better long-term stability than others in acidic media. From the zoomed curve of Pd/C (inset in the Fig. 9B), it further indicates that Pd/C catalysts shows no obvious catalytic performance in acid medium. Furthermore, the electrochemical stability of as-prepared catalysts for EOR was investigated by CA at −0.5 V for 3600 s in alkaline medium, and the typical results are shown in Fig. 9D. The polarization current density for EOR shows a rapid decay on Pt1−xPdx/C catalysts in the first 300 s. The decline of the peak density is attributed to the charging current or the catalyst poisoning during the process of the EOR. Also, the final current density indicates a decreasing electrocatalytic stability for EOR on as-prepared catalysts following in the order of Pt23Pd77/C > Pd/C > Pt47Pd53/C > Pt73Pd27/C > Pt/C, in consonance with the results of repeated CV scan. Nonetheless, it also means that the electrocatalytic activity of catalyst not only concerns the ECSA, but also more concerns the surface composition. Moreover, these results demonstrate that the Pt/Pd ratio in Pt1−xPdx/C alloy significantly affects the electrocatalytic activity and stability of Pt1−xPdx/C for EOR in alkaline media, which coincides well with the previous work.77
4. Conclusions
In summary, the Pt1−xPdx/C catalysts with different Pt/Pd ratios prepared by formic acidic as reducing agent have been investigated to compare the electrochemical performance of ethanol oxidation in acidic and alkaline solutions. The electrocatalytic activity toward ethanol oxidation on as-prepared catalysts were investigated by CV, LSV, and CA in both acidic and alkaline solutions. Compared with acidic media, Pt1−xPdx/C catalysts exhibit much higher electrocatalytic activity for alcohol oxidation in alkaline media, which is mainly attributed to the higher oxyphilic characteristics of Pd/C and the relatively inert nature of Pd/C on C–C bond cleavage. The ratio of Pt/Pd has a significant impact on the ethanol-oxidation in acidic and alkaline media. The Pt73Pd27/C and Pt23Pd77/C catalysts shows the highest electrocatalytic performance with a mass specific peak current of 2453.7 and 339.7 mA mgPtPd−1, respectively, and long-term stability in acidic and alkaline media. Moreover, the electrochemical performance of ethanol oxidation in both acidic and alkaline solutions is easily influenced by electrolyte and CH3CH2OH concentrations, scan rates.
Conflicts of interest
The authors declare that they have no known competing financial interests or personal relationships that could have appeared to influence the work reported in this paper.
Acknowledgements
This work was supported by the National Natural Science Foundation of China (Grant No. 51762018) and National Natural Science Foundation of China grant (No. 21603122).
Notes and references
- Q. Zhang, L. Jiang, H. Wang, J. Liu, J. Zhang, Y. Zheng, F. Li, C. Yao and S. Hou, ACS Sustain. Chem. Eng., 2018, 6, 7507–7514 CrossRef CAS.
- Q. Zhang, F. Zhang, X. Ma, Y. Zheng and S. Hou, J. Power Sources, 2016, 336, 1–7 CrossRef CAS.
- M. Mayilvel Dinesh, T. Huang, S. Yao, G. Sun and S. Mao, J. Power Sources, 2019, 410–411, 204–212 CrossRef CAS.
- S. Xiang, L. Wang, C. C. Huang, Y.-J. Fan, H.-G. Tang, L. Wei and S. G. Sun, J. Power Sources, 2018, 399, 422–428 CrossRef CAS.
- J. J. Fan, Y. J. Fan, R. X. Wang, S. Xiang, H. G. Tang and S. G. Sun, J. Mater. Chem. A, 2017, 5, 19467–19475 RSC.
- J. Zhong, L. Li, M. Waqas, X. Wang, Y. Fan, J. Qi, B. Yang, C. Rong, W. Chen and S. Sun, Electrochim. Acta, 2019, 322, 134677 CrossRef CAS.
- X. J. Zhang, J. M. Zhang, P. Y. Zhang, Y. Li, S. Xiang, H. G. Tang and Y. J. Fan, Mol. Catal., 2017, 436, 138–144 CrossRef CAS.
- C. Wang, L. Zhang, H. Yang, J. Pan, J. Liu, C. Dotse, Y. Luan, R. Gao, C. Lin, J. Zhang, J. P. Kilcrease, X. Wen, S. Zou and J. Fang, Nano Lett., 2017, 17, 2204–2210 CrossRef CAS PubMed.
- C. Wang, Y. Hou, J. Kim and S. Sun, Angew. Chem., Int. Ed., 2007, 46, 6333–6335 CrossRef CAS PubMed.
- L. Yu and J. Xi, Int. J. Hydrogen Energy, 2012, 37, 15938–15947 CrossRef CAS.
- L. Yu and J. Xi, Electrochim. Acta, 2012, 67, 166–171 CrossRef CAS.
- L. H. Jiang, G. Q. Sun, Z. Zhou, S. Sun, Q. Wang, S. Yan, H. Q. Li, J. Tian, J. S. Guo and Q. X. B. Zhou, J. Phys. Chem. B, 2005, 109, 8774–8778 CrossRef CAS PubMed.
- L. Cao, F. Scheiba, C. Roth, F. Schweiger, C. Cremers, U. Stimming, H. Fuess, L. Chen, W. Zhu and X. Qiu, Angew. Chem., Int. Ed., 2006, 45, 5315–5319 CrossRef CAS PubMed.
- D. Bin, B. Yang, F. Ren, K. Zhang, P. Yang and Y. Du, J. Mater. Chem. A, 2015, 3, 14001–14006 RSC.
- H. Xu, P. Song, C. Fernandez, J. Wang, M. Zhu, Y. Shiraishi and Y. Du, ACS Appl. Mater. Interfaces, 2018, 10, 12659–12665 CrossRef CAS PubMed.
- J. J. Lv, N. Wisitruangsakul, J. J. Feng, J. Luo, K. M. Fang and A. J. Wang, Electrochim. Acta, 2015, 160, 100–107 CrossRef CAS.
- W. Hou, X. Dong, Y. Li, H. Zhang, L. Xu, Y. Tian, A. Jiao and M. Chen, Mater. Chem. Phys., 2019, 221, 409–418 CrossRef CAS.
- Y. C. Shi, J. J. Feng, X. X. Lin, L. Zhang, J. Yuan, Q. L. Zhang and A. J. Wang, Electrochim. Acta, 2019, 293, 504–513 CrossRef CAS.
- X. Yang, Q. Yang, J. Xu and C.-S. Lee, J. Mater. Chem., 2012, 22, 8057 RSC.
- Y. Zheng, J. Qiao, J. Yuan, J. Shen, A.-j. Wang and S. Huang, Int. J. Hydrogen Energy, 2018, 43, 4902–4911 CrossRef CAS.
- Y. Pan, X. Guo, M. Li, Y. Liang, Y. Wu, Y. Wen and H. Yang, Electrochim. Acta, 2015, 159, 40–45 CrossRef CAS.
- K. Fu, Y. Wang, L. Mao, X. Yang, J. Jin, S. Yang and G. Li, Mater. Res. Bull., 2018, 108, 187–194 CrossRef CAS.
- J. P. Zhong, C. Hou, L. Li, M. Waqas, Y. J. Fan, X. C. Shen, W. Chen, L. Y. Wan, H. G. Liao and S. G. Sun, J. Catal., 2020, 381, 275–284 CrossRef CAS.
- H. V. Hien, T. D. Thanh, N. D. Chuong, D. Hui, N. H. Kim and J. H. Lee, Composites, Part B, 2018, 143, 96–104 CrossRef CAS.
- Y. Liu, L. Wei, Y. Hu, X. Huang, J. Wang, J. Li, X. Hu and N. Zhuang, J. Alloys Compd., 2016, 656, 452–457 CrossRef CAS.
- Q. Lu, H. Wang, K. Eid, Z. A. Alothman, V. Malgras, Y. Yamauchi and L. Wang, Chem.–Asian J., 2016, 11, 1939–1944 CrossRef CAS PubMed.
- F. Alcaide, G. Álvarez, P. L. Cabot, H.-J. Grande, O. Miguel and A. Querejeta, Int. J. Hydrogen Energy, 2011, 36, 4432–4439 CrossRef CAS.
- C. Xu, P. k. Shen and Y. Liu, J. Power Sources, 2007, 164, 527–531 CrossRef CAS.
- C. Xu, L. Cheng, P. Shen and Y. Liu, Electrochem. Commun., 2007, 9, 997–1001 CrossRef CAS.
- L. L. Carvalho, A. A. Tanaka and F. Colmati, J. Solid State Electrochem., 2017, 22, 1471–1481 CrossRef.
- M. J. Lázaroa, V. Celorrioa, L. Calvilloa, E. Pastorb and R. Moliner, J. Power Sources, 2011, 196, 4236–4241 CrossRef.
- F. Ren, H. Wang, C. Zhai, M. Zhu, R. Yue, Y. Du, P. Yang, J. Xu and W. Lu, ACS Appl. Mater. Interfaces, 2014, 6, 3607–3614 CrossRef CAS PubMed.
- E. Antolini, Energy Environ. Sci., 2009, 2, 915–931 RSC.
- W. He, J. Liu, Y. Qiao, Z. Zou, X. Zhang, D. L. Akins and H. Yang, J. Power Sources, 2010, 195, 1046–1050 CrossRef CAS.
- C. Wang, F. Jiang, R. Yue, H. Wang and Y. Du, J. Solid State Electrochem., 2013, 18, 515–522 CrossRef.
- H. Li, G. Sun, N. Li, S. Sun, D. Su and Q. Xin, J. Phys. Chem. C, 2007, 111, 5605–5617 CrossRef CAS.
- G. Yang, Y. Zhou, H. B. Pan, C. Zhu, S. Fu, C. M. Wai, D. Du, J. J. Zhu and Y. Lin, Ultrason. Sonochem., 2016, 28, 192–198 CrossRef CAS PubMed.
- H. Li, G. Sun, Q. Jiang, M. Zhu, S. Sun and Q. Xin, Electrochem. Commun., 2007, 9, 1410–1415 CrossRef CAS.
- M. Zhu, C. Zhai, M. Sun, Y. Hu, B. Yan and Y. Du, Appl. Catal., B, 2017, 203, 108–115 CrossRef CAS.
- H. Xu, B. Yan, K. Zhang, J. Wang, S. Li, C. Wang, Y. Du, P. Yang, S. Jiang and S. Song, Appl. Surf. Sci., 2017, 416, 191–199 CrossRef CAS.
- O. Winjobi, Z. Zhang, C. Liang and W. Li, Electrochim. Acta, 2010, 55, 4217–4221 CrossRef CAS.
- X. Wang, F. Zhu, Y. He, M. Wang, Z. Zhang, Z. Ma and R. Li, J. Colloid Interface Sci., 2016, 468, 200–210 CrossRef CAS PubMed.
- W. Wang, Q. Huang, J. Liu, Z. Zou, M. Zhao, W. Vogel and H. Yang, J. Catal., 2009, 266, 156–163 CrossRef CAS.
- Q. Zhang, F. Yue, L. Xu, C. Yao, R. D. Priestley and S. Hou, Appl. Catal., B, 2019, 257, 117886 CrossRef CAS.
- S. Wang, F. Yang, S. P. Jiang, S. Chen and X. Wang, Electrochem. Commun., 2010, 12, 1646–1649 CrossRef CAS.
- H. Gao, S. Liao, Z. Liang, H. Liang and F. Luo, J. Power Sources, 2011, 196, 6138–6143 CrossRef CAS.
- Y. N. Wu, S. J. Liaoa, Y. L. Su, J. H. Zeng and D. Danga, J. Power Sources, 2010, 195, 6459–6462 CrossRef CAS.
- W. Ye, H. Kou, Q. Liu, J. Yan, F. Zhou and C. Wang, Int. J. Hydrogen Energy, 2012, 37, 4088–4097 CrossRef CAS.
- L. Ma, D. Chu and R. Chen, Int. J. Hydrogen Energy, 2012, 37, 11185–11194 CrossRef CAS.
- J. Seweryn and A. Lewera, J. Power Sources, 2012, 205, 264–271 CrossRef CAS.
- L. A. Kibler, A. M. El-Aziz, R. Hoyer and D. M. Kolb, Angew. Chem., Int. Ed., 2005, 44, 2080–2084 CrossRef CAS PubMed.
- L. D. Burke and J. K. Casey, J. Electrochem. Soc., 1993, 140, 1292–1298 CrossRef CAS.
- M. Łukaszewski, K. Hubkowska and A. Czerwiński, J. Electroanal. Chem., 2011, 651, 131–142 CrossRef.
- M. Łukaszewski, K. Hubkowska and A. Czerwiński, Phys. Chem. Chem. Phys., 2010, 12, 14567–14572 RSC.
- F. Zhu, G. Ma, Z. Bai, R. Hang, B. Tang, Z. Zhang and X. Wang, J. Power Sources, 2013, 242, 610–620 CrossRef CAS.
- C. Yao, Q. Zhang, Y. Su, L. Xu, H. Wang, J. Liu and S. Hou, ACS Appl. Nano Mater., 2019, 2, 1898–1908 CrossRef CAS.
- M. A. F. Akhairi and S. K. Kamarudin, Int. J. Hydrogen Energy, 2016, 41, 4214–4228 CrossRef CAS.
- S. Y. Shen, T. S. Zhao and Q. X. Wu, Int. J. Hydrogen Energy, 2012, 37, 575–582 CrossRef CAS.
- H. Hitmi, E. M. Belgsir, J.-M. Léger, C. Lamy and R. O. Lezna, Electrochim. Acta, 1994, 39, 407–415 CrossRef CAS.
- N. Fujiwara, K. A. Friedrich and U. Stimming, J. Electroanal. Chem., 1999, 472, 120–125 CrossRef CAS.
- D. J. Guo, X. P. Qiu, L. Q. Chen and W. T. Zhu, Carbon, 2009, 47, 1680–1685 CrossRef CAS.
- T. Lopes, E. Antolini and E. Gonzalez, Int. J. Hydrogen Energy, 2008, 33, 5563–5570 CrossRef CAS.
- E. Antolini and E. R. Gonzalez, J. Power Sources, 2010, 195, 3431–3450 CrossRef CAS.
- H. A. Gasteiger, N. Marković, P. N. R. Jr and E. J. Cairns, Electrochim. Acta, 1994, 39, 1825–1832 CrossRef CAS.
- A. De, J. Datta, I. Haldar and M. Biswas, ACS Appl. Mater. Interfaces, 2016, 8, 28574–28584 CrossRef CAS.
- C. W. Xu, H. Wang, P. K. Shen and S. P. Jiang, Adv. Mater., 2007, 19, 4256–4259 CrossRef CAS.
- W. Zhou, C. Zhai, Y. Du, J. Xu and P. Yang, Int. J. Hydrogen Energy, 2009, 34, 9316–9323 CrossRef CAS.
- Z. X. Liang, T. S. Zhao, J. B. Xu and L. D. Zhu, Electrochim. Acta, 2009, 54, 2203–2208 CrossRef CAS.
- Q. Yi, F. Niu and L. Sun, Fuel, 2011, 90, 2617–2623 CrossRef CAS.
- G. Karim-Nezhad and P. Seyed Dorraji, Electrochim. Acta, 2010, 55, 3414–3420 CrossRef CAS.
- Z. Chen, M. Waje, W. Li and Y. Yan, Angew. Chem., Int. Ed., 2007, 46, 4060–4063 CrossRef CAS.
- Z. Wen, J. Liu and J. Li, Adv. Mater., 2008, 20, 743–747 CrossRef CAS.
- H. Wang, C. Xu, F. Cheng, M. Zhang, S. Wang and S. Jiang, Electrochem. Commun., 2008, 10, 1575–1578 CrossRef CAS.
- H. Zhang, Y. Yin, Y. Hu, C. Li, P. Wu, S. Wei and C. Cai, J. Phys. Chem. C, 2010, 114, 11861–11867 CrossRef CAS.
- N. V. Long, T. Duy Hien, T. Asaka, M. Ohtaki and M. Nogami, Int. J. Hydrogen Energy, 2011, 36, 8478–8491 CrossRef.
- J. Datta, A. Dutta and S. Mukherjee, J. Phys. Chem. C, 2011, 115, 15324–15334 CrossRef CAS.
- S. C. Lin, J. Y. Chen, Y. F. Hsieh and P. W. Wu, Mater. Lett., 2011, 65, 215–218 CrossRef CAS.
Footnote |
| † Electronic supplementary information (ESI) available. See DOI: 10.1039/d0ra00483a |
|
| This journal is © The Royal Society of Chemistry 2020 |
Click here to see how this site uses Cookies. View our privacy policy here. 
 Open Access Article
 This Open Access Article is licensed under a Creative Commons Attribution-Non Commercial 3.0 Unported Licence
 *c
*c