 Open Access Article
N/S co-doped coal-based porous carbon spheres as electrode materials for high performance supercapacitors†
Yan Lv,
Jingjing Chen,
Wei Jia,
Xueyan Wu,
Jixi Guo *,
Lili Ding,
Dianzeng Jia
 * and
Fenglian Tong
Key Laboratory of Energy Materials Chemistry, Ministry of Education, Key Laboratory of Advanced Functional Materials, Autonomous Region, Institute of Applied Chemistry, Xinjiang University Urumqi, China. E-mail: jxguo1012@163.com; jdz@xju.edu.cn
First published on 17th March 2020
Abstract
N/S co-doped porous carbon spheres (NSPCSs) were prepared by a simple ultrasonic spray pyrolysis (USP) using the mixed solution of coal oxide and L-cysteine, and without a subsequent activation process. The surface properties of carbon materials have been successfully modified by the concurrent incorporation of N and S. So the capacitive performance of NSPCSs was greatly enhanced. It is used as a supercapacitor electrode to achieve a high specific capacitance of 308 F g−1 at a current density of 1 A g−1 and 90.2% capacitance retention even after 10![[thin space (1/6-em)]](https://www.rsc.org/images/entities/char_2009.gif) 000 cycles at 5 A g−1. These numerical results show that the supercapacitors based on coal-based carbon materials have great potential in high performance electrochemical energy storage.
000 cycles at 5 A g−1. These numerical results show that the supercapacitors based on coal-based carbon materials have great potential in high performance electrochemical energy storage.
1. Introduction
Carbon-based materials have attracted wide publicity as electrode materials for supercapacitors (SCs), principally owing to their outstanding characteristics such as large specific surface area (SSA), excellent chemical stability, good electrical conductivity, and low cost.1 Pure carbon materials are the main electrode materials for electrical double layer capacitors (EDLCs), the storage of electric energy is based on the separation of charged substances in the electrolytic bilayer at the electrode/solution interface.2 Regrettably, most EDLCs with carbon materials as electrodes still have relatively low specific capacitance, which leads to low energy density of the EDLCs.3,4 Consequently, development of high performance carbon electrodes is the key to the application of supercapacitors. The latest development demonstrated that substitution doping of heteroatoms for carbon materials could greatly change the conductivity, surface activity and chemical reactivity, which is critical for energy storage applications.5 The specific capacitance of carbon materials is improved by reversible pseudocapacitive reaction with electrolyte.6 In previous literature, nitrogen doping of carbon materials has been studied in depth. In addition, compared with unitary doping, multiple heteroatoms doping can further improve the electrochemical properties of carbon materials due to the synergetic effect.7,8 For instance, nitrogen doping can improve specific capacitance by adjusting the electronic properties of carbon materials and participating reversible Faraday process as well as enhance the wettability of electrode materials by introducing hydrophilic groups.9,10 Whereas sulfur-doping is easy to polarize because of lone pair of electrons, which providing more charge transfer, resulting in high chemical reactivity of the carbon materials.11–13 Very recently, multi-heteroatom species doping (e.g., B/N, N/P, S/P, N/S) has been demonstrate to be one of the effective ways to improve the electrochemical properties of porous carbon.14–20 The precursors of N/S co-doped porous carbon materials include thiourea,21 chitosan and methanesulfonic acid,22 protic ionic liquid,23 pyrrole and sulfuric acid etc.24 The N/S co-doped processes can be actualized in a variety of methods, such as microwave-hydrothermal method,25 electron-beam irradiation method,26 thermal annealing method,27 hydrothermal method,28 freeze-drying method and so on.22 Even so, we need to make greater efforts to simplify the doping process to make them practicable, and most of the precursors are expensive. How to prepare doped porous carbon materials from green, cheap and abundant carbon sources has become a hot issue. Compared to other carbon sources, such as graphite,29 sucrose,30 glucose,25 coal is low-priced and abundant in natural resources. The application of coal as a carbon source material began in the early 90s. Since then, coal-based carbon functional materials have been widely studied and applied.31,32 Over the past years, our group has prepared various carbon materials from coal, such as activated carbon,33 carbon nanotubes,34 carbon fibers35 and carbon spheres.36In this work, we synthesized N/S co-doped porous carbon spheres (NSPCSs) as a supercapacitor electrode. L-Cysteine was used as environment-friendly nitrogen source and sulfur source, and coal was used as carbon source to synthesize N/S co-doped porous carbon spheres (NSPCSs) by a simple ultrasonic spray pyrolysis method without subsequent activation process. The performance of NSPCSs as a EDLCs electrode in 6.0 M KOH solution was evaluated, and its remarkable capacitance performance has been proved.
2. Experiment
2.1 Materials
Coal was produced in Heishan, Xinjiang, China. H2SO4 (98%), HNO3 (63%), KOH and L-cysteine were analytical grade and could be used without subsequent treatment.2.2 Synthesis of materials
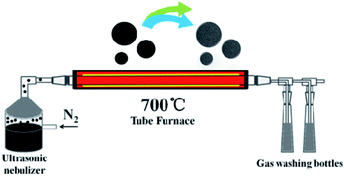
An improved method was used to prepared oxidized coal.31,37 Sieved pulverized coal is oxidized by concentrated nitric acid and concentrated sulfuric acid, and the oxidized coal can be dissolved in deionized water. In a typical experiment, the coal oxide (0.9 g) and L-cysteine (0.3 g) were added into 90 mL distilled water followed by the vigorous stirring and then the solution was neutralized with KOH. The spray precursor solution was prepared with different coal oxide/L-cysteine mass ratios of 1/1, 3/1 and 5/1. The resulting materials are denoted as NSPCSs-1, NSPCSs-3, NSPCSs-5, respectively. A simple ultrasonic spray pyrolysis method was used to prepare NSPCSs from the mixed aqueous solution of precursors at 700 °C. The ultrasonic spray pyrolysis system consists of a nano-micro mist generator, a quartz tube reactor and a powder collector. A large number of droplets were generated by the 2 MHz ultrasonic spray generator. A quartz tube reactor with a length of 120 cm (total heated region ∼60 cm) and a diameter of 5 cm was used, the pyrolysis of the nebulized mist was conducted in a nitrogen gas flow (0.9 SLPM) (the USP apparatus is schematically shown in Scheme 1). Droplets were evaporated and decomposed in a quartz tube reactor, and the black powders were collected in a deionized water bubbler. Finally, NSPCSs was collected through filtration, washed many times with a large amount of distilled water, and then dried at 80 °C overnight. For comparison, the pristine porous carbon spheres (PCSs) were obtained without the use of L-cysteine following the same experiment procedure.2.3 Structural characterization
Microscopic morphology of materials was observed by scanning electron microscope (SEM, Hitachi SU-4800, Japan) and transmission electron microscope (TEM, JEM2100F, JEOL, Japan). Surface chemical properties were determined by energy dispersive spectroscopy (EDS), and X-ray Photoelectron Spectroscopy (XPS, Escalab 250, USA). The structural information of samples was investigated by Powder X-ray diffraction (XRD, Bruker D8, using filtered Cu Kα radiation) and Raman spectra (Raman; Bruker Senterra R200-L spectrometer, 532 nm). The specific surface area and pore size of the NSPCSs were measured with a Micromeritics ASAP 2020 surface area and porosity analyzer.2.4 Electrochemical characterization
The electrochemical properties of the electrode materials were investigated in 6.0 M KOH aqueous solution using the three-electrode system and two-electrode system under ambient conditions. The working electrode was prepared by mixing 85 wt% porous carbon materials, 10 wt% acetylene black and 5 wt% polytetrafluoroethylene (PTFE) in ethanol to obtain a slurry, pressing the mixture onto nickel foam current collectors (1.5 cm × 1.5 cm) with a spatula. The working electrode was obtained by drying the electrode material at 80 °C for 12 hours. The active material loaded on each electrode has a mass of 2.0 mg. Supercapacitor measurements were conducted using an electrochemical workstation (CHI 660D). The life cycle performance of the electrode was tested on a Land battery measurement system (Rambo Testing Equipment Co., Ltd. Wuhan). For the three-electrode system, platinum slice and saturated calomel electrode (SCE) were used as counter electrode and the reference electrode, respectively. The voltage range for cyclic voltammetry (CV) and galvanostatic charge/discharge (GCD) measurements were set as −1 to −0.1 V. The specific capacitance was calculated by using the formula: C = IΔt/(mΔV), where C (F g−1) is the specific capacitance, I (A) is discharge current, m (g) is the mass of the active material, ΔV (V) is the potential window during the discharge, and Δt (s) is the discharge time. For a two-electrode system, N/S co-doped porous carbon spheres NSPCSs-3 was packaged as symmetric devices with two same electrodes, and electrochemical tests were carried out in 6 M KOH. The voltage range for CV and GCD measurements were set as −1 to −0.1 V. The capacitance can be calculated by the formula: C = 2IΔt/(mΔV), where I, Δt, m and ΔV, represented the applied current, discharge time, mass of the single electrode, the potential window.3. Results and discussion
Fig. 1a and S1† are the SEM images of the as-prepared NSPCSs. NSPCSs show an excellent dispersity with a diameter ranging from 50 nm to 1000 nm. The surfaces microcosmic structure of the PCSs, NSPCSs-1, NSPCSs-3 and NSPCSs-5 exhibit a regular and smooth surface. The TEM images of the NSPCSs-3 are shown in Fig. 1b. The well-defined NSPCSs-3 shows smooth surfaces and a nonporous structure. Fig. 1c shows the EDX element mapping image of the NSPCSs-3, where the C, N, O and S elements are evenly distributed at the surface of NSPCSs-3.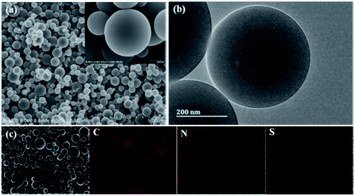 | ||
| Fig. 1 Morphology and elemental distribution of NSPCSs-3. (a) SEM image of the NSPCSs-3, (b) TEM image of the NSPCSs-3, (c) Element mapping of the NSPCSs-3. | ||
Fig. 2a show XRD patterns of samples. It can be seen that they are very similar. Two intense and broad diffraction peaks corresponding to the (002) and (100) diffraction patterns of amorphous carbon structure are appeared at approximately 23° and 42° of all samples, respectively. Fig. 2b displays Raman D peak and G peak representing disordered carbon and graphitic carbon, respectively. The intensity ratio of the D peak to the G peak, i.e., R (ID/IG), indicates the degree of disorder of carbon materials. The ID/IG of them is 0.90, 0.91, 0.93 and 0.87, respectively. The highest ID/IG value for NSPCSs-3 is possibly related to its rational nitrogen/sulfur doped degree. Fig. 2c is the BET isotherm of the samples, the samples exhibit the combined type I/IV adsorption–desorption isotherms according to the international union of pure and applied chemistry (IUPAC) specific surface area and pore structure parameters of the samples. The data of SBET and pore distribution of samples are shown in Table 1. The difference between them is not significant, indicating that the ratio of precursors has little effect on the surface area and pore structure.
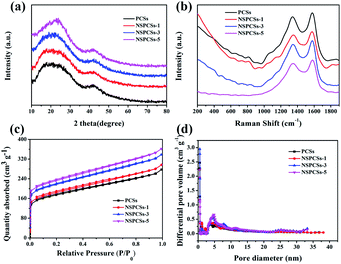 | ||
| Fig. 2 (a) X-ray diffraction patterns, (b) Raman spectrums of the samples, (c) nitrogen adsorption–desorption isotherm, and (d) pore diameter distribution curves. | ||
| Samples | SBETa (m2 g−1) | Vtotalb (cm3 g−1) | Vmicc (cm3 g−1) | Vmesod (cm3 g−1) |
|---|---|---|---|---|
| a SBET: specific surface area.b Vtotal: total pore volume measured at P/P0 = 0.99.c Vmic: micropore volume.d Vmeso: volume of mesopore. | ||||
| PCSs | 589.36 | 0.38 | 0.24 | 0.14 |
| NSPCSs-1 | 633.07 | 0.43 | 0.32 | 0.11 |
| NSPCSs-3 | 635.50 | 0.43 | 0.26 | 0.17 |
| NSPCSs-5 | 613.23 | 0.42 | 0.26 | 0.16 |
The surface chemical properties of the NSPCSs-3 were assessed by X-ray photoelectron spectroscopy (XPS). Fig. 3a shows the survey XPS spectrum reveals the presence of C, N, S, and O elements in NSPCSs-3. On the base of C-species, Fig. 3b shows the C 1s peaks at 284.78 eV (C–C/C![[double bond, length as m-dash]](https://www.rsc.org/images/entities/char_e001.gif) C), 286.28 eV (C–O) and 287.58 eV (C
C), 286.28 eV (C–O) and 287.58 eV (C![[double bond, length as m-dash]](https://www.rsc.org/images/entities/char_e001.gif) O) and 289.08 eV (O
O) and 289.08 eV (O![[double bond, length as m-dash]](https://www.rsc.org/images/entities/char_e001.gif) C–O).38,39 Fig. 3c shows the high-resolution spectrum of N 1s spectra of materials shows that there are different types of nitrogen bonding states, of which the deconvolution peak at 398.58, 400.48 and 402.48 eV is ascribed to pyridinic-N, pyrrolic-N, and graphitic-N, respectively.21,22,40,41 As is known to all, pyridinic-N and pyrrolic-N exist at the edge of carbon materials and produce certain defects on the surface of carbon materials. They also contain redox electron pairs, participate in the constant current charging and discharging process, and contribute to a certain pseudocapacitance. Moreover, the doping of nitrogen atoms is beneficial to improving the surface wettability and conductivity of carbon materials, thereby improving the capacitance characteristics of materials.42,43 Graphdinic-N provide an additional electron for the carbon skeleton, which reduces the energy barrier of electron transfer, thus improving the conductivity of the sample, thereby affecting the cyclic stability of the supercapacitor. In the case of S-species, the S 2p peak (Fig. 3d) could be fitted to four peaks centered at 163.7, 164.8, 167.7 and 168.8 eV, respectively. S 2p3/2 and S 2p1/2 in the C–S–C covalent bond of thiophene-like S should correspond to the former two peaks centered at lower binding energies, and the oxidized sulfur species in the C–SOx–C (x = 2–4) bond (sulfone bonds) should be in accordance with the other two peaks.20,22,43 Pseudo-capacitance of carbon materials produced by redox reaction related to sulfones and sulfoxides during charging and discharging.44–46 Table 2 shows the quantitative XPS data of all samples. The C and O elements in the material are mainly from oxidized coal. The content ration of C/O is 4.0, 6.3, 6.8, 6.6 for PCSs, NSPCSs-1, NSPCSs-3, NSPCSs-5, respectively. Obviously, the value of C/O of NSPCSs increases compared with PCSs, which maybe attribute to two aspects. For one thing, and for the main reason, L-cysteine interconnects small pieces of oxidized coal that would otherwise decompose at high temperatures, thus increasing the carbon content of the product. For another thing, the addition of L-cysteine also increases the carbon content. In addition, with the obviously increasing content of L-cysteine in the initial reactant, the contents of N/S in the resultant samples just show slight fluctuation. This is may be due to that heteroatoms are typically incorporated at defect and edge sites in carbon materials, but oxides species like –NOx and –SOx at edge sites are not thermally stable and can be removed during the pyrolysis process.9
C–O).38,39 Fig. 3c shows the high-resolution spectrum of N 1s spectra of materials shows that there are different types of nitrogen bonding states, of which the deconvolution peak at 398.58, 400.48 and 402.48 eV is ascribed to pyridinic-N, pyrrolic-N, and graphitic-N, respectively.21,22,40,41 As is known to all, pyridinic-N and pyrrolic-N exist at the edge of carbon materials and produce certain defects on the surface of carbon materials. They also contain redox electron pairs, participate in the constant current charging and discharging process, and contribute to a certain pseudocapacitance. Moreover, the doping of nitrogen atoms is beneficial to improving the surface wettability and conductivity of carbon materials, thereby improving the capacitance characteristics of materials.42,43 Graphdinic-N provide an additional electron for the carbon skeleton, which reduces the energy barrier of electron transfer, thus improving the conductivity of the sample, thereby affecting the cyclic stability of the supercapacitor. In the case of S-species, the S 2p peak (Fig. 3d) could be fitted to four peaks centered at 163.7, 164.8, 167.7 and 168.8 eV, respectively. S 2p3/2 and S 2p1/2 in the C–S–C covalent bond of thiophene-like S should correspond to the former two peaks centered at lower binding energies, and the oxidized sulfur species in the C–SOx–C (x = 2–4) bond (sulfone bonds) should be in accordance with the other two peaks.20,22,43 Pseudo-capacitance of carbon materials produced by redox reaction related to sulfones and sulfoxides during charging and discharging.44–46 Table 2 shows the quantitative XPS data of all samples. The C and O elements in the material are mainly from oxidized coal. The content ration of C/O is 4.0, 6.3, 6.8, 6.6 for PCSs, NSPCSs-1, NSPCSs-3, NSPCSs-5, respectively. Obviously, the value of C/O of NSPCSs increases compared with PCSs, which maybe attribute to two aspects. For one thing, and for the main reason, L-cysteine interconnects small pieces of oxidized coal that would otherwise decompose at high temperatures, thus increasing the carbon content of the product. For another thing, the addition of L-cysteine also increases the carbon content. In addition, with the obviously increasing content of L-cysteine in the initial reactant, the contents of N/S in the resultant samples just show slight fluctuation. This is may be due to that heteroatoms are typically incorporated at defect and edge sites in carbon materials, but oxides species like –NOx and –SOx at edge sites are not thermally stable and can be removed during the pyrolysis process.9
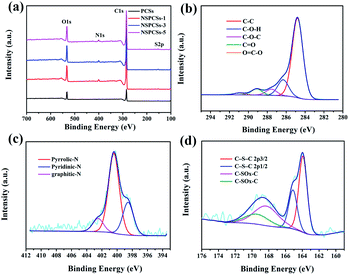 | ||
| Fig. 3 (a) XPS survey spectrum of samples, high-resolution (b) C 1s spectrum, (c) N 1s spectrum, and (d) S 2p spectrum of the NSPCSs-3. | ||
| Samples | C (at%) | N (at%) | O (at%) | S (at%) |
|---|---|---|---|---|
| PCSs | 78.52 | 1.44 | 19.49 | 0.55 |
| NSPCSs-1 | 84.15 | 2.57 | 13.05 | 0.23 |
| NSPCSs-3 | 84.62 | 2.18 | 12.43 | 0.77 |
| NSPCSs-5 | 84.23 | 2.42 | 12.69 | 0.66 |
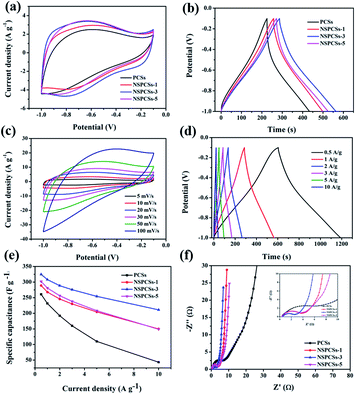
The CV curves of samples at a scanning rate of 10 mV s−1 in the three-electrode system are shown in Fig. 4a. All the curves exhibit a slightly distorted rectangular shape, indicating the pseudocapacitance characteristics. The specific capacitances of these electrodes integrated from the CV curves reduce in the following order: NSPCSs-3 > NSPCSs-5 > NSPCSs-1 > PCSs. As everyone knows, the integral area of the CV curve is proportional to the specific capacitance at the same scanning rate. Although all samples show high N and S doping levels, the excellent capacitance performance of NSPCSs-3 can be explained by its optimum heteroatom doping level compared with other samples. Fig. 4b shows the GCD curves of all samples at the specific current of 1 A g−1, which demonstrates a slightly twisted triangle. This shows that the electric double layer capacitor is dominant in the energy storage mechanism, and the contribution of pseudo-capacitance is relatively few, which is consistent with the CV result. Fig. S2,† 4c and d show the GCD curves at current densities in the range of 0.5–10 A g−1 and CV curves at different scan rates in the range of 5–100 mV s−1 for the samples. The correlation between specific capacitance and scan rate is shown in Fig. 4e. The values of specific capacitance of NSPCSs-3 were recorded as high as 308 F g−1 at current densities of 1 A g−1, and the current density is 10 A g−1, the values of specific capacitance of NSPCSs-3 remains 211 F g−1, which is superior to some previously reported coal-based carbon materials and N/S-doped carbon materials (Table S1†). In addition, the high rate retention of about 80% from 1 A g−1 to 10 A g−1 have also been demonstrated, NSPCSs-3 performs best in all tested samples. Nyquist plots of NSPCSs-3 are shown in Fig. 4f. All the samples demonstrate similar Nyquist plots. Comparatively speaking, NSPCSs-3 has a relatively small radius of the semicircle in the high frequency region, which shows that it has slope of NSPCSs-3 is the largest, which confirms that the lower charge transfer resistance between electrolyte and electrode. Besides, in the low frequency region, the linear diffusion-controlled mass transfer resistance is low, and is conducive to improving the rate capability. Fig. S3a† shows the rectangular-like CV curves of NSPCSs-3 at a scanning rate from 5 to 50 mV s−1 in the two-electrode system. At different scanning rates, the CV curves of NSPCSs-3 showed slightly deformed rectangle, revealing the pseudocapacitance characteristics. Fig. S3b† shows the GCD curves of potential ranges from 0 V to 1 V at current densities of 0.2 A g−1 to 5 A g−1. The specific capacitance of NSPCSs-3 is 254 F g−1 at 0.2 A g−1, and the specific capacitance still retained 158 F g−1 at 5 A g−1, demonstrating its outstanding rate capability.
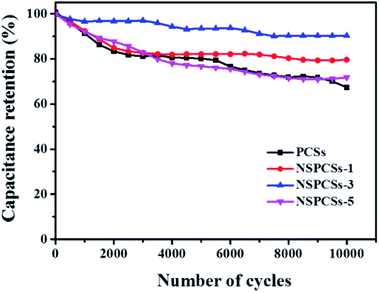
Additionally, a long life is an important parameter for the practical performance of electrode materials for supercapacitors. Fig. 5 showed cycling stability of the samples, after 10![[thin space (1/6-em)]](https://www.rsc.org/images/entities/char_2009.gif) 000 cycles at the current density of 5 A g−1, the PCSs, NSPCSs-1, NSPCSs-3 and NSPCSs-5 remain 67.2%, 79.6%, 90.2% and 71.8% of the initial capacitance, respectively. The result demonstrates that the NSPCSs-3 electrode exhibited outstanding cycling performance.
000 cycles at the current density of 5 A g−1, the PCSs, NSPCSs-1, NSPCSs-3 and NSPCSs-5 remain 67.2%, 79.6%, 90.2% and 71.8% of the initial capacitance, respectively. The result demonstrates that the NSPCSs-3 electrode exhibited outstanding cycling performance.
4. Conclusions
In summary, we have developed a green, facile and efficient strategy to prepare N/S co-doped porous carbon spheres using the mixed solution of coal oxide and L-cysteine as precursor by a simple ultrasonic spray pyrolysis. To simplify the preparation process, design reasonable pore structure and control the elemental doping, the precursors were deliberately selected. The NSPCSs-3 exhibits high specific capacitance and excellent rate capability in 6.0 M KOH aqueous electrolyte (308 F g−1 at 1 A g−1, 211 F g−1 at 10 A g−1). Moreover, the homogeneous doping of N and S elements in carbon materials not only improves the hydrophilicity of carbon materials, but also provides more active sites, and contributes to the pseudocapacitance. This work provides a simple method for the low-cost green production of N/S co-doped porous carbon materials and a feasible method for future energy storage applications.Conflicts of interest
There are no conflicts of interest to declare.Acknowledgements
This work is supported by the National Natural Science Foundation of China (201972123, U1703251, and 21861037), Program for Tianshan Innovative Research Team of Xinjiang Uygur Autonomous Region (2018D14002), the Open Fund of the Key Laboratory of Xinjiang Uygur Autonomous Region (2017D040414), Scientific Research Program of the Higher Education Institution of Xinjiang (XJEDU2017A001).References
- Y. Zhai, Y. Dou, D. Zhao, P. F. Fulvio, R. T. Mayes and S. Dai, Adv. Mater., 2011, 23, 4828 CrossRef CAS PubMed.
- D. Qu and H. Shir, J. Power Sources, 1998, 74, 99 CrossRef CAS.
- T. Lin, L. W. Chen, F. Liu, C. Yang, H. Bi, F. Xu and F. Huang, Science, 2015, 350, 1508 CrossRef CAS PubMed.
- M. Q. Liu, S. L. Huo, M. Xu, L. L. Wu, M. J. Liu, Y. F. Xue and Y. M. Yan, Electrochim. Acta, 2018, 274, 389 CrossRef CAS.
- Y. J. Li, G. L. Wang, T. Wei, Z. J. Fan and P. Yan, Nano Energy, 2016, 19, 165 CrossRef CAS.
- R. S. Mehare, S. P. Ranganath, V. Chaturvedi, M. V. Badiger and M. V. Shelke, Energ. Fuel., 2018, 32, 908 CrossRef CAS.
- S. Y. Wang, E. Iyyamperumal, A. Roy, Y. H. Xue, D. S. Yu and L. M. Dai, Angew. Chem., Int. Ed., 2011, 50, 11756 CrossRef CAS PubMed.
- J. P. Paraknowitsch and A. Thomas, Energy Environ. Sci., 2013, 6, 2839 RSC.
- T. Wang, L. X. Wang, D. L. Wu, W. Xia and D. Z. Jia, Sci. Rep., 2015, 5, 9591 CrossRef CAS PubMed.
- B. L. Zhao, L. Z. Fan, M. Q. Zhou, H. Guan, S. Y. Zhou, R. Ma, S. L. Candelaria, J. C. Wang, Q. Liu, E. Uchaker, P. X. Li, Y. F. Chen and G. Z. Cao, J. Power Sources, 2016, 314, 39 CrossRef.
- Y. Zhou, R. Ma, S. L. Candelaria, J. C. Wang, Q. Liu, E. Uchaker, P. X. Li, Y. F. Chen and G. Z. Cao, J. Power Sources, 2016, 314, 39 CrossRef CAS.
- Y. Zhou, S. L. Candelaria, Q. Liu, E. Uchakerb and G. Z. Cao, Nano Energy, 2015, 12, 567 CrossRef CAS.
- G. Hasegawa, M. Aoki, K. Kanamori, K. Nakanishi, T. Hanada and K. Tadanaga, J. Mater. Chem., 2011, 21, 2060 RSC.
- W. W. Gao, X. Feng, T. Y. Zhang, H. Huang, J. Li and W. B. Song, ACS Appl. Mater. Interfaces, 2014, 6, 19109 CrossRef CAS PubMed.
- F. L. Qia, Z. X. Xia, W. Wei, H. Sun, S. L. Wang and G. Q. Sun, Electrochim. Acta, 2017, 246, 59 CrossRef.
- Z. Wang, Y. T. Tan, Y. Yang, X. Zhao, Y. Liu, L. Niu, B. Tichnell, L. Kong, L. Kang, Z. Liu and F. Ran, J. Power Sources, 2018, 378, 499 CrossRef CAS.
- D. Y. Zhang, Y. H. Zhang, Y. S. Luo, Y. Zhang, X. W. Li, X. L. Yu, H. Ding, P. K. Chu and L. Sun, Nano Res., 2018, 13, 1651 CrossRef.
- W. Ai, Z. M. Luo, J. Jiang, J. H. Zhu, Z. Z. Du, Z. X. Fan, L. H. Xie, H. Zhang, W. Huang and T. Yu, Adv. Mater., 2014, 26, 6186 CrossRef CAS PubMed.
- X. Yu, Y. B. Kang and H. S. Park, Carbon, 2016, 101, 49 CrossRef CAS.
- T. Panja, D. Bhattacharjya and J. S. Yu, J. Mater. Chem. A, 2015, 3, 18001 RSC.
- J. Liu, X. Y. Wang, Q. Lu, R. Z. Yu, M. F. Chen, S. Y. Cai and X. Y. Wang, J. Electrochem. Soc., 2016, 163, 2991 CrossRef.
- S. L. Huo, M. Q. Liu, L. L. Wu, M. J. Liu, M. Xu, W. Ni and Y. M. Yan, J. Power Sources, 2018, 387, 81 CrossRef CAS.
- L. Sun, H. Zhou, L. Li, Y. Yao, H. N. Qu, C. L. Zhang, S. H. Liu and Y. M. Zhou, ACS Appl. Mater. Interfaces, 2017, 9, 26088 CrossRef CAS PubMed.
- D. Y. Zhang, L. W. Zheng, Y. Ma, L. Y. Lei, Q. L. Li, Y. Li, H. M. Luo, H. X. Feng and Y. Hao, ACS Appl. Mater. Interfaces, 2014, 6, 2657 CrossRef CAS PubMed.
- H. M. Ji, T. Wang, Y. Liu, C. L. Lu, G. Yang, W. P. Ding and W. H. Hou, Chem. Commun., 2016, 52, 12725 RSC.
- L. L. Cheng, Y. Y. Hu, D. D. Qiao, Y. Zhu, H. Wang and Z. Jiao, Electrochim. Acta, 2018, 259, 587 CrossRef CAS.
- D. Y. Zhang, Y. Hao, L. W. Zheng, Y. Ma, H. X. Feng and H. M. Luo, J. Mater. Chem. A, 2013, 1, 7584 RSC.
- A. G. Kannan, A. Samuthirapandian and D. W. Kim, J. Power Sources, 2017, 337, 65 CrossRef CAS.
- W. Zhang, Z. Chen, X. Guo, K. Jin, Y. X. Wang, L. Li, Y. Zhang, Z. Wang, L. Sun and T. Zhang, Electrochim. Acta, 2018, 278, 51 CrossRef CAS.
- H. Kim, M. E. Fortunato, H. Xu, J. H. Bang and K. S. Suslick, J. Phys. Chem. C, 2011, 115, 20481 CrossRef CAS.
- S. K. L. Pan and M. A. Wilson, Nanotubes from coal, Energ. Fuel., 1993, 7, 436 CrossRef.
- J. S. Zhu, S. Q. Zhang and D. L. Wang, Ionics, 2017, 23, 1927 CrossRef CAS.
- L. X. Wang, R. Wang, H. Zhao, L. Liu and D. Jia, Mater. Lett., 2015, 149, 85 CrossRef CAS.
- J. Li, Y. Cao, L. Wang and D. Z. Jia, RSC Adv., 2017, 7, 34770 RSC.
- M. X. Guo, J. X. Guo, D. Z. Jia, H. Y. Zhao, Z. P. Sun, X. L. Song and Y. H. Li, J. Mater. Chem. A, 2015, 3, 21178 RSC.
- J. Li, Y. L. Cao, L. X. Wang and D. Z. Jia, J. Inorg. Mater., 2017, 32, 909 CrossRef.
- M. X. Guo, J. X. Guo, F. L. Tong, D. Jia, W. Jia, J. B. Wu, L. X. Wang and Z. P. Sun, RSC Adv., 2017, 7, 45363 RSC.
- X. M. Fan, C. Yu, J. Yang, Z. Ling and J. S. Qiu, Carbon, 2017, 70, 130 CrossRef.
- D. C. Marcano, D. V. Kosynkin, J. M. Berlin, A. Sinitskii, Z. Sun, A. Slesarev, L. B. Alemany, W. Lu and J. M. Tour, ACS Nano, 2018, 12, 2078 CrossRef CAS PubMed.
- G. Y. Zhao, C. Chena, D. F. Yu, L. Sun, C. H. Yang, H. Zhang, Y. Sunb, F. Besenbacherc and M. Yu, Nano Energy, 2018, 47, 547 CrossRef CAS.
- L. Miao, H. Duan, M. X. Liu, W. J. Lu, D. Z. Zhu, T. Chen, L. C. Li and L. H. Gan, Chem. Eng. J., 2017, 317, 651 CrossRef CAS.
- T. Horikawa, N. Sakao, T. Sekida, J. Hayashi, D. D. Do and M. Katoh, Carbon, 2012, 50, 1833 CrossRef CAS.
- T. Kwon, H. Nishihara, H. Itoi, Q. H. Yang and T. Kyotani, Langmuir, 2009, 25, 11961 CrossRef CAS PubMed.
- L. T. Hu, J. X. Hou, Y. Ma, H. Q. Li and T. Y. Zhai, J. Mater. Chem. A, 2016, 4, 15006 RSC.
- X. C. Zhao, Q. Zhang, C. M. Chena, B. S. Zhang, S. Reichea, A. Q. Wang, T. Zhang, R. Schlögla and D. S. Su, Nano Energy, 2012, 1, 624 CrossRef CAS.
- D. Y. Zhang, L. W. Zheng, Y. Ma, L. Y. Lei, Q. L. Li, Y. Li, H. M. Luo, H. X. Feng and Y. Hao, ACS Appl. Mater. Interfaces, 2014, 6, 2657 CrossRef CAS PubMed.
Footnote |
| † Electronic supplementary information (ESI) available. See DOI: 10.1039/d0ra00458h |
| This journal is © The Royal Society of Chemistry 2020 |

