
 Open Access Article
 This Open Access Article is licensed under a Creative Commons Attribution-Non Commercial 3.0 Unported Licence
Hydrogen bonding sewing interface†
Zhenxing Cao‡
ab,
Zhigong Song‡c,
Fengzhi Liang‡b,
Xiaoguang And,
Karrar K. Al-Quraishib,
Min Wangb,
Jianchao Chend,
Dong Ding *e and
Yingchao Yang*b
*e and
Yingchao Yang*b
aDepartment of Materials Engineering, Changshu Institute of Technology, 99 Nansanhuan Rd., Changshu, Jiangsu 215500, P. R. China
bDepartment of Mechanical Engineering, University of Maine, 5711 Boardman Hall, Orono, ME 04469, USA. E-mail: yingchao.yang@maine.edu
cSchool of Engineering, Brown University, 184 Hope Street, Providence, RI 02912, USA
dSchool of Mechanical Engineering, Yanshan University, 438 W. Hebei Street, Qinhuangdao, Hebei 066004, P. R. China
eEnergy & Environmental Science and Technology, Idaho National Laboratory, Idaho Falls, ID 83401, USA. E-mail: dong.ding@inl.gov
First published on 5th May 2020
Abstract
The strong force that originates from breaking covalent bonds can be easily quantified through various testing platforms, while weak interfacial sliding resistance (ISR), originating from hydrogen bonding or van der Waals (vdW) forces, is very challenging to measure. Facilitated by an in-house nanomechanical testing system, we are able to precisely quantify and clearly distinguish the interfacial interactions between individual carbon fibers and several substrates governed by either hydrogen bonding or vdW forces. The specific ISR of the interface dominated by vdW forces is 3.55 ± 0.50 μN mm−1 and it surprisingly increases to 157.86 ± 44.18 μN mm−1 if the interface is bridged by hydrogen bonding. The ad hoc studies demonstrate that hydrogen bonding rather than vdW forces has great potential in sewing the interface if both surfaces are supportive of the formation of hydrogen bonds. The findings will enlighten the engineering of interfacial interactions and further mediate the entire mechanical performance of structures.
Introduction
With an upsurge of interest in the fabrication and manufacture of soft and smart materials, vdW forces and hydrogen bonding are believed to play a key role in a variety of systems.1–3 An interface exists between different matters. Its importance is highly dependent on the surface-to-volume ratio of the systems, where incredible physical behaviors may occur because of the augmented interfacial interactions (mainly vdW forces and hydrogen bonding). For example, square ice and superdense lithium have been observed under bilayer graphene confinement due to the ultra-strong vdW pressure.4,5 Self-healing in hydrogels can also be generated because of the reversibility and tunable strength of hydrogen bonding.6Both vdW forces and hydrogen bonds are too subtle to capture and are quite easily disturbed due to their reversible nature.7 vdW forces are distance-dependent interactions, which have diverse measurements obtained from varied experimental platforms.8–10 The hydrogen bond, a primarily electrostatic force of non-covalent attractions between an electropositive hydrogen donor and a strongly electronegative acceptor (F, O, N, or Cl), is ubiquitous in nature, central to biological functions, and only forms between specific functional groups or small molecules, such as the water molecule (H2O). In fact, small molecules can be trapped in the interfacial region due to hydrogen bonding and vdW interactions, filling the gap and bridging the interface.11–14 Within the interfacial region, the hydrogen bonding network tends to form dynamically and further glues the surroundings together, which will renormalize the local interfacial interaction and further mediate the entire mechanical performance.15–18
As one of carbon-based engineering structures, carbon fibers with ultrahigh surface-to-volume ratios are usually bundled together to reinforce other materials.19,20 The entire mechanical performance is mainly restricted by the interfacial bonding.21–23 Given the fact that carbon fibers are technically synthesized from small organic molecules, such as polyacrylonitrile (PAN), stabilized, carbonized at >1000 °C, and treated to obtain an active surface, a number of residual –OH groups can be found.24–26 As a result, the formation of hydrogen bonds around the surface of carbon fibers is richly supported.
In this study, we have developed a straightforward and sensitive method to quantify interfacial interactions between isolated carbon fibers and various substrates. Through the introduction of polar (water) and nonpolar (hexane) media into the interfacial region, hydrogen bonding and vdW forces between the fiber and the substrate will be generated separately to mediate the interfacial interactions. By the joint efforts of experimental observation and atomistic simulation, it is clearly shown that water pretreatment can significantly enhance ISR and tighten the contact facilitated by hydrogen bonding. Our study will benefit the rational design and assembly of new materials by describing tunable interfacial interactions.
Results and discussion
Among 1D fibers as well as between an individual 1D fiber and a substrate, it is very challenging to quantify both vdW forces and hydrogen bonding due to their reversibility. To this end, a facile in-house nanomechanical tester with a tunable force resolution has been built and is schematically demonstrated in Fig. 1a. The aligner, which is driven by picomotors along the X, Y, and Z axes, can bring two objects together to engage. The applied load is sensed by an aramid fiber, which is fixed at the edge of a silicon wafer. Depending on the requirement of force resolution, fibers with selected sizes can be used to measure the critical force. Under a small deformation assumption (δ ≪ L),27,28 the load (P) and the deflection (δ) will maintain a linear relationship, which can be written as P = kδ, where the spring constant k depends on the diameter d, elastic modulus E, and suspended length L of the sensing fiber:
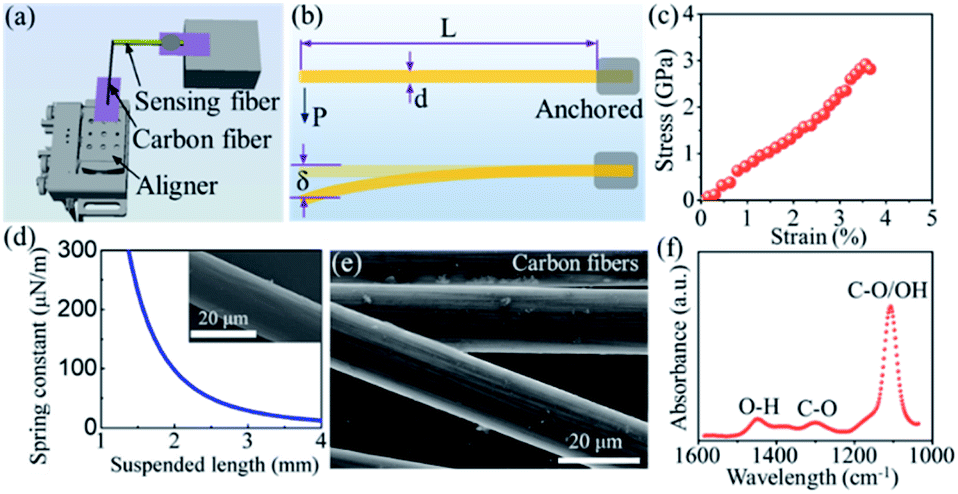 | ||
| Fig. 1 Setup for the sensing interfacial interaction. (a) An in-house setup with an aligner driven by picomotors for measuring the ISR. (b) An anchored aramid sensing fiber before and after loading with the load calculated by the product of deflection and the spring constant. (c) A representative stress–strain curve of the aramid fiber for elastic modulus measurements. (d) The relationship between the spring constant (k) and suspended length (L) with a given diameter of 17.4 μm and an elastic modulus of 78.7 GPa. The inset in (d) is a scanning electron microscope (SEM) image of the aramid fiber. (e) SEM image of carbon fibers. (f) Fourier-transform infrared spectroscopy (FTIR) spectrum of the carbon fibers. | ||
Seven aramid fibers were tested through uniaxial tensile testing in order to get their elastic modulus. A representative stress–strain curve is shown in Fig. 1c. The measured elastic modulus of the aramid fibers is 78.73 ± 14.73 GPa. The mechanical properties of all of the tested fibers can be found in the ESI Section I.† The inset in Fig. 1d shows an SEM image of an aramid fiber. The advantage of the in-house nanomechanical tester is to maintain a high-degree and compatible force resolution, as suggested by the above formula. In general, the spring constant of a commercial atomic force microscope (AFM) probe ranges from 0.01 N m−1 to 450 N m−1. The spring constant of the sensing fibers used in this study is 0.0043–0.157 N m−1 (ESI Section II†). The smallest spring constant is below the minimal resolution of the commercial AFM probe. A fiber with a longer suspended length and smaller diameter can be applied to sense the imperceptible force. For example, if a carbon fiber has a diameter of 7.5 μm and a suspended length of 10 mm, the calculated spring constant will be ∼0.0001 N m−1, which is two-orders of magnitude lower than the minimal resolution of the commercial AFM probe. The spring constants in our study are high enough to quantitatively measure the vdW forces and hydrogen bonding precisely. Fig. 1d interprets the relationship between the spring constant (k) and the suspended length (L) with a fixed diameter, d = 17.4 μm.
Carbon fibers (Fig. 1e) with a diameter of 7.5 μm, on which hydrophilic phenol and carboxyl groups are identified via the FTIR spectrum (Fig. 1f), are chosen to create hydrogen bonding and vdW forces with substrates. The ISR measurement was realized by debonding a carbon fiber out of the substrate. The interfacial region between the two surfaces was pretreated with polar (H2O) or a nonpolar (hexane) medium. Table 1 summarizes the ad hoc designed experiment for the debonding tests under interfacial interactions dominated by either hydrogen bonding or vdW forces. The FTO substrate can form hydrogen bonds with water molecules via the fluorine and oxygen atoms, while the Au substrate is incapable of forming any hydrogen bonds but can form vdW forces because of the inert Au atoms. In contrast to polar water forming hydrogen bonds, nonpolar hexane can only bridge the interfacial region with vdW forces.
| Tested fiber | Substrate | Medium | Bonding between fiber and medium | Bonding between medium and substrate |
|---|---|---|---|---|
| Carbon fiber | FTO | Air | vdW force | vdW force |
| Carbon fiber | FTO | H2O | Hydrogen bonding | Hydrogen bonding |
| Carbon fiber | FTO | Hexane | vdW force | vdW force |
| Carbon fiber | Au | Air | vdW force | vdW force |
| Carbon fiber | Au | H2O | Hydrogen bonding | vdW force |
| Carbon fiber | Au | Hexane | vdW force | vdW force |
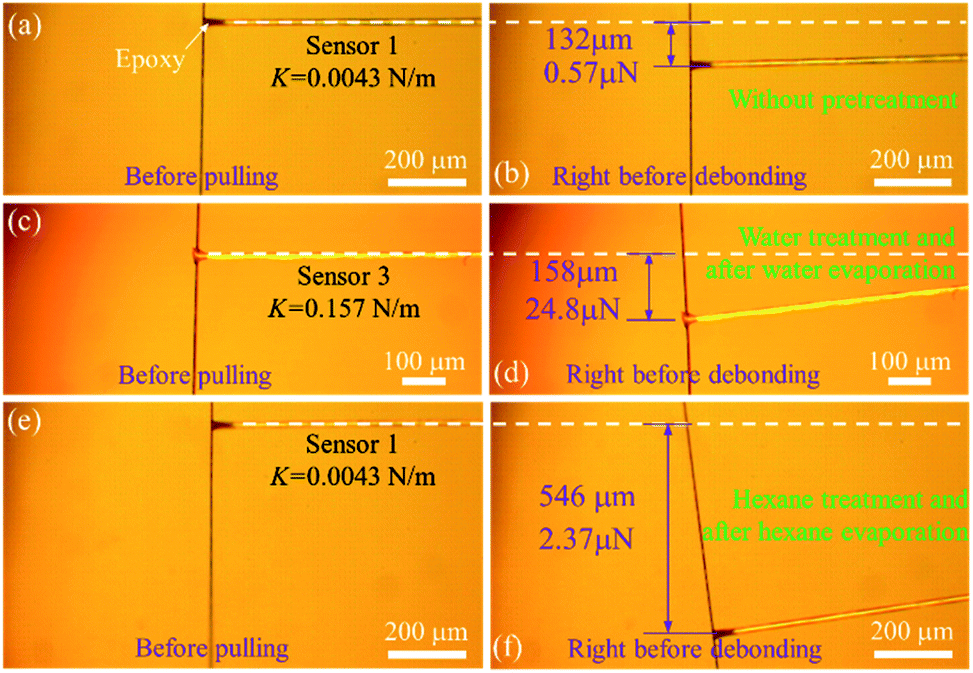
First, we conducted three comparative debonding tests with the above device to unveil the role of polar and nonpolar media in the interfacial region. Fig. 2 compares the debonding of the carbon fiber and the FTO glass with and without either H2O or hexane pretreatment. A carbon fiber was perpendicularly fixed to a sensing fiber with a tiny epoxy. The carbon fiber, together with the sensing fiber, was then loaded on the XYZ-motorized aligner with a step resolution of 30 nm toward the FTO glass. The dry carbon fiber was placed onto the FTO glass. The contact length between the carbon fiber and the FTO glass was 0.29 mm. The spring constant of the used sensing fiber was 0.0043 N m−1 (Sensor 1). The carbon fiber was pulled along the axial direction at a constant speed of 180 nm s−1. The entire debonding test was monitored using a digital camera mounted to the probe station. During the debonding test, the maximum deflection of the sensing fiber was 190 μm, as shown in Fig. 2b, and the specific ISR (load per contact length between the carbon fiber and the substrate) was 2.86 μN mm−1. Three more tests were conducted. Details of the contact lengths, spring constants, deflections, and specific ISR can be found in the ESI Section III.† The average specific ISR was as low as 2.65 ± 0.51 μN m−1.
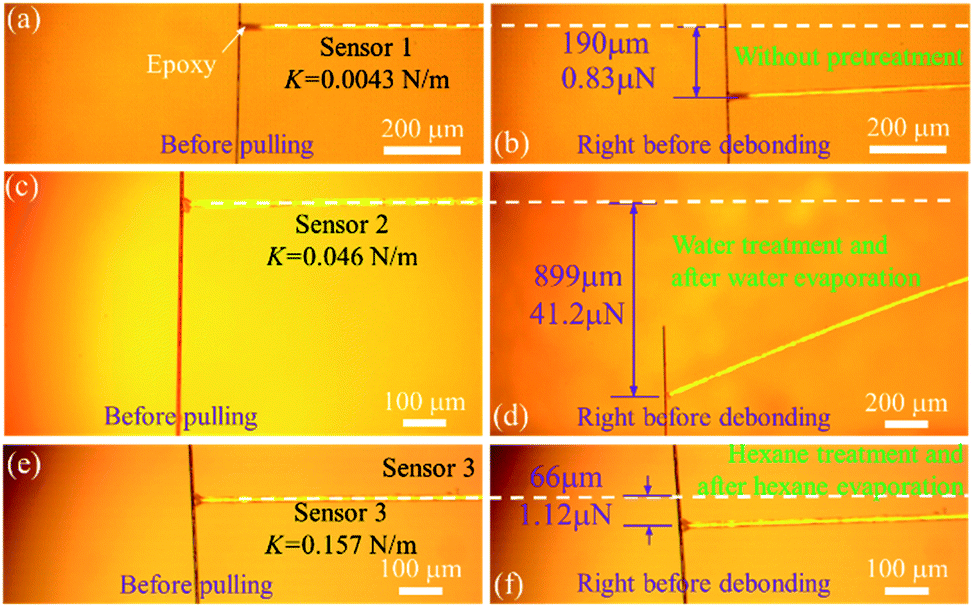 | ||
| Fig. 2 Debonding tests between individual carbon fiber and FTO glass. (a) Optical image of a bridged carbon fiber and an aramid sensing fiber. (b) The last moment before the debonding of the fiber in (a) without any pretreatment. (c) Original bridged water-treated carbon fiber and sensing fiber before testing. (d) The last moment before the debonding of the fiber in (c) after water evaporation. (e) Original bridged hexane-treated carbon fiber and sensing fiber before testing. (f) The last moment before debonding of the fiber in (e) after hexane evaporation. | ||
To mediate interfacial bonding through water pretreatment, a drop of deionized (DI) water (∼50 μL) was dropped onto the contact area between the carbon fiber and the FTO glass. The setup was exposed to ambient conditions for 24 hours to evaporate the water. The spring constant of the used sensing fiber is 0.046 N m−1 (Sensor 2). During the debonding test, the maximum deflection of the sensing fiber surprisingly reached as high as 899 μm, as shown in Fig. 2d, and the specific ISR is 147.14 μN mm−1, which indicates that the interfacial interaction is dramatically enhanced after water bridges the interfacial gap and then fully evaporates. Three more tests were conducted. Details of the contact lengths, spring constants, deflections, and debonding forces can be found in the ESI Section IV.† The average specific ISR was 157.86 ± 44.18 μN mm−1, which is ∼60 times higher than that of ISR debonding the carbon fiber from the FTO without any pretreatment. It has been confirmed by the FTIR spectrum (Fig. 1f) that there are several types of hydrophilic functional groups on the surface of the carbon fibers, such as hydroxyl groups (O–H) and carboxyl groups (O![[double bond, length as m-dash]](https://www.rsc.org/images/entities/char_e001.gif) C–O–H). These residual –OH groups, which can be sourced from the typical manufacturing process of carbon fibers,24–26 serve as latent binding sites for the hydrogen bond network. With the introduction of water into the interfacial region, the hydrogen bond network is immediately formed between the carbon fiber and the FTO substrate due to their hydrophilic surface. The evaporation of water will bring the two surfaces to the distance suitable for hydrogen bond formation. In contrast, if there is no water involved, the large surface distance will prevent the formation of hydrogen bond between the carbon fiber and the FTO glass, accounting for the lower specific ISR.
C–O–H). These residual –OH groups, which can be sourced from the typical manufacturing process of carbon fibers,24–26 serve as latent binding sites for the hydrogen bond network. With the introduction of water into the interfacial region, the hydrogen bond network is immediately formed between the carbon fiber and the FTO substrate due to their hydrophilic surface. The evaporation of water will bring the two surfaces to the distance suitable for hydrogen bond formation. In contrast, if there is no water involved, the large surface distance will prevent the formation of hydrogen bond between the carbon fiber and the FTO glass, accounting for the lower specific ISR.
To further confirm that the enhanced ISR is mainly due to hydrogen bonds rather than vdW forces, liquid hexane, a nonpolar medium, which apparently does not allow for the formation of hydrogen bonds, is introduced into the interfacial region for a comparative study. Nonpolar hexane is volatile at room temperature and has a boiling temperature of 68 °C. Following the same debonding test route, a carbon fiber was pulled out of the FTO glass after the hexane fully evaporated. The optical images of the carbon fiber bridged to the sensing fiber and the moment right before debonding are shown in Fig. 2e and f, respectively. The inset of Fig. 2e shows the contact length of the carbon fiber sitting on the FTO glass. The maximum deflection is 66 μm and the specific ISR is 4.0 μN mm−1. Three more tests are included in the ESI Section V.† The average specific ISR is 3.55 ± 0.50 μN mm−1, which is slightly higher than the average specific ISR with no pretreatment (2.65 ± 0.51 μN mm−1).
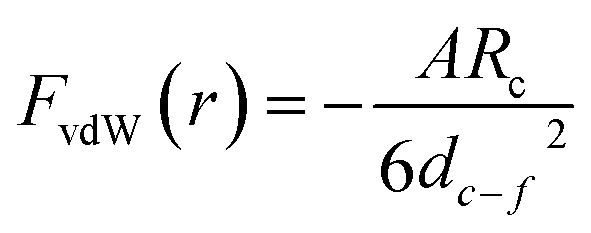
For macroscopic bodies with known volumes and numbers of atoms per unit volume, theoretically, the total vdW forces can be calculated by the integration of all of the interacting pairs. For example, the vdW interaction energy between two spherical bodies with radii of R1 and R2 and with a closest surface distance of d1–2 was predicted by H. C. Hamaker.29 If d1–2 is much lower than R1 and R2, the potential energy U can be written as:

where the radius of the carbon fiber Rc is 3.75 μm and dc–f is the surface distance between the carbon fiber and FTO glass. Since hydrogen bonding is not supported on the surface of the carbon fiber and FTO substrate after hexane pretreatment, the weak vdW forces offered by nonpolar hexane have limited capability to bring the two surfaces closer. Therefore, the specific ISR dominated by weak vdW forces is still low after the hexane pretreatment. In contrast, ISR after water evaporation is ∼60 times higher than that without water pretreatment, which suggests that hydrogen bonding would dominate the interfacial region and sew the interface between the carbon fiber and FTO glass.
These comparative results indicate that regardless of the polar or nonpolar medium the liquid pretreatment can intrinsically strengthen the interfacial interaction by tightening the contact of the two surfaces. The improvement is directly reflected by the increased ISR. However, the underlying physical origin of the increased ISR is quite different. After water pretreatment, a huge increase in ISR is beneficial for the formation of a hydrogen bond network between the FTO substrate and carbon fiber, which is absent, as seen by the negligible increase in ISR, after the hexane pretreatment.
In order to visualize the role of water pretreatment in the debonding test, a set of atomistic simulations are presented to provide atomic insights into the enhanced interfacial bonding induced by water pretreatment. A minimal simulated model of the water evaporation process is set up in Fig. 3a. The carbon fiber is modelled as a 2 nm-long multiwalled carbon nanotube (MWCNT, 10 walls) with a radius of 5 nm and the FTO is simplified as a crystalline SnO2 substrate. The interface between MWCNT and the SnO2 substrate is fully saturated with the water solution (3973 water molecules). As a comparative study, MWCNT both with and without the residual OH-group is investigated, where the residual OH-group is randomly distributed on the outside of the MWCNT with a 50% oxidation ratio (carbon number occupied by the OH-group/total carbon number). The whole system is equilibrated at 300 K for more than 5 ns and the gap between MWCNT and the substrate is kept at approximately 2 nm. The force field is OPLS-AA, which can accurately capture the interfacial properties between water and the carbon nanostructures. The water evaporation process is simulated by a random delete algorithm implemented in the LAMMPS package, and the temperature of the remaining water solution is dynamically controlled at 300 K during the evaporation process with a low evaporation rate of 6 molecules per ps.
 | ||
| Fig. 3 A minimal simulated model of the water evaporation process in the interface between the carbon fiber and FTO glass. (a) Schematic of water evaporating from the interface; (b–d) water evaporating from the interface between the FTO glass and carbon fiber with the residual OH-group; (e–g) water evaporating from the interface between the FTO glass and carbon fiber without the residual OH-group. | ||
Fig. 3 clearly shows that the residual OH-groups make the MWCNT more hydrophilic and water molecules tend to encapsulate the MWCNT and stick around the interface, which facilitates the formation of a compact hydrogen bond network. As the evaporation process goes on, the water layer drags the MWCNT closer to the substrate and the hydrogen bond network sews the interface gradually and renormalizes the interfacial interactions. Finally, a more compact interface is formed with strengthened ISR and a larger contact area, as seen in Fig. 3d. In sharp contrast, if the surface does not have residual OH-groups, water molecules will fully evaporate and leave the substrate dry as before wetting, as shown in Fig. 3e–g.
Regardless of the pretreatment with H2O or hexane, the FTO glass always has the possibility of forming hydrogen bonds with the residual OH-groups on the surface of the carbon fiber. To completely rule out the contribution of hydrogen bonds during the pretreatment process, Au-coated glass, which cannot form hydrogen bonds with the carbon fiber and polar H2O, is chosen as the substrate for the comparative study. The interactions between the Au substrate and liquid medium will be mainly in the form of vdW forces. Fig. 4 demonstrates three comparative debonding tests between individual carbon fibers and the Au substrate with and without either water or hexane pretreatment. When there is no pretreatment between individual carbon fibers and the substrate, the specific ISR on the Au substrate (Fig. 4a and b) is 1.97 μN mm−1. Three more tests were conducted. The average specific ISR is 1.42 ± 0.49 μN mm−1, which is close to that of the FTO glass (Fig. 2a and b). Details of the contact lengths, spring constants, deflections, and specific ISR can be found in the ESI Section VI.† The results suggest that the interfacial interactions between carbon fiber and Au or the FTO substrate is mainly dominated by vdW forces, without any pretreatment.
 | ||
| Fig. 4 Debonding tests between individual carbon fibers and Au-coated glass. (a) Optical image of a bridged carbon fiber and an aramid sensing fiber. (b) The last moment before debonding (a) without any pretreatment. (c) Original bridged water-treated carbon fiber and sensing fiber before testing. (d) The last moment before debonding (c) after water evaporation. (e) Original bridged hexane-treated carbon fiber and sensing fiber before testing. (f) The last moment before debonding (e) after hexane evaporation. | ||
Subsequently, a drop of water was used to fill the gap between the carbon fiber and Au substrate, the hydrogen bond network glues the water droplet and the carbon fiber together, while vdW forces bridge the Au substrate and the water droplet. After water evaporation, debonding tests were conducted on the Au substrate, as shown in Fig. 4c and d. The calculated debonding force is 24.8 μN, and the corresponding specific ISR is 88.57 μN mm−1. Three more debonding tests were conducted to confirm this result and the average specific ISR is 98.21 ± 7.03 μN mm−1. Details of the contact lengths, spring constants, deflections, and debonding forces can be found in the ESI Section VII.† From the previous analysis, the contact between the Au substrate and carbon fiber is dominated by vdW forces, which are supposed to be very weak. Interestingly, this specific ISR after water pretreatment is much higher than that after the hexane pretreatment, which suggests that much better contact is achieved through water renormalizing the interface. In order to reveal the role of water in the interfacial region, the contact angle between H2O and Au was measured as 69.9° (shown in the ESI Section VIII†), which is close to the previous measurement.30 Regarding the hydrophilic nature of the Au surface, water fills the interfacial gap between the carbon fiber and Au substrate more smoothly than hexane, realizing much closer contact with both sides. Thus, the vdW attraction is significantly enhanced due to the closer contact, which increases the contact area further and leads to a much stronger vdW attraction. Therefore, a much higher specific ISR is obtained due to the water pretreatment rather than hexane pretreatment because of the augmented vdW attraction.
Finally, another carbon fiber was pulled out of the Au-coated glass after hexane evaporation (Fig. 4e and f). With the hexane pretreatment, the specific ISR on the Au substrate is 3.70 ± 1.14 μN mm−1, which is very close to that on the FTO glass. Apparently, the contact is dragged a little closer by hexane pretreatment compared to no pretreatment since the specific ISR is slightly higher due to the hexane evaporation. Details of the contact lengths, spring constants, deflections, and debonding forces can be found in the ESI Section IX.†
Conclusions
In summary, weak force signals (vdW force and hydrogen bonding), which have been generally ignored in macroscopic material systems, have been measured and distinguished using an in-house nanomechanical tester. Facilitated by the evaporation of polar and nonpolar media between carbon fibers and selected substrates, the interfacial interactions have been created by either hydrogen bonding or vdW forces. The specific ISR for the interface dominated by hydrogen bonding is ∼60 times higher than that bridged by vdW forces. The significant difference in the interfacial interactions suggests that hydrogen bonds rather than vdW forces have a higher potential in sewing the interface if both surfaces are supportive of hydrogen bond formation. The research will benefit the rational design and assembly of new materials by describing tunable interfacial interactions.Experimental section
Materials and characterizations
Aramid fibers (DAF III, Bluestar Chengrand Chemical Co. Ltd. China) and carbon fibers (T700-SC, Toray) were characterized using an optical workstation (Micromanipulator 6200), SEM (AMR 1820) at a voltage of 10 kV, and FTIR (ABB-Bomem FTLA 2000). The epoxy to bridge the carbon fiber and aramid fiber was a Hardman double bubble blue general purpose slow-setting epoxy. The water used in this study is deionized water. Anhydrous hexane was ordered from Sigma-Aldrich, Inc. The Au was coated on a silicon wafer by a Denton desk sputter. The contact angle between H2O and Au-coated glass was measured by an optical contact angle measurement tester (OCA200, Dataphysics).Mechanical characterization of aramid fibers for force sensing
To measure the elastic modulus of the aramid fibers, tensile tests were performed using a Gatan™ Deben micro-tester (Gatan, Inc., U.K.). A load cell of 200 N was used to monitor and collect the load continuously. During the tensile tests, the loading rate was set at 1.2 mm s−1. The force-displacement was directly obtained after tensile testing. Table S1 in the ESI Section I† summarizes the diameter, fracture strength, and elastic modulus for all the tested fibers.In-house nanomechanical tester
The in-house nanomechanical tester was composed of an XYZ-motorized five-axis aligner (8081-UHV, Newport, CA) and a sensing fiber made of an aramid fiber. The linear stages are driven by picomotors. The displacement resolution is 30 nm per step. The force resolution depends on the spring constant of the sensing fiber. The nanomechanical tester can be placed on the stage of the optical workstation, which facilitates the observation of the mechanical behaviors of the tested samples. A digital camera mounted on the workstation can capture video as well.Debonding carbon fiber out of the substrate
A carbon fiber was bridged to the sensing fiber by a tiny epoxy. The carbon fiber was loaded at the edge of an FTO glass with a contact length of ∼0.30 mm. To quantify the interfacial interactions, the carbon fiber was pulled out by the sensing fiber. The specific force (maximum force per length) was calculated for direct comparison. To quantify the interfacial interaction dominated by hydrogen bonding, a drop of water (∼50 μL) was loaded onto the contact area between the carbon fiber and the FTO glass. The whole setup was exposed to air for 24 hours to evaporate the water. Subsequently, the carbon fiber was pulled out of the FTO glass. To quantify the interfacial interactions dominated by vdW forces, a drop of hexane (∼50 μL) was loaded between a carbon fiber and an FTO glass as well as between a carbon fiber and an Au-coated substrate. The other procedures are exactly the same as those in the test with water pretreatment. Direct competition between hydrogen bonding and vdW forces was created between the carbon fiber and the Au-coated substrate with water bridging. The debonding tests were carried out after the water evaporated.Conflicts of interest
There are no conflicts to declare.Acknowledgements
Y. Y. acknowledges the support from University of Maine Start-up funds. Y. Y. and D. D. acknowledge the support from the Idaho National Laboratory Directed Research and Development Program under DOE Idaho Operations Office Contract DE-AC07-05ID14517.References
- C. Yang and Z. Suo, Nat. Rev. Mater., 2018, 3, 125–142 CrossRef CAS.
- X. Hu, M. Vatankhah-Varnoosfaderani, J. Zhou, Q. Li and S. S. Sheiko, Adv. Mater., 2015, 27, 6899–6905 CrossRef CAS.
- J. Li, Z. Suo and J. J. Vlassak, J. Mater. Chem. B, 2014, 2, 6708–6713 CAS.
- G. Algara-Siller, O. Lehtinen, F. Wang, R. Nair, U. Kaiser, H. Wu, A. Geim and I. Grigorieva, Nature, 2015, 519, 443–445 CrossRef CAS PubMed.
- M. Kühne, F. Börrnert, S. Fecher, M. Ghorbani-Asl, J. Biskupek, D. Samuelis, A. V. Krasheninnikov, U. Kaiser and J. H. Smet, Nature, 2018, 564, 234–239 CrossRef PubMed.
- S. Talebian, M. Mehrali, N. Taebnia, C. P. Pennisi, F. B. Kadumudi, J. Foroughi, M. Hasany, M. Nikkhah, M. Akbari and G. Orive, Adv. Sci., 2019, 1801664 CrossRef PubMed.
- J. Mead, H. Xie, S. Wang and H. Huang, Nanoscale, 2018, 10, 3410–3420 RSC.
- D. Tabor and R. Winterton, Proc. R. Soc. London, 1969, 312, 435–450 CAS.
- R. G. Horn and J. N. Israelachvili, J. Chem. Phys., 1981, 75, 1400–1411 CrossRef CAS.
- J. Israelachvili, Y. Min, M. Akbulut, A. Alig, G. Carver, W. Greene, K. Kristiansen, E. Meyer, N. Pesika and K. Rosenberg, Rep. Prog. Phys., 2010, 73, 036601 CrossRef.
- Y. Liu, X. Chen, J. Li and J. Luo, Carbon, 2019, 154, 266–276 CrossRef CAS.
- K. Vasu, E. Prestat, J. Abraham, J. Dix, R. Kashtiban, J. Beheshtian, J. Sloan, P. Carbone, M. Neek-Amal and S. Haigh, Nat. Commun., 2016, 7, 12168 CrossRef CAS PubMed.
- M. Neek-Amal, F. M. Peeters, I. V. Grigorieva and A. K. Geim, ACS Nano, 2016, 10, 3685–3692 CrossRef CAS PubMed.
- L. Yang, Y. Guo and D. Diao, Phys. Chem. Chem. Phys., 2017, 19, 14048–14054 RSC.
- K. Jinesh and J. Frenken, Phys. Rev. Lett., 2006, 96, 166103 CrossRef CAS PubMed.
- H. Lee, J. H. Ko, J. S. Choi, J. H. Hwang, Y. H. Kim, M. Salmeron and J. Y. Park, J. Phys. Chem. Lett., 2017, 8, 3482–3487 CrossRef CAS PubMed.
- T. Arif, S. Yadav, G. Colas, C. V. Singh and T. Filleter, Adv. Mater. Interfaces, 2019, 6, 1901246 CrossRef CAS.
- T. Arif, G. Colas and T. Filleter, ACS Appl. Mater. Interfaces, 2018, 10, 22537–22544 CrossRef CAS PubMed.
- H. L. Tekinalp, V. Kunc, G. M. Velez-Garcia, C. E. Duty, L. J. Love, A. K. Naskar, C. A. Blue and S. Ozcan, Compos. Sci. Technol., 2014, 105, 144–150 CrossRef CAS.
- K. Lu, Science, 2010, 328, 319–320 CrossRef CAS PubMed.
- R. O. Ritchie, Nat. Mater., 2011, 10, 817–822 CrossRef CAS PubMed.
- R. Ritchie, Mater. Sci. Eng., A, 1988, 103, 15–28 CrossRef.
- Y. Yang, X. Liang, W. Chen, L. Cao, M. Li, B. W. Sheldon and J. Lou, Carbon, 2015, 95, 964–971 CrossRef CAS.
- X. Huang, Materials, 2009, 2, 2369–2403 CrossRef CAS.
- R. Perret and W. Ruland, J. Appl. Crystallogr., 1970, 3, 525–532 CrossRef CAS.
- W. Johnson and W. Watt, Nature, 1967, 215, 384–386 CrossRef CAS.
- J. Cleveland, S. Manne, D. Bocek and P. Hansma, Rev. Sci. Instrum., 1993, 64, 403–405 CrossRef CAS.
- A. Torii, M. Sasaki, K. Hane and S. Okuma, Meas. Sci. Technol., 1996, 7, 179–184 CrossRef CAS.
- H. C. Hamaker, Physica, 1937, 4, 1058–1072 CrossRef CAS.
- K. Bewig and W. Zisman, J. Phys. Chem., 1965, 69, 4238–4242 CrossRef CAS.
Footnotes |
| † Electronic supplementary information (ESI) available. See DOI: 10.1039/d0ra00366b |
| ‡ These authors contribute equally. |
| This journal is © The Royal Society of Chemistry 2020 |