 Open Access Article
Effective hydrogenation of carbonates to produce methanol over a ternary Cu/Zn/Al catalyst†
Jiachen Liabcd,
Liguo Wang *abcdf,
Xiang Huiabcdg,
Chanjuan Zhangabcd,
Yan Caoab,
Shuang Xuab,
Peng Heab and
Huiquan Li
 *abcde
aCAS Key Laboratory of Green Process and Engineering, Institute of Process Engineering, Chinese Academy of Sciences, Beijing, 100190, China. E-mail: lgwang@ipe.ac.cn
bNational Engineering Laboratory for Hydrometallurgical Cleaner Production Technology, Institute of Process Engineering, Chinese Academy of Sciences, Beijing, 100190, China
cSino-Danish College, University of Chinese Academy of Sciences, Beijing, 100049, China
dSino-Danish Center for Education and Research, University of Chinese Academy of Sciences, Beijing, 10049, China
eSchool of Chemical Engineering, University of Chinese Academy of Sciences, Beijing, 10049, China
fDalian National Laboratory for Clean Energy, Dalian, 116023, China
gDepartment of Chemical and Biochemical Engineering, Technical University of Denmark, Lyngby 2800 Kgs, Denmark
First published on 31st March 2020
Abstract
Methanol synthesized from carbonate hydrogenation is of great importance for CO2 utilization indirectly. Herein, a series of Cu/Zn/Al heterogeneous catalysts were prepared by co-precipitation with a synchronous aging step, and were applied for hydrogenation of diethyl carbonate (DEC) to produce methanol. Furthermore, the catalysts were characterized by physicochemical methods, such as N2 adsorption, ICP-OES, N2O titration, SEM, TEM, XRD, H2-TPR and XPS in detail. Higher copper concentration led to a higher ratio of bulk CuOx species in the calcined samples, which resulted in different copper species distribution after the reduction process. Structure activity relationship analysis indicated that the balance of surface Cu0 and Cu+ species influenced the formation rate of methanol. A higher proportion of Cu+ to (Cu+ + Cu0) was conductive to methanol formation, while excessive Cu0 site density played a negative influence on the methanol synthesized from DEC. Cu/Zn/Al with a 45.2% weight fraction of copper showed better performance with a total methanol formation rate of 131.0 mg gcat.−1 h−1. The reaction temperature and reaction time could obviously affect the reaction performance and the results suggested that 200 °C and 6 h were suitable. Furthermore, the long-term stability and activity of the catalyst was also studied on a fixed bed, and the yield of total methanol reached to 88.5% and the selectivity of total methanol gradually decreased to 74.0% within 200 h, which could be attributed to the detrimental influence derived from the increase of Cu0. The reaction pathways involved in the hydrogenation of DEC process were proposed. The substance scope was also extended to other carbonates and the catalyst exhibited superior catalytic performance toward linear carbonates. This work provided insights into carbonate hydrogenation over an effective Cu/Zn/Al catalyst, which could be utilized into upgrading CO2 indirectly to produce commodity methanol under relatively mild reaction conditions.
1. Introduction
Chemical utilization of greenhouse gas CO2 as a feedstock to make value-added chemicals, materials, and transportation fuel could reduce carbon emission and global warming, as well as providing a long-term solution for the depletion of global reserves of fossil fuels.1–4 So far, a series of high value-added chemicals from CO2 chemical conversion has been achieved, including cyclic carbonates, methanol, formic acid, alkyl carbamates, salicylic acid, dimethyl carbonate (DMC) and so on.5,6 Among them, methanol (CH3OH) is a widely applied bulk chemical and key feedstock for industrial chemicals, which can be further transformed into alternative high molecular weight liquid fuels.7 In this regard, hydrogenation of CO2 into methanol is a promising, efficient, and economical technique for CO2 utilization.8–10 Nevertheless, the reduction/activation of CO2 into useful liquid products is challenging due to the limitation of thermodynamics and kinetics.11,12 Carbonates, which can be produced from CO2 and alcohols, are reported could be further catalytic hydrogenated to produce methanol under certain circumstances.13–16 Thus, carbonates can be deemed as a bridge between CO2 and methanol to realize indirect hydrogenation of CO2.17–19 As shown in Scheme 1, this route is atom economy and consistent with the green chemistry concept.Until now, several groups did researches on this route, and focused on the different catalyst systems. For example, Ding et al.20 proposed the route of ethylene carbonate (EC) hydrogenation to co-produce methanol and ethylene glycol, and a homogeneous Ru-based catalyst was applied in this system with nearly full conversion of EC, and selectivity of EG as well as MeOH exceeded 99% at 40 °C. Beller et al.21 used homogeneous catalyst Co(BF4)2 combined with tridentate phosphine ligands to catalyze carbonates hydrogenation under relatively mild conditions. However, homogeneous catalysts must face the difficulties of separation, reuse, and stability industrially. For heterogeneous catalysts, copper-based catalysts are widely used in selective hydrogenation reactions since they are excellent catalytic active sites for C–O bonds hydrogenation (forming alcohols) and relatively inactive for C–C bond hydrogenolysis (forming low molar weight chemicals like CO2, CO and methane).22
Until now, Cu/HMS, CuCr2O4, Cu/CeO2 had been reported to catalyze carbonates hydrogenation effectively.23–26 Cu/SiO2 was reported to catalyse dimethyl carbonate (DMC) hydrogenation to methanol, and high copper dispersion and the synergetic effect between balanced Cu0 and Cu+ sites contribute to the yield of methanol.26 Dai et al.25 applied Cu/CeO2 nanomaterial in the hydrogenation of diethyl carbonate (DEC) to synthesize methanol, and confirmed the activity of Cu/CeO2 was influenced by the shape/crystal planes of CeO2. Furtherly, they prepared different Cu/CeO2 nanorod catalysts with various copper concentration and achieved relatively high space-time yield of 8.4 mmol gcat.−1 h−1, which was due to a high Cu0 surface area, the moderate ratio of Cu+/Cu0, as well as sufficient surface oxygen vacancies associated with Ce3+.27
In recent years, there has been continued interest in the ternary Cu/Zn/Al catalyst. Industrially, Cu/Zn/Al catalysts have been utilized for methanol synthesis from syngas at typical reaction conditions of 230–280 °C and 5–10 MPa.28–30 What's more, Cu/Zn/Al catalyst is a kind of environmentally friendly catalyst with high efficiency in direct CO2 hydrogenation because of excellent activity for hydrogenation of C![[double bond, length as m-dash]](https://www.rsc.org/images/entities/char_e001.gif) O bond.31,32 Hence, the development of effective Cu/Zn/Al catalyst for hydrogenation of carbonate is highly desired both in fundamental research and industrial application.
O bond.31,32 Hence, the development of effective Cu/Zn/Al catalyst for hydrogenation of carbonate is highly desired both in fundamental research and industrial application.
In this work, ternary Cu/Zn/Al heterogeneous catalysts were prepared by co-precipitation method and were applied in the hydrogenation of DEC into methanol. Moreover, the physicochemical properties as well as the structures of Cu/Zn/Al catalysts were systematically characterized by various techniques, including N2 physisorption, ICP-OES, N2O titration, XRD, H2-TPR, TEM, EDX-mapping, XPS and XAES. Furthermore, the effects of copper concentration, reaction temperature, and reaction time were also investigated. The structure–activity relationship was studied, and the reaction mechanism was proposed. Stability and catalytic performance of catalyst for a long period were also investigated on the fixed bed. At last, Cu/Zn/Al catalyst was also tested on other carbonates.
2. Experimental
2.1 Catalyst preparation
Typically, ternary Cu/Zn/Al was prepared by co-precipitation method using Na2CO3 as a precipitant. In a typical procedure, 1 mol L−1 Na2CO3 aqueous solution was added to 1 mol L−1 mixed metallic aqueous solution of Cu(NO3)2·3H2O, Zn(NO3)2·6H2O, and Al(NO3)2·9H2O with desired molar ratio of Cu–Zn–Al. Precipitation was carried out with synchronous aging step at 70 °C until pH of the solution achieved to 9, after which the mixture was cooled down to room temperature with stirring. Then, the resulting suspension was recovered by filtration and washed to neutral, then dried at 110 °C overnight and calcined at 500 °C for 5 h in the air. The catalyst was finally obtained by reduction at 500 °C for 3 h in the atmosphere of 10 vol% H2/N2. The Zn/Al ratio was fixed at 1/1 in molar ratio. In this work, a series of Cu/Zn/Al catalysts were prepared with different copper molar ratios of 0.5![[thin space (1/6-em)]](https://www.rsc.org/images/entities/char_2009.gif) :
:![[thin space (1/6-em)]](https://www.rsc.org/images/entities/char_2009.gif) 1
1![[thin space (1/6-em)]](https://www.rsc.org/images/entities/char_2009.gif) :
:![[thin space (1/6-em)]](https://www.rsc.org/images/entities/char_2009.gif) 1, 1
1, 1![[thin space (1/6-em)]](https://www.rsc.org/images/entities/char_2009.gif) :
:![[thin space (1/6-em)]](https://www.rsc.org/images/entities/char_2009.gif) 1
1![[thin space (1/6-em)]](https://www.rsc.org/images/entities/char_2009.gif) :
:![[thin space (1/6-em)]](https://www.rsc.org/images/entities/char_2009.gif) 1, 2
1, 2![[thin space (1/6-em)]](https://www.rsc.org/images/entities/char_2009.gif) :
:![[thin space (1/6-em)]](https://www.rsc.org/images/entities/char_2009.gif) 1
1![[thin space (1/6-em)]](https://www.rsc.org/images/entities/char_2009.gif) :
:![[thin space (1/6-em)]](https://www.rsc.org/images/entities/char_2009.gif) 1, 3
1, 3![[thin space (1/6-em)]](https://www.rsc.org/images/entities/char_2009.gif) :
:![[thin space (1/6-em)]](https://www.rsc.org/images/entities/char_2009.gif) 1
1![[thin space (1/6-em)]](https://www.rsc.org/images/entities/char_2009.gif) :
:![[thin space (1/6-em)]](https://www.rsc.org/images/entities/char_2009.gif) 1, 4
1, 4![[thin space (1/6-em)]](https://www.rsc.org/images/entities/char_2009.gif) :
:![[thin space (1/6-em)]](https://www.rsc.org/images/entities/char_2009.gif) 1
1![[thin space (1/6-em)]](https://www.rsc.org/images/entities/char_2009.gif) :
:![[thin space (1/6-em)]](https://www.rsc.org/images/entities/char_2009.gif) 1, which are denoted as Cu-0.5, Cu-1, Cu-2, Cu-3, Cu-4, respectively. We marked the samples in different preparation stages as Cu/Zn/Al-D (dry precursors), Cu/Zn/Al–C (samples after calcination) and Cu/Zn/Al catalyst (samples after reduction).
1, which are denoted as Cu-0.5, Cu-1, Cu-2, Cu-3, Cu-4, respectively. We marked the samples in different preparation stages as Cu/Zn/Al-D (dry precursors), Cu/Zn/Al–C (samples after calcination) and Cu/Zn/Al catalyst (samples after reduction).
2.2 Catalyst characterization
The element contents of catalysts were identified by inductively coupled plasma optical emission spectrometry (ICP-OES) on Agilent ICP-OES730. N2 physical adsorption measurements were carried using a Quantachrome Autosorb-1 at −196 °C. The BET surface areas were performed via the Brunauer–Emmett–Teller (BET) model. The total absorbed pore volumes were received from the nitrogen absorbed volume with a relative pressure of 0.99. Initial estimation of pore size distribution was obtained by Barrett, Joyner and Halenda (BJH) methods based on the isotherm desorption branch. Scanning electron microscopy (SEM) images were measured on a HITACHI SU8020 microscopy. Transmission electron microscopy (TEM), high-resolution transmission electron microscopy (HRTEM) and energy-dispersive X-ray (EDX) images were obtained on field-emission transmission electron microscopy (JEOL, JEM-2100F) using an acceleration voltage of 200 kV. Pre-treatment method was to disperse samples in ethanol ultrasonically for 30 min at ambient temperature. X-ray diffraction (XRD) patterns of samples were recorded in the 2θ range of 10–90° on a PANalytical Empyrean diffractometer with Cu Kα radiation (λ = 0.15406 nm). For the X-ray photoelectron spectroscopy (XPS) and X-ray Auger electron spectroscopy (XAES), the powder catalysts are taken from the sealing bottle. Samples to be tested are then pressed into pieces and glued to the sample stage, after 24 hours in a vacuum, they are performed on a Thermo scalable 250XI system with an Al Kα radiation source (hν = 1486.6 eV) to investigate the surface chemical states of samples. Temperature-programmed reduction (TPR) was performed to give further insight into the reducibility of the catalysts. The H2-TPR profiles were conducted with a Quantachrome Chembet pulsar TPR/TPD instrument. The TPR profiles were obtained with 5 vol% H2/Ar flow (40 mL min−1). The temperature was increased from 30 to 750 °C at a rate of 10 °C min−1. The copper dispersity was determined by applying the nitrous oxide chemisorption method and the reactions are described as eqn (1). The catalyst was firstly reduced in a 10 vol% H2 in argon for 1 h at 450 °C. The samples were cooled at room temperature for 1 hour and then a stream of 10 vol% N2O/Ar gas was fed into the reactor 40 °C and the effluent gas was analyzed by a thermal conductivity detector (TCD). Nitrogen evolved by the reaction was derived via peak area from the TCD signal. A Cu![[thin space (1/6-em)]](https://www.rsc.org/images/entities/char_2009.gif) :
:![[thin space (1/6-em)]](https://www.rsc.org/images/entities/char_2009.gif) N2O = 2
N2O = 2![[thin space (1/6-em)]](https://www.rsc.org/images/entities/char_2009.gif) :
:![[thin space (1/6-em)]](https://www.rsc.org/images/entities/char_2009.gif) 1 chemisorption stoichiometry was assumed. SCu is the surface area of exposed surface copper per gram catalyst, and it was calculated by eqn (2).
1 chemisorption stoichiometry was assumed. SCu is the surface area of exposed surface copper per gram catalyst, and it was calculated by eqn (2).| 2Cu(s) + N2O(g) → Cu2O(s) + N2(g) | (1) |
 | (2) |
2.3 Catalyst performance
The DEC hydrogenation was studied in a 50 mL autoclave. In addition, a fixed-bed reactor was also utilized to investigate the stability and activity of catalysts over a long time. In a typical experiment, 10 mmol DEC and 20 wt% catalyst based on DEC, 10 mL tetrahydrofuran and 20 μL p-xylene was added into the reactor. The reactor was then sealed and purged with N2 five times. After that, 5 MPa H2 were charged into the reactor at room temperature, and then the reactor was heated to desired temperature and hold for desired time with vigorous mechanical stirring of 600 rpm. After the reaction, the reactor was placed in an icy water bath and the residual gas was released gradually. For the long-period test, 0.5 g catalyst (40–60 mesh) was packed into a stainless-steel tubular reactor (11 mm in inner diameter, 500 mm in length) with a thermocouple inserted into the catalyst bed. And quartz wool was placed on both sides of the catalyst bed. A solution of 10 wt% DEC in tetrahydrofuran (THF) and 2.5 Mpa H2 were fed into the fixed bed at a H2/DEC molar ratio of 200. The reaction was carried out at 200 °C for 200 h, with the DEC liquid hourly space velocity (LHSV) of 0.2 h−1. After reaction, the used catalysts were dried after rinsing with ethanol and were then kept under seal for further characterizations.The liquid mixture was analyzed by GC-2014 (Shimadzu Ltd.) equipped with a flame ionization detector (FID), a DB-FFAP capillary column and an AOC-20i automatic sampler using p-xylene (20 μL) as the internal standard. Identification of the liquid products was studied using GCMS (Shimadzu-QP2020). The gas samples were analyzed via GC-2014 (Shimadzu Ltd.) equipped with an FID detector and two TCD detectors with seven packed columns. The conversion of DEC, selectivity/yield of detected MeOH were determined by the data from GC-2014 and calculated through the following eqn (3)–(5). In this reaction, a liquid by-product of ethyl methyl carbonate (EMC) was produced through methanol reacting with DEC, and the amount of total methanol produced is the sum of EMC and methanol detected which were calculated through eqn (6)–(9).
 | (3) |
 | (4) |
 | (5) |
 | (6) |
 | (7) |
| Sel.total = Sel.MeOH + Sel.EMC | (8) |
| Yieldtotal = YieldMeOH + YieldEMC | (9) |
 | (10) |
 | (11) |
3. Results and discussion
3.1 General characterization
Fig. S1† illustrates N2-physisorption isotherms and the corresponding pore size distributions from the adsorption branches of the catalysts. All curves of Cu-0.5, Cu-1, Cu-2, Cu-3, Cu-4 were of type IV and had mesoporous structure (2 nm < pore diameter < 50 nm).33 For these samples, the H3 type hysteresis loop (according to IUPAC classification) was observed, which was related to non-rigid aggregates of plate-like particles.27,34,35 In addition, with the decreasing of Cu content, the condensation occurred at relatively low pressure. Fig. S1(b)† shows BJH pore size distribution curves from the adsorption branch of the isotherm. Two peaks were observed, of which the first peak showed a broad pore size band in the pore size diameter of 2–10 nm. The second one revealed a relatively low-intensity band in the range of 10–100 nm. Table 1 lists the catalyst composition, textural property and specific copper surface area for each catalyst in this work. BET surface area of Cu/Zn/Al catalysts decreased from 74.4 to 34.6 m2 g−1 with copper content rising. Pore volumes of the catalysts were also followed the same trend, which decreased from 0.32 to 0.15 cm3 g−1. What's more, copper dispersion degree of Cu/Zn/Al catalysts were also determined by N2O titration in Table 1. The dispersion of Cu decreased gradually from 9.6% to 3.8% with the increment of copper concentration from 19.5% (Cu-0.5) to 72.8% (Cu-4).| Entry | Catalyst | Atomic ratios of Cu/Zn/Al | Cua wt% | N2 adsorption/desorption | N2O chemisorption | DEC conversion g and (%) | MeOH selectivityg (%) | MeOH yieldg (%) | MeOH formation rateg (mg gcat.−1 h−1) | |||
|---|---|---|---|---|---|---|---|---|---|---|---|---|
| SBETb (m2 g−1) | VPc (cm3 g−1) | dPd (nm) | De (%) | SCuf (m2 g−1) | ||||||||
| a Determined by ICP analysis.b BET surface area determined by the N2 adsorption at a relative pressure P/P0 of 0.99.c Total pore volume determined by the N2 adsorption at a relative pressure P/P0 of 0.99.d Average pore diameter determined by the N2 adsorption at a relative pressure P/P0 of 0.99.e Cu dispersion degree determined by N2O titration.f Cu surface area determined by N2O titration.g Reaction conditions: 10 mmol DEC, 5 MPa H2, 10 mL THF, 0.25 g catalyst, 200 °C and 6 h. | ||||||||||||
| 1 | Cu-0.5 | 0.5![[thin space (1/6-em)]](https://www.rsc.org/images/entities/char_2009.gif) : :![[thin space (1/6-em)]](https://www.rsc.org/images/entities/char_2009.gif) 1 1![[thin space (1/6-em)]](https://www.rsc.org/images/entities/char_2009.gif) : :![[thin space (1/6-em)]](https://www.rsc.org/images/entities/char_2009.gif) 1 1 |
19.5 | 74.4 | 0.32 | 19.3 | 9.6 | 12.7 | 82.1 | 43.9 | 36.0 | 60.2 |
| 2 | Cu-1 | 1![[thin space (1/6-em)]](https://www.rsc.org/images/entities/char_2009.gif) : :![[thin space (1/6-em)]](https://www.rsc.org/images/entities/char_2009.gif) 1 1![[thin space (1/6-em)]](https://www.rsc.org/images/entities/char_2009.gif) : :![[thin space (1/6-em)]](https://www.rsc.org/images/entities/char_2009.gif) 1 1 |
35.9 | 59.2 | 0.29 | 21.7 | 7.0 | 16.9 | 83.2 | 47.1 | 39.1 | 63.8 |
| 3 | Cu-2 | 2![[thin space (1/6-em)]](https://www.rsc.org/images/entities/char_2009.gif) : :![[thin space (1/6-em)]](https://www.rsc.org/images/entities/char_2009.gif) 1 1![[thin space (1/6-em)]](https://www.rsc.org/images/entities/char_2009.gif) : :![[thin space (1/6-em)]](https://www.rsc.org/images/entities/char_2009.gif) 1 1 |
45.2 | 46.4 | 0.22 | 22.8 | 5.8 | 17.8 | 86.1 | 52.5 | 45.2 | 95.6 |
| 4 | Cu-3 | 3![[thin space (1/6-em)]](https://www.rsc.org/images/entities/char_2009.gif) : :![[thin space (1/6-em)]](https://www.rsc.org/images/entities/char_2009.gif) 1 1![[thin space (1/6-em)]](https://www.rsc.org/images/entities/char_2009.gif) : :![[thin space (1/6-em)]](https://www.rsc.org/images/entities/char_2009.gif) 1 1 |
53.5 | 41.2 | 0.18 | 21.4 | 5.1 | 18.4 | 76.7 | 46.8 | 35.9 | 77.7 |
| 5 | Cu-4 | 4![[thin space (1/6-em)]](https://www.rsc.org/images/entities/char_2009.gif) : :![[thin space (1/6-em)]](https://www.rsc.org/images/entities/char_2009.gif) 1 1![[thin space (1/6-em)]](https://www.rsc.org/images/entities/char_2009.gif) : :![[thin space (1/6-em)]](https://www.rsc.org/images/entities/char_2009.gif) 1 1 |
72.8 | 34.6 | 0.15 | 20.9 | 3.8 | 18.6 | 66.0 | 37.5 | 24.7 | 41.4 |
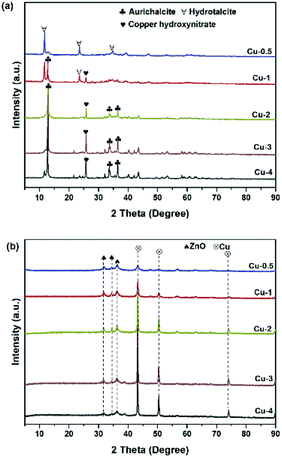
To study the catalyst structure at different preparation stages, X-ray diffraction patterns was analyzed systematically. The XRD patterns of the five dried precursors Cu-0.5, Cu-1, Cu-2, Cu-3 and Cu-4 are illustrated in Fig. 1(a). For the curve of Cu-0.5, the sharp peaks of hydrotalcite phase (Zn(OH)2) at diffraction angles 2θ = 11.6°, 23.3°, and 34.5° with good crystallinity were detected, which corresponded to the basal planes (003), (006), and (009), respectively.36 When the copper concentration increased to 45.2% (Cu-2), aurichalcite phase (Zn,Cu)5(OH)6(CO3)2, were detected at 2θ = 13.1°, 34.2°, and 36.7°, which were considered more probability to form interface between copper species and Zn/Al oxide supports.37,38 It is worth mentioning that the peak intensity of aurichalcite phase in Cu-2, Cu-3 and Cu-4 increased with copper content increasing, indicating a more intimate contact between copper species and Zn/Al oxide supports with higher copper content. The peak at 2θ = 25.9° is corresponding to the gerhardtite phase of copper hydroxide nitrate (Cu2(OH)3NO3)39, which further decomposed to CuO in the calcination step.40 XRD patterns of calcined samples are shown in Fig. S2(a).† After calcination, the peaks related to hydroxycarbonates in the dry precursors disappeared, but new characteristic peaks of metal oxides were detected. The peaks at 2θ = 31.8°, 34.4°, 36.3°,56.6° and 62.9° are attributed to ZnO with crystalline plane of (1 0 0), (0 0 2), (1 0 1), (1 1 0) and (1 0 3), respectively. The peaks at 35.6°, 38.8°, 48.7°, 58.3°, 61.2°, 65.9° and 68.2° are ascribed to CuO. Crystallization of CuO and ZnO are present in all five samples, while no crystal phases containing aluminum are detected. After calcination, aluminum tends to remain in a mixed oxide phase, which is amorphous state at the relatively lower calcination temperature of 500 °C.41 Fig. 1(b) shows the XRD patterns of catalysts after reduction with various copper contents. In comparison with XRD patterns before reduction, the samples showed obvious differences. Diffraction peaks of Cu were shown at 43.3°, 50.3° and 73.9°, belonging to the (111), (200), and (220) planes, respectively.42,43 When the mass fraction of copper increased, intensities of (111), (200), and (220) diffraction peaks of Cu were enhanced, indicating that the crystallinity of Cu increased. The possible reason is that the reduction of CuO to Cu is an exothermic reaction with ΔH = −80.8 kJ mol−1, so copper sintering occured in the reduction process to a certain degree.44
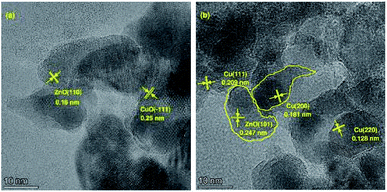
The morphological evolution for different preparation stages of Cu-2 are illustrated in Fig. 2. The sample of dry precursor showed a significant lamellar-like structure (Fig. 2 (a) and (b)). After calcination, morphology of the sample altered from lamellar to spherical. Compared with calcination samples, the morphology of Cu-2 didn't change much after reduction. The surface geometry of the Cu-2 catalyst was further studied by HRTEM (Fig. 3). Before reduction, copper species with a crystal plane of (−1 1 1) could be observed (Fig. 3(a)), which is in accordance with the results in XRD patterns. In addition, ZnO (1 0 1), Cu0 (1 1 1), (2 2 0), (2 0 0) can be observed in reduced Cu-2 catalyst after reduction. These results verified that the formation of interface between Cu and Zn/Al oxide, which enable an intimate contact between Cu species and oxide matrix.45 EDX elemental mapping in Fig. S3† illustrated that Cu, Zn and Al atoms are all homogeneously dispersed on Cu-2 catalyst. TEM imagines of Cu/Zn/Al catalyst with different copper content in Fig. S4† shows the average particle diameters of Cu/Zn/Al catalysts increased from 7.2 to 8.6 nm with copper content increasing.
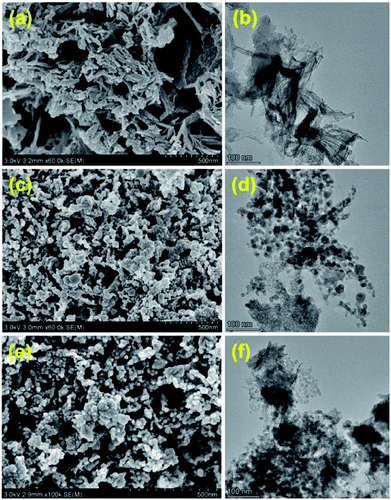 | ||
| Fig. 2 SEM & HRTEM images of Cu-2 catalyst in different preparation stages, (a) and (b) Cu/Zn/Al-D, (c) and (d) Cu/Zn/Al–C, (e) and (f) Cu-2 catalyst (after reduction). | ||
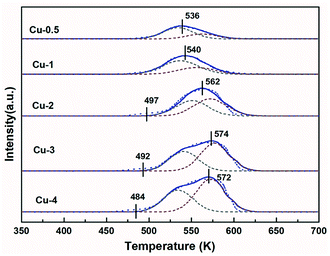
H2-TPR was used to study the reduction behavior of Cu/Zn/Al–C. Fig. 4 shows the TPR profiles of calcined catalysts for different Cu contents, exhibiting a broad reduction peak in the range of 450–600 K. Since ZnO and Al2O3 could not be reduced under certain experimental conditions,46 these profiles are described to CuO reduction in the CuO/ZnO/Al2O3 phase. Generally, the pure CuO was reduced at around 750 K, which was far over these main peaks.47 Therefore, it was inferred that the involvement of Zn and Al facilitated the dispersion of copper species and hence reduced the reduction temperature. The reduction of Cu2+ to Cu+ and Cu+ to Cu0 are considered as two steps in this reduction process.48 To gain more insight into the results of TPR, all profiles were deconvoluted into two Gaussian peaks. According to literatures,33,49 the peaks α and β could be ascribed to the reduction of different CuO phases: the low-temperature peak (peak α) was the surface CuO species, which is highly dispersed and influenced by ZnO, the high-temperature peak (peak β) belonged to isolated copper oxide (bulk CuO). Table 3 illustrates that the peak positions and the area proportion of these two peaks. Accordingly, it is seen from Table 3 that the ratio of dispersed CuO decreased with copper concentration increasing, which was in good accordance with trends of Cu dispersion degree determined by N2O titration in Table 1 and resulting in the difficulty in CuO reduction.
In addition, the onset reduction temperature for Cu-2, Cu-3 and Cu-4 samples decreased gradually, the result of which is in consistent with XRD curves in Fig. 1(a) that the dry precursors for these three samples showed the enhanced intensities of aurichalcite phase. It is reasonable that more intimate metal contact led to lower onset temperature. The TPR results suggested that higher copper concentration resulted in higher ratio of bulk CuO in the calcined samples, and the percentage of dispersed CuO and bulk CuO might influence the reduction process, as well as the ratio of Cu+/(Cu+ + Cu0).
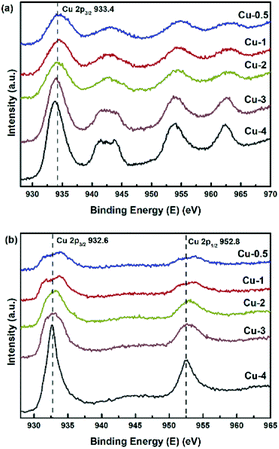
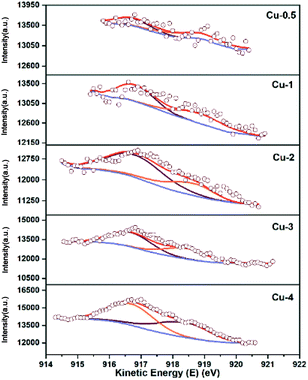
XPS-XAES was measured to confirm the chemical states of samples. The results were shown in Fig. 5 and 6, and the relevant quantitative data were summarized in Table 2. For all calcined samples, the XPS peaks at around 933.4 eV binding energy corresponding to Cu 2p3/2 and the shake-up of satellite peaks indicated that copper state was +2, which was consistent with XRD results. After the reduction process, the photoelectron peak of Cu 2p3/2 at about 932.6 eV towards lower binding energy and the absence of the satellite peaks suggested that Cu2+ species had been reduced to metallic Cu0 and/or Cu+. To better distinguish Cu0 and Cu+, the X-ray induced Auger spectrum of Cu LMM was also investigated. The peak positions, as well as the values of Cu+% derived from the deconvolution were summarized in Table 2. The asymmetric and broad peaks of Cu/Zn/Al catalysts were deconvoluted into two overlapping Cu LMM Auger kinetic energy peaks at around 917.0 eV and 918.8 eV, representing Cu+ and Cu0, respectively.
| Entry | Catalyst | TPR peak position (temperature/K) and area proportion (%) | |||
|---|---|---|---|---|---|
| Peak α | Peak β | ||||
| 1 | Cu-0.5 | 533.8 K | 69.9% | 562.3 K | 30.1% |
| 2 | Cu-1 | 539.4 K | 66.9% | 565.2 K | 33.1% |
| 3 | Cu-2 | 548.9 K | 47.0% | 570.5 K | 53.0% |
| 4 | Cu-3 | 539.4 K | 41.3% | 576.2 K | 58.7% |
| 5 | Cu-4 | 534.2 K | 40.0% | 572.7 K | 60.0% |
| Entry | Catalysts | Cu wt% | Binding energy (eV) | Binding energy (eV) | Cu+/(Cu+ + Cu0) (molar ratio) | ||||
|---|---|---|---|---|---|---|---|---|---|
| Cu 2p3/2 | Zn 2p1/2 | Zn 2p3/2 | Al 2p | Cu+ | Cu0 | ||||
| 1 | Cu-0.5 | 19.5 | 933.4 | 1046.1 | 1023.2 | 74.1 | 917.3 | 919.3 | 0.45 |
| 2 | Cu-1 | 35.9 | 933.3 | 1046.4 | 1023.2 | 74.2 | 916.9 | 918.8 | 0.56 |
| 3 | Cu-2 | 45.2 | 932.9 | 1046.0 | 1022.9 | 74.4 | 916.8 | 918.7 | 0.69 |
| 4 | Cu-3 | 53.5 | 932.7 | 1046.1 | 1023.1 | 74.4 | 916.8 | 918.7 | 0.57 |
| 5 | Cu-4 | 72.8 | 932.6 | 1045.5 | 1022.6 | 73.4 | 916.9 | 918.7 | 0.45 |
Although the ex situ re-oxidation of Cu and Cu2O in air could not be excluded completely, it usually required high temperature in oxygen atmosphere for effective oxidation of Cu0 to Cu+.50–52 In this work, as also verified by XPS results, there are not detectable CuO species in Cu/Zn/Al catalysts because of the absence of the characteristic satellite peaks. Therefore, the state of copper kept stable essentially during the characterization. As shown in Table 2, the ratio of Cu+/(Cu+ + Cu0) first rose and then decreased with the increase of copper concentration. The binding energy values of Zn (2p1/2) and Zn (2p3/2) were around 1046 eV and 1023 eV, respectively, which were closed to the energy peaks (1044.8 eV and 1021.8 eV) of ZnO.53 Moreover, there was an energy difference of 23 eV between Zn (2p1/2) and Zn (2p3/2) peaks, which is equivalent to that of ZnO.54 In addition, the spectrum recorded Al 2p peaks with the binding energy from 74.1–74.4 eV,55,56 which are characteristic for Al3+ ions in Al2O3. The XPS results showed a good agreement with the corresponding XRD analysis.
3.2 Catalytic performance of Cu/Zn/Al catalysts
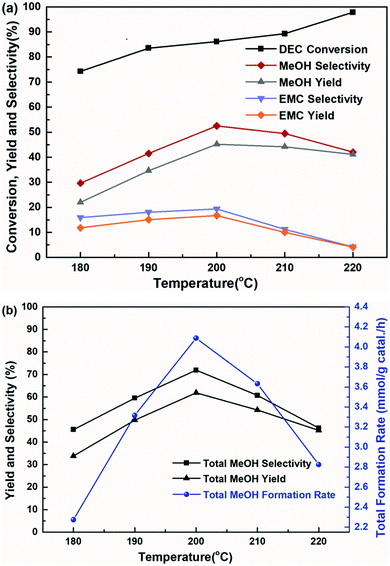
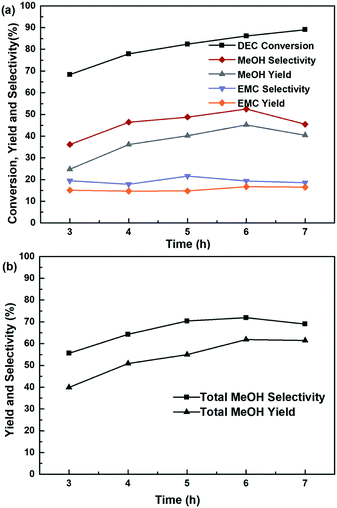
The catalytic performance of Cu/Zn/Al catalysts with different Cu concentration for the hydrogenation of DEC was performed under 200 °C for 6 h, and the results were summarized in Table 1. Increase in the copper concentration led to an increase firstly and then decrease in DEC conversion. The selectivity of methanol and methanol formation rate reached to the maximum on the Cu-2 catalyst (45.2%). For all the Cu/Zn/Al catalysts, methanol and ethanol were the main liquid products with the small amount of ethyl methyl carbonate (EMC). EMC is a by-product in heterogeneously catalyzed DEC hydrogenation probably resulting from transesterification of produced methanol and unreacted DEC. This transesterification was verified over Cu/Zn/Al catalyst (Cu-2) at 200 °C as well as on Zn/Al catalyst in Scheme S1,† which indicated that Zn/Al could facilitate the transesterification of methanol and DEC. For the gas products, CO2 and CO could be detected (Fig. S6†). The majority of gas products was CO2 which was considered to be produced through hydrolysis reaction between DEC and a small amount of water contained in the solvent,57 which could further react with H2 to form CO.26 Notably, the methanol formation rate reached to the maximum of 95.6 mg gcat.−1 h−1 at the highest Cu+/(Cu+ + Cu0) ratio of 0.69 among the catalysts tested. The percentage of Cu+ increased in the order of Cu-4 < Cu-0.5 < Cu-1 < Cu-3 < Cu-2 as shown in Table 2, the order of which is the same as the methanol formation rate and methanol selectivity. Hence, it could conceivably be hypothesised that the catalytic activity is highly related to the ratio of Cu+/(Cu+ + Cu0).The influence of reaction temperature on the catalytic activity was carried out in the range of 180–220 °C at 6 h, shown in Fig. 7. It is found that the reaction temperature had a significant effect on the performance of the catalyst, and the higher of the reaction temperature, the more favourable of the DEC conversion. The DEC conversion could reach to the highest of 97.8% when the temperature increased to 220 °C. However, selectivity and yield of methanol and EMC firstly increased and then decreased, accompanied by elevating reaction temperature. Noteworthy to say, since part of the methanol was further transesterified with DEC to produce by-product EMC, the total methanol yield was defined as the summary of detected methanol and EMC produced from methanol. And the trends of total methanol yield/selectivity/formation rate in Fig. 7(b) showed the same trends with the selectivity/yield of methanol and EMC in Fig. 7(a). All of them showed the highest data at the temperature of 200 °C, because the reaction temperature exceeding 200 °C might promote DEC hydrolysis, which caused a decrease of yield and selectivity of methanol, as well as total methanol. The effect of reaction time on the catalytic performance was also investigated and the results was shown in Fig. 8, the conversion of DEC increased gradually from 68.4% to 89.0% with reaction time increasing from 3 to 7 h. The selectivity and yield of methanol increased to 52.5% and 45.2% at 6 h but declined slightly when the reaction time further prolonged to 7 h. The total methanol selectivity and yield also increased gradually to maximum values at 6 h, 71.9% and 61.9%, respectively. The results in Fig. 7 and 8 implied that 200 °C and 6 h is an optimized temperature and a favourable reaction time, respectively.
3.3 Stability of Cu/Zn/Al catalyst
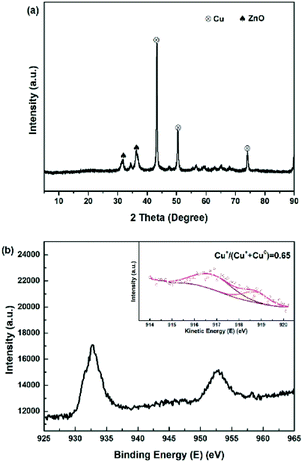
It is crucial for industrial application to study the long-term stability and activity of the catalyst. Fig. 9 and S5† plots the catalytic activity as a function of reaction time for the most efficient Cu-2 catalyst for DEC hydrogenation. It is obviously seen that DEC conversion stayed at around 95.0% over a 200 h reaction time, while the total methanol yield/selectivity was over 80.0% before the first 40 h, which showed good performance.27 However, both methanol and total methanol selectivity/yield declined slightly within 200 h. The decline of selectivity/yield might be explained by the fact that part of Cu+ was reduced by the H2 during the hydrogenation process, leading to the decrease of Cu+/(Cu+ + Cu0) ratio. This result was further verified by comparing Cu LMM XAES spectra of Cu-2 catalyst before and after 200 h of reaction (Fig. 10) that, the ratio of Cu+/(Cu+ + Cu0) decreased from 0.69 to 0.65.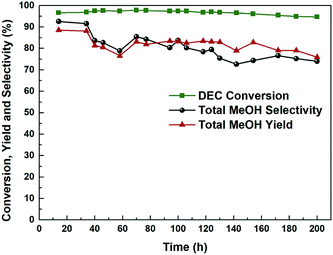 | ||
| Fig. 9 Hydrogenation performance of Cu-2 catalyst as a function of time on stream. Temperature: 200 °C, liquid hour space velocity (LHSV) ∼ 0.2 h−1, H2/DEC = 200, 2.5 MPa. | ||
3.4 Performance of Cu-2 on different scope of the carbonates
The applicability for a variety of symmetrical and/or asymmetrical carbonates, e.g., DMC, ethyl methyl carbonate, EMC, dibutyl carbonate (DBC), ethylene carbonate (EC), propylene carbonate (PC) over Cu-2 catalyst was surveyed at 200 °C and 5 MPa H2 initial pressure. Table 4 provides the summary statistics for the corresponding results.| Entry | Substrate | Time (h) | Conversion (%) | MeOH selectivity (%) | MeOH yield (%) |
|---|---|---|---|---|---|
| a Reaction conditions: the hydrogenation of carbonates are achieved at 200 °C, the dosage of carbonates is 10 mmol, in the solvent of 10 mL THF and 20 wt% Cu-2 catalyst (based on the carbonates). | |||||
| 1 |  |
8 | 100 | 76.8 | 76.8 |
| 2 |  |
8 | 98.9 | 49.1 | 48.6 |
| 3 |  |
8 | 99.4 | 41.2 | 38.9 |
| 4 |  |
8 | 82.7 | 15.2 | 12.6 |
| 5 |  |
6 | 98.7 | 7.0 | 6.9 |
For the hydrogenation of DMC, 76.8% yield of methanol could be obtained with 100% DMC conversion within 8 h, entry 1. For the hydrogenation of other carbonates linear, EMC and DBC, 48.6% and 38.9% methanol yield were obtained, respectively, and both of the conversion exceeded 98.9%. However, Cu-2 did not perform well on cyclic carbonates, i.e. EC and PC (entries 4 and 5), which was possibly caused by decomposition of cyclic carbonates in the presence of Zn/AlOx.58
3.5 Mechanism of the hydrogenation of DEC over Cu/Zn/Al catalysts
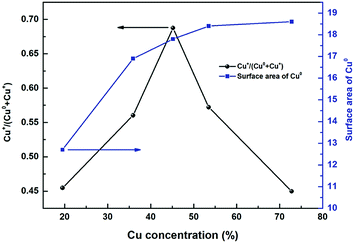
Above all, it is considered that Cu in the Cu/Zn/Al catalyst played a vital role in methanol synthesis from DEC hydrogenation. Without Cu, the binary catalyst Zn/Al can't promote the production of methanol from DEC and H2 (Scheme S1†). What's more, the synergistic cooperation of Cu0 and Cu+ sites, formed through CuO reduction, played a key role for the high performance of Cu/Zn/Al catalysts in the hydrogenation process.Fig. 11 shows the ratio of Cu+/(Cu+ + Cu0) and specific surface area SCu as a function of copper concentration. It could be found that the Cu+/(Cu+ + Cu0) showed a volcanic trend as a function of Cu concentration. The formation of stabilized Cu+ is considered to be related to the interface between copper species and metal oxide support, while the formation of Cu0 is considered to be originated from the bulk CuO.59–61 At the beginning of copper loading increase, Cu+/(Cu+ + Cu0) values initially increased because of the increase of relative interface area between Cu and Zn/Al species, thus resulting in the formation of more Cu+–O–Zn/Al like structures at the interface.62 After the copper concentration reached to a certain degree, the ratio of bulk CuO continued to increase (Table 2 peak β area proportion) but the relative interface area between copper species and Zn/Al oxides decreased. Therefore, the proportion of Cu+ decreased from 0.69 to 0.45. As a result, the ratio of Cu+/(Cu+ + Cu0) showed a volcanic trend as a function of Cu concentration. The conclusion had been come up with in catalytic performance part that the catalytic activity is highly related to the ratio of Cu+ sites. Higher Cu+/(Cu+ + Cu0) ratio led to higher methanol formation rate. While, the correlation in Fig. 11 demonstrates the optimal methanol formation rate on the Cu/Zn/Al catalysts lies not only in Cu+, but also in Cu0. However, excessive Cu0 sites density would play a negative influence on the methanol synthesis, which meant a balanced distribution of surface Cu0 and Cu+ species is considered to be an essential factor to obtain outstanding performance in the hydrogenation of carbonates.
Studies showed that Cu+ played as a function of adsorbing and stabilizing the intermediate products in the reaction and acts as an electrophilic or Lewis acid site to polarize the C![[double bond, length as m-dash]](https://www.rsc.org/images/entities/char_e001.gif) O bond through an electron lone pair on the oxygen, thereby increasing the reactivity of the ester group.63,64 While Cu0 species played as a function of absorption and activation of H2 via splitting hydrogen, which provided H atoms for reactant/intermediates.65 It should be noted that, excessive Cu0 sites lead to more H2 splitting, which will be transferred via spillover from metallic Cu particles to ZnO surface.57 This meant the function of ZnO, acting as electronic promoter to absorb ester groups,32,62 were suppressed. Thus, the excessive hydrogen spillover between Cu and ZnO led to the insufficient absorption coverage of the carbonates or reaction intermediate, leading the conversion of DEC decreased. Also, HRTEM results had verified the formation of interface between Cu and Zn/Al oxide in this paper, which is contribute to the high dispersion of Cu. In addition, Al2O3 was observed in XPS result and was considered as promoter to enhance the long-term stability, besides, the addition of Al has been reported to enhance the BET surface area and Cu dispersion as well as restrain copper particles sintering.62 In this paper, we think Al2O3 mainly played a supporting role and worked as a structure promoter.57
O bond through an electron lone pair on the oxygen, thereby increasing the reactivity of the ester group.63,64 While Cu0 species played as a function of absorption and activation of H2 via splitting hydrogen, which provided H atoms for reactant/intermediates.65 It should be noted that, excessive Cu0 sites lead to more H2 splitting, which will be transferred via spillover from metallic Cu particles to ZnO surface.57 This meant the function of ZnO, acting as electronic promoter to absorb ester groups,32,62 were suppressed. Thus, the excessive hydrogen spillover between Cu and ZnO led to the insufficient absorption coverage of the carbonates or reaction intermediate, leading the conversion of DEC decreased. Also, HRTEM results had verified the formation of interface between Cu and Zn/Al oxide in this paper, which is contribute to the high dispersion of Cu. In addition, Al2O3 was observed in XPS result and was considered as promoter to enhance the long-term stability, besides, the addition of Al has been reported to enhance the BET surface area and Cu dispersion as well as restrain copper particles sintering.62 In this paper, we think Al2O3 mainly played a supporting role and worked as a structure promoter.57
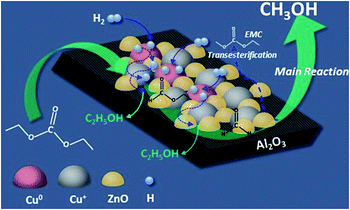
Based on our experimental results and analysis, a possible mechanism was proposed for DEC hydrogenation into methanol over Cu/Zn/Al, and the process is shown in Fig. 12. The whole process includes three steps, firstly, Cu+ species and ZnO adsorbs the ester groups of DEC. At the same time, H2 is absorbed and splitted into H atoms on Cu0 species. H atoms, which are then transferred to ZnO surface and trapped at the surface, further migrate to other Cu particles, and react with the absorbed DEC to form ethyl formate with one molecular of ethanol released at the surface of the catalyst (step 1); then, the formed ethyl formate continued react with H atoms to form formaldehyde with another molecular of ethanol released (step 2); at last, formaldehyde was hydrogenated by H atoms into methanol (step 3). Meanwhile, Zn/Al binary catalyst promoted the formation of EMC through transesterification reaction of methanol and DEC.
4. Conclusions
In this work, a series of Cu/Zn/Al catalysts with various copper concentrations were prepared by the co-precipitation method with synchronous aging step, which were applied in DEC hydrogenation. All catalysts possessed disordered mesoporous structures. In the preparation process, the morphology of samples altered from lamellar to spherical. Copper species of Cu+ and Cu0 were considered as active sites, and they had synergistic effect on the hydrogenation of DEC. The highest Cu+/(Cu+ + Cu0) value led to the best performance of catalyst (Cu-2). However, excessive Cu0 sites resulted in the decline of DEC conversion, since hydrogen spillover between Cu and ZnO influenced the absorption of carbonates/intermediate. Aluminum functioned as a support in the form of Al2O3. ZnO played the role of physical spacer between copper species and helped dispersing the Cu phase during the catalyst preparation, thus brought more intimate interface contact between Cu and Zn/Al oxide.At the optimized temperature of 200 °C and time of 4 h, Cu-2 catalyst with 45.2% mass fraction exhibited 86.1% DEC conversion and 71.9% total methanol selectivity with 131.0 mg gcat.−1 h−1 total methanol formation rate under 5 MPa. Time-on-stream experiments on a fixed bed showed that the conversion of DEC kept around 95.0% with a small declining selectivity of methanol over a 200 h reaction time at 200 °C and 2.5 MPa H2, and thus Cu-2 catalyst provided a long-term stability. This work provided a facile Cu/Zn/Al catalyst, which could be utilized into indirectly upgrading CO2 to produce commodity methanol under relatively mild reaction conditions.
Conflicts of interest
There are no conflicts to declare.Acknowledgements
The authors acknowledge the National Natural Science Foundation of China (21576272), “Transformational Technologies for Clean Energy and Demonstration”, Strategic Priority Research Program of the Chinese Academy of Sciences, Grant No. XDA 21030600. We also acknowledge the project from Science and Technology Service Network Initiative, Chinese Academy of Sciences (KFJ-STS-QYZD-138) for financial supports.Notes and references
- A. K. Ahmed Al-Mamoori, A. A. Rownaghi and F. Rezaei, Energy Technol., 2017, 5, 834–849 CrossRef
.
- I. Dimitriou, P. García-Gutiérrez, R. H. Elder, R. M. Cuéllar-Franca, A. Azapagic and R. W. K. Allen, Energy Environ. Sci., 2015, 8, 1775–1789 RSC
.
- M. He, Y. Sun and B. Han, Angew. Chem., Int. Ed. Engl., 2013, 52, 9620–9633 CrossRef CAS PubMed
.
- L. Wang, L. Wang, J. Zhang, X. Liu, H. Wang, W. Zhang, Q. Yang, J. Ma, X. Dong, S. J. Yoo, J. G. Kim, X. Meng and F. S. Xiao, Angew. Chem., Int. Ed. Engl., 2018, 57, 6104–6108 CrossRef CAS PubMed
.
- E. A. Quadrelli, G. Centi, J. L. Duplan and S. Perathoner, ChemSusChem, 2011, 4, 1194–1215 CrossRef CAS PubMed
.
- S. N. Riduan and Y. Zhang, Dalton Trans., 2010, 39, 3347–3357 RSC
.
- I. Yarulina, A. D. Chowdhury, F. Meirer, B. M. Weckhuysen and J. Gascon, Nat. Catal., 2018, 1, 398–411 CrossRef CAS
.
- K. Larmier, W.-C. Liao, S. Tada, E. Lam, R. Verel, A. Bansode, A. Urakawa, A. Comas-Vives and C. Coperet, Angew. Chem., Int. Ed., 2017, 56, 2318–2323 CrossRef CAS PubMed
.
- E. S. Van-Dal and C. Bouallou, J. Cleaner Prod., 2013, 57, 38–45 CrossRef CAS
.
- S. Kar, R. Sen, A. Goeppert and G. K. S. Prakash, J. Am. Chem. Soc., 2018, 140, 1580–1583 CrossRef CAS PubMed
.
- R. M. Cuellar-Franca and A. Azapagic, J. CO2 Util., 2015, 9, 82–102 CrossRef CAS
.
- J. L. Wang, C. X. Miao, X. Y. Dou, J. Gao and L. N. He, Curr. Org. Chem., 2011, 15, 621–646 CrossRef CAS
.
- L. G. Wang, H. Q. Li, S. M. Xin, P. He, Y. Cao, F. J. Li and X. J. Hou, Appl. Catal., A, 2014, 471, 19–27 CrossRef CAS
.
- X. Zhang, D. Jia, J. Zhang and Y. Sun, Catal. Lett., 2014, 144, 2144–2150 CrossRef CAS
.
- F. Gasc, S. Thiebaud-Roux and Z. Mouloungui, J. Supercrit. Fluids, 2009, 50, 46–53 CrossRef CAS
.
- O. Arbelaez, A. Orrego, F. Bustamante and A. Luz Villa, Top. Catal., 2012, 55, 668–672 CrossRef CAS
.
- E. Balaraman, C. Gunanathan, J. Zhang, L. J. Shimon and D. Milstein, Nat. Chem., 2011, 3, 609–614 CrossRef CAS PubMed
.
- X. L. Du, Z. Jiang, D. S. Su and J. Q. Wang, ChemSusChem, 2016, 9, 322–332 CrossRef CAS PubMed
.
- M. Cui, Q. Qian, Z. He, Z. Zhang, J. Ma, T. Wu, G. Yang and B. Han, Chem. Sci., 2016, 7, 5200–5205 RSC
.
- Z. B. Han, L. C. Rong, J. Wu, L. Zhang, Z. Wang and K. L. Ding, Angew. Chem., Int. Ed., 2012, 51, 13041–13045 CrossRef CAS PubMed
.
- F. Ferretti, F. K. Scharnagl, A. Dall'Anese, R. Jackstell, S. Dastgir and M. Beller, Catal. Sci. Technol., 2019, 9, 3548–3553 RSC
.
- Y. Wang, Y. Shen, Y. Zhao, J. Lv, S. Wang and X. Ma, ACS Catal., 2015, 5, 6200–6208 CrossRef CAS
.
- X. Chen, Y. Cui, C. Wen, B. Wang and W.-L. Dai, Chem. Commun., 2015, 51, 13776–13778 RSC
.
- C. Lian, F. Ren, Y. Liu, G. Zhao, Y. Ji, H. Rong, W. Jia, L. Ma, H. Lu, D. Wang and Y. Li, Chem. Commun., 2015, 51, 1252–1254 RSC
.
- Y. Cui and W.-L. Dai, Catal. Sci. Technol., 2016, 6, 7752–7762 RSC
.
- Y. Cui, X. Chen and W.-L. Dai, RSC Adv., 2016, 6, 69530–69539 RSC
.
- H. Li, Y. Cui, Q. Liu and W.-L. Dai, ChemCatChem, 2018, 10, 619–624 CrossRef CAS
.
- T. S. Askgaard, J. K. Norskov, C. V. Ovesen and P. Stoltze, J. Catal., 1995, 156, 229–242 CrossRef CAS
.
- G. Busca, U. Costantino, F. Marmottini, T. Montanari, P. Patrono, F. Pinzari and G. Ramis, Appl. Catal., A, 2006, 310, 70–78 CrossRef CAS
.
- R. Q. Yang, X. C. Yu, Y. Zhang, W. Z. Li and N. Tsubaki, Fuel, 2008, 87, 443–450 CrossRef CAS
.
- L. M. He, H. Y. Cheng, G. F. Liang, Y. C. Yu and F. Y. Zhao, Appl. Catal., A, 2013, 452, 88–93 CrossRef CAS
.
- Q. Hu, G. L. Fan, S. Y. Zhang, L. Yang and F. Li, J. Mol. Catal. A: Chem., 2015, 397, 134–141 CrossRef CAS
.
- M. Bahmani, B. V. Farahani and S. Sahebdelfar, Appl. Catal., A, 2016, 520, 178–187 CrossRef CAS
.
- K. Kaneko, J. Membr. Sci., 1994, 96, 59–89 CrossRef CAS
.
- M. M. Yusoff, N. Yahaya, N. M. Saleh and M. Raoov, RSC Adv., 2018, 8, 25617–25635 RSC
.
- D. Hammoud, C. Gennequin, A. Aboukais and E. A. Aad, Int. J. Hydrogen Energy, 2015, 40, 1283–1297 CrossRef CAS
.
- C. Baltes, S. Vukojevic and F. Schueth, J. Catal., 2008, 258, 334–344 CrossRef CAS
.
- I. Atake, K. Nishida, D. Li, T. Shishido, Y. Oumi, T. Sano and K. Takehira, J. Mol. Catal. A: Chem., 2007, 275, 130–138 CrossRef CAS
.
- D. C. Pereira, D. L. A. de Faria and V. R. L. Constantino, J. Braz. Chem. Soc., 2006, 17, 1651–1657 CrossRef CAS
.
- N. Guillou, M. Louer and D. Louer, J. Solid State Chem., 1994, 109, 307–314 CrossRef CAS
.
- S. Y. Cheng, J. W. Kou, Z. H. Gao and W. Huang, Appl. Catal., A, 2018, 556, 113–120 CrossRef CAS
.
- M. Salavati-Niasari and F. Davar, Mater. Lett., 2009, 63, 441–443 CrossRef CAS
.
- C. L. Huang, J. J. Wen, Y. H. Sun, M. Y. Zhang, Y. F. Bao, Y. D. Zhang, L. Liang, M. L. Fu, J. L. Wu, D. Q. Ye and L. M. Chen, Chem. Eng. J., 2019, 374, 221–230 CrossRef CAS
.
- C. Rhodes, G. J. Hutchings and A. M. Ward, Catal. Today, 1995, 23, 43–58 CrossRef CAS
.
- J. Anton, J. Nebel, H. Q. Song, C. Froese, P. Weide, H. Ruland, M. Muhler and S. Kaluza, Appl. Catal., A, 2015, 505, 326–333 CrossRef CAS
.
- I. Melian-Cabrera, M. L. Granados and J. L. G. Fierro, J. Catal., 2002, 210, 273–284 CrossRef CAS
.
- K. W. Jun, W. J. Shen, K. S. R. Rao and K. W. Lee, Appl. Catal., A, 1998, 174, 231–238 CrossRef CAS
.
- S. Kuhl, A. Tarasov, S. Zander, I. Kasatkin and M. Behrens, Chem.–Eur. J., 2014, 20, 3782–3792 CrossRef PubMed
.
- F. Zhang, Y. Liu, X. Y. Xu, P. P. Yang, P. Miao, Y. L. Zhang and Q. Sun, Fuel Process. Technol., 2018, 178, 148–155 CrossRef CAS
.
- J. Y. Zheng, T.-K. Van, A. U. Pawar, C. W. Kim and Y. S. Kang, RSC Adv., 2014, 4, 18616 RSC
.
- M. A. Badillo-Avila, R. Castanedo-Perez, J. Marquez-Marin, D. E. Guzman-Caballero and G. Torres-Delgado, Mater. Chem. Phys., 2019, 236, 13 CrossRef
.
- J. Gong, H. Yue, Y. Zhao, S. Zhao, L. Zhao, J. Lv, S. Wang and X. Ma, J. Am. Chem. Soc., 2012, 134, 13922–13925 CrossRef CAS PubMed
.
- H. Abdullah and D. H. Kuo, ACS Appl. Mater. Interfaces, 2015, 7, 26941–26951 CrossRef CAS PubMed
.
- Y. Chen, H. Ding and S. Sun, Nanomaterials, 2017, 7, 217 CrossRef PubMed
.
- A. Hess, E. Kemnitz, A. Lippitz, W. E. S. Unger and D. H. Menz, J. Catal., 1994, 148, 270–280 CrossRef
.
- G. Lietz, K. H. Schnabel, C. Peuker, T. Gross, W. Storek and J. Volter, J. Catal., 1994, 148, 562–568 CrossRef CAS
.
- K. Shukla and V. C. Srivastava, RSC Adv., 2016, 6, 32624–32645 RSC
.
- S. Searles, D. G. Hummel, S. Nukina and P. E. Throckmorton, J. Am. Chem. Soc., 1960, 82, 2928–2931 CrossRef CAS
.
- Y. Okamoto, K. Fukino, T. Imanaka and S. Teranishi, Chem. Lett., 1984, 1, 71–74 CrossRef
.
- J. Y. Kim, J. A. Rodriguez, J. C. Hanson, A. I. Frenkel and P. L. Lee, J. Am. Chem. Soc., 2003, 125, 10684–10692 CrossRef CAS PubMed
.
- Y. Zhao, H. Zhang, Y. Xu, S. Wang, Y. Xu, S. Wang and X. Ma, J. Energy Chem., 2020, 49, 248–256 CrossRef
.
- W. Li, G. Fan, L. Yang and F. Li, Catal. Sci. Technol., 2016, 6, 2337–2348 RSC
.
- H. Liu, Z. Huang, Z. Han, K. Ding, H. Liu, C. Xia and J. Chen, Green Chem., 2015, 17, 4281–4290 RSC
.
- T. Fujitani and J. Nakamura, Catal. Lett., 1998, 56, 119–124 CrossRef CAS
.
- Y. Y. Cui, X. Chen and W. L. Dai, RSC Adv., 2016, 6, 69530–69539 RSC
.
Footnote |
| † Electronic supplementary information (ESI) available. See DOI: 10.1039/d0ra00347f |
| This journal is © The Royal Society of Chemistry 2020 |


