 Open Access Article
Effect of Fe, Co and Ni promoters on MoS2 based catalysts for chemoselective hydrogenation of nitroarenes†
Wenpeng Han ab,
Shanmin Wangc,
Xuekuan Lia,
Ben Maa,
Mingxian Dua,
Ligong Zhoua,
Ying Yanga,
Ye Zhang
 *a and
Hui Ge*a
aInstitute of Coal Chemistry, Chinese Academy of Sciences, Taiyuan 030001, China
bUniversity of Chinese Academy of Sciences, Beijing 100049, China
cDepartment of Physics, Southern University of Science & Technology, Shenzhen, Guangdong 518055, China
First published on 25th February 2020
Abstract
The effect of Fe, Co and Ni promoters on supported MoS2 catalysts for hydrogenation of nitroarenes were systematically investigated via experiment, characterization and DFT calculation. It was found that the addition of promoters remarkably improved the reaction activity in a sequence of Ni > Co > Fe > Mo. Meanwhile Ni promoted catalyst with the best performance showed good recyclability and chemoselectivity for a wide substrate scope. The characterization results revealed that the addition of promoters decreased the interaction between Mo and support and facilitated the reductive sulfidation of Mo species to produce more coordinated unsaturated sites (CUS). DFT calculations showed that the addition of promoters increased the formation of CUS, and enhanced the adsorption of hydrogen. The influence degree of promoters followed the sequence Ni > Co > Fe > Mo, which was consistent with those of the activities. Nitrobenzene hydrogenation and hydrogen activation occurred at the S and Mo edge, respectively. The adsorbed hydrogen diffused from the Mo edge to the S edge to participate in the hydrogenation reaction. Mechanism investigation showed that the main reason for increased activity by the addition of promoters was the increase of amounts of CUS and the secondary reason was the augmentation of intrinsic activity of CUS. The present studies give a new understanding for promoter modified MoS2 catalysts applied for hydrogenation of nitroarenes.
1 Introduction
Functionalized arylamines, which are primarily synthesized by chemoselective hydrogenation of the corresponding nitroarenes, are important organic intermediates for producing dyestuffs, agrochemicals, polymers, pharmaceuticals, and so on.1,2 However, the selective reduction of functionalized nitro compounds is challenging due to the presence of other highly reducible groups, such as C![[double bond, length as m-dash]](https://www.rsc.org/images/entities/char_e001.gif) C, C
C, C![[double bond, length as m-dash]](https://www.rsc.org/images/entities/char_e001.gif) O and C
O and C![[triple bond, length as m-dash]](https://www.rsc.org/images/entities/char_e002.gif) C groups.3,4 Traditionally, the noble metal (such as Pt, Pd, Ru, Rh, Au, Ag) catalysts have frequently been reported for this transformation, but the viability and cost of noble metals is a major barrier for their industrial applications.5–9 Thus, the non-noble metal based catalysts including the base metals, their oxides, carbides and sulfides have been extensively studied as the alternatives.10–17
C groups.3,4 Traditionally, the noble metal (such as Pt, Pd, Ru, Rh, Au, Ag) catalysts have frequently been reported for this transformation, but the viability and cost of noble metals is a major barrier for their industrial applications.5–9 Thus, the non-noble metal based catalysts including the base metals, their oxides, carbides and sulfides have been extensively studied as the alternatives.10–17
As we know, the two dimensional material is a powerful platform to design single site catalysts and its applications in CO2 reduction, CO oxidation, and so on.18–22 Among them, transition metal disulfides (TMDs) also attracted widespread attention due to good catalytic performance for hydrogenation of nitroarenes.23,24 Ma et al. found that FeS2 and graphene-supported CoS2 catalysts showed good reaction activity for hydrogenation of nitroarenes.25,26 Wei et al. reported that a porous carbon supported CoS2 catalyst showed a superior selectivity of 99% towards 3-aminostyrene.27 Duan et al. synthesized a novel N, S-codoped porous carbon supported FeS2 catalyst and exhibited excellent catalytic activity and tolerance for functionalized nitroarenes using water as a solvent.28 Among the TMDs, molybdenum disulfide (MoS2) with the typical graphene-like two dimensional property is emerging as a new catalyst for hydrogenation of nitroarenes.29–31 For example, commercial MoS2 and an oxygen-implanted MoS2 (O–MoS2) catalysts have been used to synthesize functionalized anilines from corresponding nitroarenes using hydrazine (N2H4·H2O) as the hydrogen source.32–34 A MoS2 nanocatalyst whose interlayer expanded by the insertion of carbon (MoS2@C) was reported to exhibit better catalytic performance compared with that of bulk MoS2 catalyst.35
Bulk MoS2 is a sandwich (S–Mo–S) layered structure composed of covalent bond in the layer and van der Waals in the interlayer. The catalytic active centers are supposed to be located on the edges of MoS2. The catalytic hydrogenation activity can be improved by reducing the particle sizes of MoS2 to expose more edges or adding metal promoters to form M–Mo–S phase at the edges of MoS2.36
As an effective method, the promoter modification has been widely used to improve the catalytic performance of MoS2 in the hydrodesulphurization (HDS) and hydrogen evolution reaction (HER) etc.37 And this promotion effect is mainly ascribed to the addition of promoter can remarkably reduce the binding energy compared with Mo and S at the edges of MoS2, which can lead to the formation of more active centers. Recently, Corma's group synthesized the nanolayered Co–Mo–S catalysts by one-pot hydrothermal method.38 Compared with the pure MoS2, Co-promoted MoS2 showed excellent activity and selectivity for the nitroarenes with reducible groups (such as C![[double bond, length as m-dash]](https://www.rsc.org/images/entities/char_e001.gif) C, C
C, C![[triple bond, length as m-dash]](https://www.rsc.org/images/entities/char_e002.gif) C, C
C, C![[double bond, length as m-dash]](https://www.rsc.org/images/entities/char_e001.gif) O). Nethravathi et al. reported Co-doped MoS2 nanosheets and applied for the nitroarene reduction.39 The results showed that incorporation of cobalt ions in the MoS2 lattice is the major reason for the efficiency of the promoted catalyst.
O). Nethravathi et al. reported Co-doped MoS2 nanosheets and applied for the nitroarene reduction.39 The results showed that incorporation of cobalt ions in the MoS2 lattice is the major reason for the efficiency of the promoted catalyst.
Although the important role of Co has been evidenced for selective hydrogenation of nitroarenes of MoS2 based catalysts, other candidate promoters (such as Fe, Ni) have not been studied. And there is lack of sufficient understanding of promoter effect on the structure–activity relationship and reaction mechanism of selective hydrogenation of nitroarenes, which will inhibit the application of MoS2 based catalysts. Besides, the Al2O3 was considered as a good support and widely used in many hydrogenation reactions.40 The Al2O3 can not only disperse the active components to improve the catalytic efficiency, but also can promote the promoter effectively adsorbed on the edge of MoS2 slabs to form more the single active component instead of the mixed active phase, which made the study more simplified. In this work, we systematically compared the effect of Fe, Co and Ni promoters on hydrogenation of nitroarenes over alumina supported MoS2 based catalysts. Good activity and chemoselectivity by the addition of promoters were evidenced, especially for Ni promoter. By various characterizations, the effect of promoters on the morphology and sulfidation of MoS2 were revealed. And DFT calculation was used to investigate the effect of promoters on the formation and regeneration of active centers, the adsorption of nitrobenzene and hydrogen, as well as reaction mechanism. The relationship of activity–structure was built based on the understanding of the key role of promoters located at the S edge of MoS2.
2 Experimental and theoretical methods
2.1 Chemicals and reagents
Nickel nitrate hexahydrate (Ni(NO3)2·6H2O, 99.0%), cobalt nitrate hexahydrate (Co(NO3)2·6H2O), ferric nitrate nonahydrate (Fe(NO3)3·9H2O) and ammonium molybdate ((NH4)6Mo7O24·4H2O) were ordered from Sinopharm Chemical Reagent Co., Ltd. The other nitroarenes were obtained from Aladdin Reagent Co.2.2 General procedure for catalyst preparation
According to the previous reports,41 MoO3/γ-Al2O3 precursor was obtained by impregnation of 5.0 g γ-Al2O3 with 6.5 mL ammonia solution of (NH4)6Mo7O24·4H2O (1.21 g, AHM), followed by drying at 100 °C for 8 h and calcining under air at 450 °C for 4 h, the content of Mo was determined as about 9.7 wt% by ICP-AES analysis (see Table S2, ESI†). M–MoO3/γ-Al2O3 precursor (M = Fe, Co, Ni) was prepared by impregnation of MoO3/γ-Al2O3 with an aqueous solution of Ni(NO3)2·6H2O, Co(NO3)2·6H2O, or Fe(NO3)3·9H2O, and then dried at 100 °C for 8 h and calcined under air at 450 °C for 4 h. The contents of promoters and Mo were about 2.3% and 9.7%, respectively. NiO/γ-Al2O3 was synthesized by impregnation of γ-Al2O3 with an aqueous solution of Ni(NO3)2·6H2O and treatment at the above process, and the content of Ni was about 2.3%.The precursors were activated by sulfidation with dimethyl disulfide (DMDS) before usage. The sulfidation procedure was following: 0.1 g catalyst was ground and sieved to 40–60 mesh, and then loaded in a fixed bed reactor with an inner diameter of 6 mm. The system was pressured to 4.0 MPa, and then heated to 200 °C within 1.5 h in a hydrogen flow (32 mL min−1). The 1.5 wt% DMDS dissolved in n-nonane (0.08 mL min−1) was pumped into the reaction system at 200 °C. The reactor was maintained at 200 °C for 2 h, followed by heating to 350 °C in 1 h, and held at the temperature for 4 h; after that, the reactor was cooled down to 280 °C. After sulfidation, the catalysts were purged with n-hexane three times, then dried under Ar atmosphere and sealed in a glass bottle for reactions and characterizations. The sulfided catalysts were denoted as MoS2/γ-Al2O3, M–MoS2/γ-Al2O3 (M = Fe, Co, Ni), and NiSx/γ-Al2O3, respectively.
2.3 Catalyst characterization
The high-resolution transmission electron microscopy (HRTEM) was performed using a Tecnai G2 F20 S-Twin at an accelerating voltage of 200 kV. The size and stacking number of M (Fe, Co, Ni)–MoS2 crystallites were counted over more than 400 particles from ten electron microscope photos.X-ray photoelectron spectroscopy (XPS) was performed on a Kratos AXIS ULTRA DLD spectrometer with Al Kα radiation and a multichannel detector, the binding energies were referenced to the C 1s at 284.6 eV.
The Ni and Mo content were determined by inductively coupled plasma-atomic emission spectrometry (ICP-AES) using an iCPA6300 instrument (Thermo Electron, USA).
Temperature-programmed reduction (TPR) measurements were carried out on a TP-5080 (Tianjin-Xianquan, China) quartz micro reactor equipped to a thermal conductivity detector (TCD). About 50 mg of oxidized precursor was heated from room temperature up to 850 °C at 10 °C min−1 with 5% H2-95% N2 (30 mL min−1) and held at that the temperature for 5 min.
Temperature-programmed desorption measurements of NO (NO-TPD) of sulfided catalysts were also carried out on this TP-5080. To avoid possible oxidation of catalysts, the samples (∼100 mg) were pretreated at 575 K for 30 min in H2, which was saturated by DMDS in a bubble device at ambient temperature, followed by cooling the samples to 473 K for 30 min in a He atmosphere with a flow rate of 26 mL min−1, and then cooled to 323 K over a period of 60 min. Prior to desorption, adsorption of NO was conducted at 323 K in a 1% NO-99% He atmosphere for 60 min at a flow at 52 mL min−1. The catalyst was then flushed in a He flow at 323 K for 60 min with a flow rate of 26 mL min−1 in order to eliminate the physically adsorbed NO. Desorption of NO was conducted from 323 K to 773 K with a heating rate of 10 K min−1. The amount of the desorbed NO was determined by an OmniStar GSD-320 mass spectrometer, which was pre-calibrated using standard mixed gases.
2.4 General procedure for hydrogenation of nitroarenes
Typically, substrates (1.0 mmol) and decalin (internal standard, 0.1 g) were injected to 15 mL isopropyl alcohol (IPA). The catalyst (0.1 g) and hydrazine hydrate (N2H4·H2O) were added into the above solution. Then, the reaction mixture was sealed and purged with 1 MPa N2. Finally, the reaction was heated to 100 °C at stirring and kept at the temperature for some time. After the reaction, the catalyst was separated and the solution was analyzed by GC and GC-MS.2.5 Density functional theory (DFT) calculations
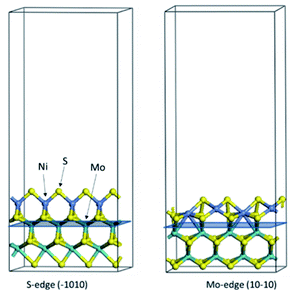
The first-principles DFT calculations were performed on Vienna Ab initio Simulation Package (VASP) using the Perdew–Burke–Ernzerh (PBE) functional of the generalized gradient approximation (GGA) to describe the exchange correlation effects, and the projector augmented waves method to treat the ionic–electronic interaction.As for the MoS2 catalyst with or without promoter modification, the active phases are hexagon slabs stacked from one to several layers. According to the literature,42,43 the coordinated unsaturated sites (CUS) on the edges are the main active centers. In this study, we constructed the 4 × 3 × 1 slab in the supercell with the lattice parameters of 12.664 × 30.053 × 13.170 Å (Fig. 1). The about 13 Å interval distance between slabs and about 20 Å of the vacuum layer thickness can avoid noticeable interaction between repeated structures.
To investigate the effect of promoters, the 100% Mo atoms exposed at Mo and S edges are substituted with Fe, Co or Ni atoms, respectively.44 Meanwhile the spin was set to the unstrict with the Fe, Co or Ni decoration. In order to save computation time, only atoms above the blue plane in Fig. 1 were kept free move, and all other atoms were frozen. The plane wave based total energy minimization scheme was utilized with a 1 × 2 × 2 k-point mesh and 350 eV energy cutoff, structures was relaxed until the force and energy on each atom was converged to less than 0.02 eV Å−1 and 10−5 eV. The exploration of transition state (TS) was conducted using the CINEB method with the same convergence standard as the structure optimization, and the TS was verified by the only one imaginary frequency of normal mode of the dynamical matrix.
3 Results and discussion
3.1 Selective hydrogenation of 4-nitrostyrene over various catalysts
A series of sulfided catalysts were tested for the selective hydrogenation of 4-nitrostyrene with hydrazine hydrate (N2H4·H2O) as reducing agent (Table 1). No transformation was observed in the absence of catalyst (Entry 1). And the product yield was low using γ-Al2O3 or NiSx/γ-Al2O3 as catalysts (Entry 2 and 3). In contrast, MoS2/γ-Al2O3 exhibited nearly 100% selectivity and over 50% yield after 2 h (Entry 4 and 5). And the yield was higher than the unsupported O–MoS2 catalyst (Entry 6) in the literature,34 which indicated that this supported catalyst improved the catalytic efficiency for the hydrogenation of 4-nitrostyrene. As we known, the IPA was also considered as a reductant or hydrogen source.45 In order to study the effect of the IPA, the experiment was conducted without N2H4·H2O (Entry 7). There was less than 5% yield obtained, indicating that IPA was not a good reductant or hydrogen source in this catalytic system. The yield was improved by the catalysts with the addition of Fe, Co, or Ni promoters. A slight increase of yield was observed by using Fe promoter modified catalyst (Entry 8 and 9). An apparent increase of yield (from 50% to 65%) was observed by using Co promoter modified catalyst (Entry 10 and 11), however, it is still lower than those of the reported, which may be related to the lower Co loadings. Corma et al. also found that when Co/Mo ratio was low (0.17), the activity of the catalyst was significantly reduced.38 Interestingly, with Ni adding into MoS2 catalyst, the yield was improved from 50% to 95% and the selectivity was 99% (Entry 12). When reaction time prolonged to 2 hours, 4-nitrostyrene was completely converted into the 4-aminostyrene (Entry 13). The above results showed that the addition of Ni promoter played crucial role for hydrogenation of nitroarenes. To determine whether the interaction between Ni and MoS2 was the reason for improved high activity, NiSx/γ-Al2O3 and MoS2/γ-Al2O3 catalysts were mechanically mixed and used for the reduction of 4-nitrostyrene (Entry 14 and 15). The yield and selectivity were apparently less than Ni–MoS2/γ-Al2O3 catalyst. Thus, the interaction between Ni and MoS2 presented important influences, which also was demonstrated by H2-TPR and XPS results (in below).| Entry | Catalyst | Time (h) | Selecte (%) | Yielde (%) |
|---|---|---|---|---|
| a Reaction conditions: 0.1 g catalyst, 1 mmol 4-nitrostyrene, 100 °C, 15 mL isopropyl alcohol, 1 MPa N2, 3 equiv. N2H4·H2O, calibration concentration of N2H4·H2O is 79.2%.b 18 mg catalyst (the molar content of Mo is the same as that of supported catalyst).c There was no N2H4·H2O added.d 0.2 g catalyst.e Detected by GC-MS and GC using decalin as the internal standard. | ||||
| 1 | — | 1 | 0 | 0 |
| 2 | γ-Al2O3 | 1 | 65 | 6 |
| 3 | NiSx/γ-Al2O3 | 1 | 77 | 14 |
| 4 | MoS2/γ-Al2O3 | 1 | 98 | 50 |
| 5 | MoS2/γ-Al2O3 | 2 | 98 | 79 |
| 6b | O–MoS2 | 2 | 95 | 56 |
| 7c | MoS2/γ-Al2O3 | 2 | 90 | <5 |
| 8 | Fe–MoS2/γ-Al2O3 | 1 | 99 | 52 |
| 9 | Fe–MoS2/γ-Al2O3 | 2 | 97 | 82 |
| 10 | Co–MoS2/γ-Al2O3 | 1 | 98 | 65 |
| 11 | Co–MoS2/γ-Al2O3 | 2 | 95 | 87 |
| 12 | Ni–MoS2/γ-Al2O3 | 1 | 99 | 95 |
| 13 | Ni–MoS2/γ-Al2O3 | 2 | 98 | 98 |
| 14d | NiSx/γ-Al2O3 + MoS2/γ-Al2O3 | 1 | 86 | 63 |
| 15d | NiSx/γ-Al2O3 + MoS2/γ-Al2O3 | 2 | 83 | 80 |
Encouraged by good performance of Ni–MoS2/γ-Al2O3 catalyst, the selective hydrogenation of various nitroarenes were further investigated. The selectivity, yield and optimized conditions are shown in Table S1.† For the halogen-substituted substrates, excellent yields (99%) of the corresponding haloanilines were obtained without any dehalogenation. No matter the substrates with electron-donating substituted groups (such as methyl and amino) or electron-withdrawing substituted groups (such as phenolic hydroxyl, alcoholic hydroxyl, carboxyl and ester) could be reduced to corresponding arylamines with high activity and selectivity. Although nitrile, ketone and olefinic group were supposed to be highly reducible groups, here only corresponding arylamines were obtained while the highly reducible groups were maintained. Because the noble metal and transition metal catalysts are sensitive to sulfur poisoning, the hydrogenation of nitroarenes with sulfur heteroatoms is challenging. In this work, the Ni–MoS2/γ-Al2O3 catalyst was sulfur resistant and showed good performance for hydrogenation of the sulfur-containing nitroarenes. The above results showed that the Ni promoted MoS2 catalyst exhibited good chemoselectivity for a wide range of substituted nitroarenes. The compatibility for various substrates was also demonstrated for un-promoted and Co promoted MoS2 catalysts by the previous reports.34,38 Our and other researches suggested that MoS2 based catalyst can achieve high selectivity for hydrogenation of nitroarenes. In addition, the reusability and hot filtration tests of the catalyst was also conducted using the nitrobenzene as a model compound to synthesize aniline. Fig. S1 (ESI†) showed that Ni–MoS2/γ-Al2O3 catalyst was stable after five consecutive runs.
3.2 Catalysts characterization
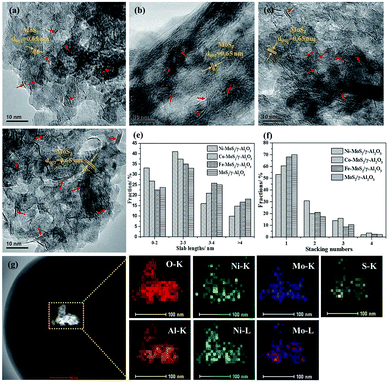
The morphology and microstructure of the MoS2 based catalyst series were observed by the high-resolution transmission electron microscopy (HRTEM). The HRTEM images in Fig. 2a–d clearly showed the generation of typical layered structure with a d-spacing of 0.65 nm, corresponding to (001) planes of hexagonal MoS2 sheets. Compared with MoS2/γ-Al2O3, the addition of the Fe, Co and Ni promoters can decrease slab lengths and increase stacking numbers of MoS2 sheets (Fig. 2e and f). The decreased slab lengths suggested high dispersion of active crystallites, which can expose more active edges and thus improve catalytic activity. The increased stacking numbers indicated that the promoters decreased the interaction between Mo and support, facilitating the formation of type II active phase with higher intrinsic activity.46 Especially, the addition of Ni promoter formed smallest crystallite sizes and highest stacking numbers, which may be one of the reasons for its high catalytic activity. In addition, high-angle annular dark-field scanning TEM (HADDF-STEM) image (Fig. 2g) showed a homogeneous distribution of Ni, Mo and S elements at Ni–MoS2/γ-Al2O3 catalyst surface, indicating high dispersion of active particles. From the XRD patterns (Fig. S2, ESI†), no obvious peaks corresponded to MoS2 or promoters, which also confirmed the high dispersion of active particles.To investigate the reducibility and interaction between promoters and Mo, the H2-TPR profiles of calcined MoO3/γ-Al2O3, FeOx–MoO3/γ-Al2O3, CoOx–MoO3/γ-Al2O3 and NiOx–MoO3/γ-Al2O3 samples were presented in Fig. 3. For MoO3/γ-Al2O3, there were two typical reduction peaks located at about 457 °C and 817 °C (Fig. 3a), respectively, corresponding to the reduction peaks of Mo-containing species from Mo6+ to Mo4+ and from Mo4+ to Mo0. After adding Fe promoter, the reduction peak (from Mo6+ to Mo4+) occurred at higher temperature (about 470 °C) in Fig. 3b and there was no obvious reduction peak of FeOx, indicating that there was the interaction between Fe and Mo and the addition of Fe slightly inhibited the reduction of Mo species. After adding Co promoter, the reduction peak of Mo-containing species from Mo6+ to Mo4+ slightly shifted to lower temperature (Fig. 3c). Besides, the TPR peak attributed to molybdate from Mo4+ to Mo0 also moved to a lower temperature (from 817 °C to 773 °C), indicating that the addition of Co facilitated reduction of Mo species. After adding Ni promoter, the former TPR peak remarkably dropped from 457 °C to 394 °C, and the later TPR peak decreased from 817 °C to 748 °C (Fig. 3d), suggesting the strong promoted effect of Ni on the reduction of Mo species, which may be favorable for the reductive sulfidation of Mo species.
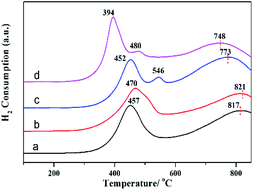 | ||
| Fig. 3 H2-TPR profiles: (a) MoO3/γ-Al2O3, (b) FeOx–MoO3/γ-Al2O3, (c) CoOx–MoO3/γ-Al2O3 and (d) NiOx-MoO3/γ-Al2O3. | ||
The electronic properties of Mo in pure MoS2 and Fe, Co and Ni promoted MoS2 catalysts were investigated using XPS technique in Fig. 4. According to the previous reports,47 the peaks of binding energies near 229.1, 231.2 and 232.8 eV are attributed to Mo4+, Mo5+ and Mo6+ of Mo 3d5/2, and the peak near 226.4 eV is attributed to S 2s. The Mo oxide in the catalyst is +6 valence, and the valence state of Mo will be reduced to +4 and +5 valence after sulfidation. The XPS peaks of Mo in Fig. 4 showed that although the majority of Mo presented in +4 and +5 valence, a part of Mo was still located at +6 valence without sulfidation.
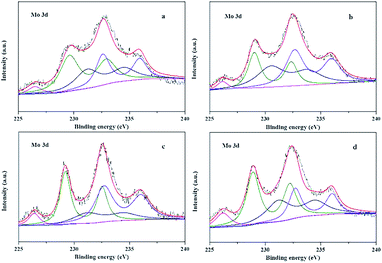 | ||
| Fig. 4 XPS spectra showing the binding energies of Mo 3d in MoS2/γ-Al2O3 (a), Fe–MoS2/γ-Al2O3 (b), Co–MoS2/γ-Al2O3 (c) and Ni–MoS2/γ-Al2O3 (d) catalysts. | ||
The relative proportion of Mo in different valence states was shown in Table 2. For the Fe, Co and Ni promoted MoS2 catalysts, the relative contents of Mo4+ were 40.5%, 42.5% and 46.2%, respectively, higher than the MoS2/γ-Al2O3 catalyst (38.7%), and the sum of Mo4+ and Mo5+ was also higher than that of the MoS2/γ-Al2O3 catalyst, which indicated that the addition of promoters improved the reductive sulfidation of Mo species. And the improved degree followed a sequence of Ni > Co > Fe > Mo. In addition, the results of peak separation for Ni, Co and Fe promoters in Fig. S3 (ESI†) showed that there was on obvious NiS2, CoS2 or FeS2 active phases formed, indicating that the single active phase could be prepared using alumina support.
| Samples | Mo 3d (%) | |||
|---|---|---|---|---|
| Mo4+ | Mo5+ | Mo6+ | Mo4+ + Mo5+ | |
| MoS2/γ-Al2O3 | 38.7 | 20.5 | 40.8 | 59.2 |
| Fe–MoS2/γ-Al2O3 | 40.5 | 19.5 | 40.0 | 60.0 |
| Co–MoS2/γ-Al2O3 | 42.5 | 22.4 | 35.1 | 64.9 |
| Ni–MoS2/γ-Al2O3 | 46.2 | 31.1 | 22.7 | 77.3 |
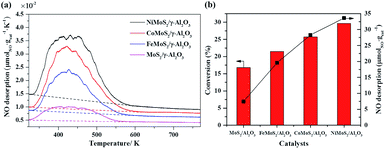
The coordinative unsaturated sites (CUS) at the edge of MoS2 slabs have been deemed as the active centers in the hydrodesulfurization (HDS) and hydrodeoxygenation (HDO).48 They are also postulated as the reaction sites in the selective hydrogenation of nitroarenes owing to the similar hydrogenation process. Due to NO molecule can adsorb on CUS, the NO temperature-programmed desorption (NO-TPD) experiment was used to estimate the amount of CUS on the MoS2/γ-Al2O3 and promoted MoS2 catalysts.49 As shown in Fig. 5a, peak profiles were similar and the main peaks were at about 430 K, but the NO desorption capacity was different in the sequence of Ni > Co > Fe > Mo. The NO desorption capacity of MoS2/γ-Al2O3 was only 7.5 μmol gcat−1, NO desorption capacity of catalyst modified by Fe promoter was 2.6 times (19.6 μmol gcat−1) of the MoS2/γ-Al2O3. Further improving the NO desorption capacity to 28.3 μmol gcat−1 and 33.6 μmol gcat−1 by Co and Ni promoters modified MoS2 catalysts. Fig. 5b showed the relationship between specific NO adsorption capacity and the activity of hydrogenation of nitrobenzene. The conversions of MoS2/γ-Al2O3, Fe–MoS2/γ-Al2O3, Co–MoS2/γ-Al2O3 and Ni–MoS2/γ-Al2O3 at 40 °C and 0.5 h were 16.8%, 21.5%, 25.7% and 29.6%, respectively. The NO desorption capacity has a positive correlation with conversion, which indicated that the reaction activity of nitrobenzene was closely related to the amount of CUS.
3.3 Formation of CUS, adsorption of hydrogen and nitrobenzene as well as the reaction mechanism for hydrogenation of nitrobenzene
As reported in the literatures,34,50 the nitrobenzene hydrogenation over MoO2 or O–MoS2 catalysts with N2H4 was a transfer hydrogenation process. Wang et al. studied the dissociation process of N2H4 on catalyst in detail by DFT calculations and the results showed that the stepwise hydrogen transfer via the cleavage of the N–H bond is the key step to create the dissociated hydride and active hydrogen species in polar electronic states (Hδ− and Hδ+). According the above, we have a better understanding of how N2H4 can release active H on the catalysts. However, there was lack of sufficient understanding of how the nitrobenzene and active H were adsorbed, reacted and desorbed on the active center. Thus, it is necessary to study the above aspects by DFT calculation. Owing to the CUS on the MoS2 based catalysts is deemed as active center for selective hydrogenation of nitroarenes, we investigated the formation and regeneration of CUS by DFT calculation. To reveal the selective hydrogenation process, we studied the adsorption of hydrogen and nitrobenzene at S and Mo edges, respectively. And we investigated the consecutive six hydrogenation steps of nitrobenzene on the Ni substituted MoS2 slabs. To compare the effect of promoters on the intrinsic activity, we compared the energy barrier of the rate-determining step for un-promoted and promoted MoS2 catalysts.| Edge + 1/2H2NNH2 = Edge-CUS + H2S + 1/2N2 | (1) |
| ΔEcus = Eedge-CUS + EH2S + 1/2EN2 − Eedge + 1/2EH2NNH2 | (2) |
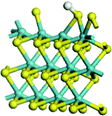
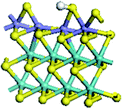
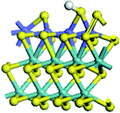
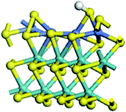
The results were listed in Table 3. It can be seen that no matter at S edge or Mo edge, the formation of CUS was favorable by the promoter substitution, and the formation energy followed the sequence of Mo > Fe > Co > Ni. In particular, Ni substituted Mo can greatly reduce the CUS formation energy from 223.7 kJ mol−1 to 47.4 kJ mol−1 on the S edge and from 80.8 kJ mol−1 to −66.3 kJ mol−1 on the Mo edge. Besides, it was found that the CUS formation energy at Mo edge was much less than that at S edge. It can be seen (Table 3) that the S coordination number of transition metal at Mo edge and S edge was six and four, respectively. The apparent unsaturation coordination property of transition metal at S edge led to the inhibition for the sulfur removal, thus the formation of CUS was more difficult. The decrease of CUS formation energy can increase the amount of CUS, facilitating the hydrogenation of nitroarenes.
In order to efficiently achieve the selective hydrogenation of nitrobenzene and derivatives, the nitrobenzene molecule needs to adsorb on CUS, meanwhile the hydrogen adsorbs on the S atom near the CUS. We thus studied the hydrogen adsorption near the CUS (Table 4). The hydrogen adsorption reaction was expressed in eqn (3), and the reaction adsorption energy calculation was shown in eqn (4).
| 1/4H2NNH2 + edge-CUS = edge-CUS-H + 1/4N2 | (3) |
| ΔEHads = Eedge-CUS-H + 1/4EN2 − Eedge-CUS − 1/4EH2NNH2 | (4) |
Table 4 showed the results of hydrogen adsorption reaction on the un-promoted and Fe, Co and Ni promoted S edge and Mo edge, respectively. It can be seen that the addition of promoters can apparently decrease the reaction energy of hydrogen adsorption, following a sequence of Mo > Fe > Co > Ni. No matter at S edge or Mo edge, the Ni substitution always resulted in the lowest reaction energy, illustrating that the hydrogen activation was largely facilitated by the Ni substitution of Mo at the edge. By comparison of the hydrogen adsorption at the S edge and Mo edge, it showed that hydrogen was favorable to adsorb on Mo edge than on S edge, suggesting the hydrogen was preferred to be activated at Mo edge.
Expect for the H activation is an important factor for selective hydrogenation, the activation of nitrobenzene by adsorption also plays very important roles. We further studied the adsorption energy and adsorption structure of the nitrobenzene on CUS at S edge and Mo edge for the un-promoted and promoted MoS2 slabs. The adsorption energy of nitrobenzene was calculated according to eqn (5) and the adsorption structures were presented in the Table 5.
| ΔEads = ECUS-nitrobenzene − ECUS − Enitrobenzene | (5) |
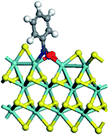
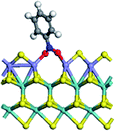
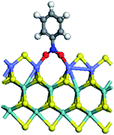
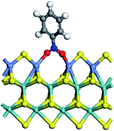
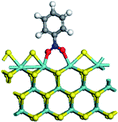
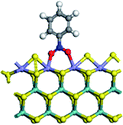
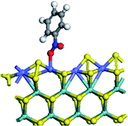
It can be seen (Table 5) that the replacement of Mo with promoters at S edge led to the decrease of the adsorption energy of nitrobenzene, following a sequence of Mo > Fe > Co > Ni. For the adsorption conformation of nitrobenzene on un-promoted S edge, the two Mo atoms at CUS bonded with the two O atoms and the one N atom of nitro group. This may be the reason for the strongest adsorption of nitrobenzene on un-promoted S edge. For promoter promoted S edge, the nitrobenzene molecule adsorbed on CUS with two O atoms bonding with two promoter atoms, respectively. And the nitrobenzene rode on the CUS with the two O atoms located at the two sides of CUS. These results illustrated that the addition of promoter was unfavorable for the adsorption of nitrobenzene. According to the Sabatier principle, the interaction between catalyst and substrate should be no too strong nor too weak. In this work, the adsorption of nitrobenzene on the CUS can be regulated by the promoter substitution, thus influencing the intrinsic activity of hydrogenation reaction.
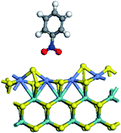
At Mo edge, however, the nitrobenzene hardly adsorbed on the CUS. The adsorption energies were less than −50 kJ mol−1 for all four edges (negative illustrating heat release). There was a weak adsorption energy of −43.9 kJ mol−1 on un-promoted CUS. Fe substitution led to a positive adsorption energy, suggesting an unfavorable adsorption. Co substituted CUS presented a weak adsorption of nitrobenzene (−48.8 kJ mol−1) with only one O atom connected with Co atom. And for Ni substitution, the nitrobenzene only physically adsorbed on CUS with a low adsorption energy of (−32.9 kJ mol−1). The results illustrated that the nitrobenzene cannot be effectively activated at Mo edge owing to the very weak adsorption.
Based on the above DFT results, it was postulated that the nitrobenzene and hydrogen were activated at S edge and Mo edge, respectively. Although the CUS was formed more easily on Mo edge, the hydrogenation of nitrobenzene occurred actually on the CUS at S edge. The activated hydrogen at Mo edge diffused to S edge and participated in the hydrogenation reaction.
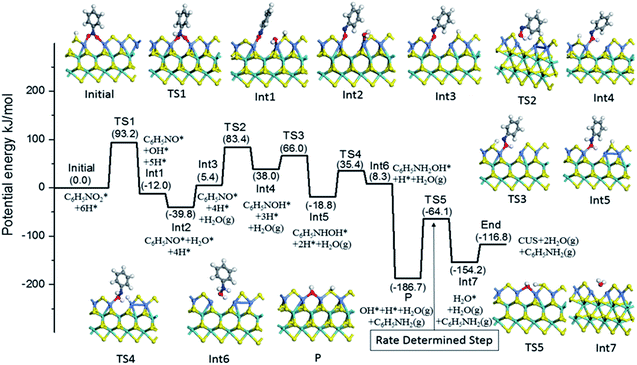
Based on the above experiment and analysis, we further studied the direct reaction mechanism of nitrobenzene hydrogenation on the Ni substituted S edge. Fig. 6 presented this reaction process. For simplicity, we neglected the energy difference between the respective adsorption and the co-adsorption of H and reactant molecule, which does not influence the energy barriers of TS.55 The hydrogenation of nitrobenzene proceeded six consecutive hydrogenation steps, producing two water molecules and one aniline product.54,56 As shown in Fig. 6, the nitrobenzene was firstly hydrogenated to NSB, crossing energy barrier of 93.2 kJ mol−1 (TS1). The NSB and PHA as intermediates were hydrogenated, passing the energy barriers of 78.0 kJ mol−1 (TS2) and 54.2 kJ mol−1 (TS4), respectively. These calculation results were consistent with experiment ones in Table S3.† After desorption of aniline from the CUS, only the OH group remained on the CUS (P). And the hydrogenation of OH passed a barrier of 127.7 kJ mol−1 (TS5), which was the highest in the all elementary reaction. Thus for the Ni substituted S edge, the rate-determining step was suggested as the OH group hydrogenated to H2O.
To investigate the effect of promoters on the intrinsic activities of MoS2 based catalysts, ones may need to calculate all the hydrogenation reaction steps over each promoted or un-promoted CUS. However, this is very expensive and daunting work. For balancing the consumption of calculation time and the effectiveness of results, we only compared energy barrier of H2O formation on the un-promoted and promoted CUS, because this reaction was the rate-determining step in the Ni substituted CUS. The results were presented in Fig. 7a. It was observed that the energy barriers increased the sequence of Fe < Ni < Mo < Co. It was deduced that CUS without promotion or with Co-promotion have higher energy barrier than Ni promoted CUS. However, Fe promoted CUS showed the lowest energy barrier for H2O formation. This illustrated that the observed activity for Fe promoted catalyst may not be dominated by the intrinsic activity of Fe-CUS. But there was also the other possibility, the rate-determining step on the Fe-CUS may not be the H2O formation. More detailed investigation about the reaction mechanism may be necessary for the Fe promoted surface in the future research.
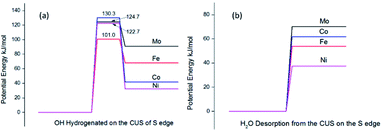 | ||
| Fig. 7 Comparison of energy barrier of water formation (a) and desorption energy at CUS of S edge without promotion and with Fe, Co Ni promotion (b). | ||
The last step of hydrogenation of nitrobenzene is desorption of water, which leads to the regeneration of CUS active center. We compared the desorption energy of water on the CUS at S edge and the results were shown in Fig. 7b. It was found that desorption energy followed the sequence of Ni < Fe < Co < Mo. The promoters can facilitate the desorption of water, leading to the regeneration of promoted CUS more easily.
In this study, the catalysts were prepared with Al2O3 as the support by impregnation method, which made the promoters highly dispersed and effectively adsorbed on the edge of MoS2 slabs to form more the single phases such as NiMoS, CoMoS or FeMoS. The reaction activity and chemoselectivity are the most important two factors for hydrogenation of nitroarenes. It was evidenced that the addition of promoters can effectively improve the activity in the sequence of Ni > Fe > Co > Mo. The reasons can be summarized as follows:
(1) The addition of Ni and Co promoters decreased the interaction between Mo with support and facilitated the reduction and sulfidation of oxide components to form more NiMoS and CoMoS active phases. However, addition of Fe promoter only slightly increased the sulfidation of Mo species, thus exhibited only a little increase of the reaction activity.
(2) The literatures reported that the NO-TPD characterization was used to measure the amount of CUS of MoS2 slabs.49 DFT calculation showed that NO was only the physical adsorption on the Mo edge, as shown in Table S4 (ESI†). The physical adsorbed NO will be removed by the purging treatment. Thus, the amount of NO desorption in the NO-TPD represented the CUS at S edge rather than at Mo edge. In this work, the NO-TPD measurement showed that the amount of CUS at S edge followed a sequence of Ni > Fe > Co > Mo, which was consistent with the formation of CUS at S edge by DFT calculation. Thus, the amount of CUS active center was supposed to be the main reason to influence the hydrogenation activity.
(3) The addition of promoters can facilitate the formation of type II active phases, which possessed the higher intrinsic activities. This can be another reason for the improved reaction activities.
(4) The addition of promoters was favorable for the hydrogen activation. The hydrogen may firstly adsorb activation on the Mo edge. Due to that supported MoS2 was hexagon slab with the S edge and Mo edge arrayed alternatively, the adsorbed hydrogen can diffuse from the Mo edge to S edge through the corner.
(5) The addition of Ni promoter showed the weakest adsorption of nitrobenzene, but the strongest adsorption of hydrogen. The un-promoted catalyst showed the strongest adsorption of nitrobenzene, but the weakest adsorption of hydrogen, and Co and Fe were between them. The synergy effect of adsorption of nitrobenzene and hydrogen mainly influenced the intrinsic activity. The comparison of energy barrier of H2O formation showed that CUS without promotion or with Co-promotion have lower catalytic intrinsic activities than Ni promoted CUS. Interestingly, Fe promoted CUS showed the lowest energy barrier for H2O formation, even though the H2O formation may not be the rate determined step of the reaction. As we known, Fe based catalysts have showed excellent performance for hydrogenation of the nitroarenes. Therefore, Fe promoted MoS2 catalyst may also have high intrinsic activity, but it may be affected by the preparation method and sulfidation, which made the observed activity lower.
As for the hydrogenation selectivity of the catalysts, due to that the nitro group can ride on the CUS with the two O atoms bonding with the transition metal, the N–O bond can be sufficiently activated, leading that the hydrodeoxygenation of nitro group became easier. This concerted combination of nitro group with CUS does not appear for most of other sensitive groups. Thus the high selectivity of MoS2 based catalysts can be obtained. Another reason is that nitro group is usually more easily hydrogenated than other sensitive groups. The substitution of Mo with promoter atoms mainly change the electronic structures, but does not apparently change the geometry structures. Thus the reaction activities are heavily influenced, however, the selectivity is less influenced. As a result, the MoS2 based catalysts can achieve the good chemoselectivity for hydrogenation of nitroarenes.
4 Conclusions
By the impregnation method, Fe, Co and Ni promoters modified MoS2 catalysts were prepared and employed for the hydrogenation of nitroarenes. The addition of promoters remarkably improved the reaction activity in a sequence of Ni > Co > Fe > Mo. And Ni promoted catalyst with the best performance also showed good recyclability and chemoselectvity for many substrates with sensitive groups such as nitrile, ketone, alkenyl and so on. Characterization results showed that the active particles were highly dispersed and promoter modification decreased the interaction between Mo with support, which facilitated the formation of type II active phases with higher intrinsic activity. Addition of Fe promoter only slightly improved the sulfidation of Mo species compared with the sulfidation of MoS2/γ-Al2O3. However, the addition of Co and Ni promoters can apparently promote the reduction of Mo species, so that the sulfidation of Mo species was remarkably improved, especially for Ni promoter. NO-TPD measurement showed that the amount of CUS active center followed a sequence of Ni > Co > Fe > Mo. The DFT calculations revealed that the nitrobenzene and hydrogen were activated at S edge and Mo edge, respectively. The hydrogenation of nitrobenzene occurred on CUS at S edge, and activated hydrogen at Mo edge diffused to S edge to participate in the hydrogenation reaction. For Ni promoted MoS2 surface, the H2O formation in the second last step has the highest TS barrier, suggested as the rate-determining step. The formed water was easier to release from CUS active center for promoter modification, which made the CUS active center regenerated more efficiently. The present studies give a new understanding for the promoter modified MoS2 catalysts applied for the hydrogenation of nitroarenes.Conflicts of interest
There are no conflicts to declare.Acknowledgements
This work was supported financially by the National Natural Science Foundation of China (No. 21473231 and No. 21603256).Notes and references
- R. S. Downing, P. J. Kunkeler and H. van Bekkum, Catal. Today, 1997, 37, 121–136 CrossRef CAS.
- J. J. Song, Z. F. Huang, L. Pan, K. Li, X. W. Zhang, L. Wang and J. J. Zou, Appl. Catal., B, 2018, 227, 386–408 CrossRef CAS.
- M. Macino, A. J. Barnes, R. Y. Qu, E. K. Gibson, D. J. Morgan, S. J. Freakley, N. Dimitratos, C. J. Kiely, X. Gao, A. M. Beale, D. Bethell, Q. He, M. Sankar, G. J. Hutchings and S. M. Althahban, Nat. Catal., 2019, 2, 873–881 CrossRef CAS.
- P. Lara and K. Philippot, Catal. Sci. Technol., 2014, 4, 2445–2465 RSC.
- S. Giri, R. Das, C. van der Westhuyzen and A. Maity, Appl. Catal., B, 2017, 209, 669–678 CrossRef CAS.
- R. Sedghi, M. M. Heravi, S. Asadi, N. Nazari and M. R. Nabid, Curr. Org. Chem., 2016, 20, 696–734 CrossRef CAS.
- A. Corma and P. Serna, Science, 2006, 313, 332–334 CrossRef CAS PubMed.
- F. Q. Leng, I. C. Gerber, P. Lecante, S. Moldovan, M. Girleanu, M. R. Axet and P. Serp, ACS Catal., 2016, 6, 6018–6024 CrossRef CAS.
- T. W. He, C. M. Zhang, L. Zhang and A. J. Du, Nano Res., 2019, 12, 1817–1823 CrossRef CAS.
- J. J. Shi, Y. Y. Wang, W. C. Du and Z. Y. Hou, Carbon, 2016, 99, 330–337 CrossRef CAS.
- R. V. Jagadeesh, A. E. Surkus, H. Junge, M. M. Pohl, J. Radnik, J. Rabeah, H. M. Huan, V. Schunemann, A. Bruckner and M. Beller, Science, 2013, 342, 1073–1076 CrossRef CAS PubMed.
- Z. Z. Wei, J. Wang, S. J. Mao, D. F. Su, H. Y. Jin, Y. H. Wang, F. Xu, H. R. Li and Y. Wang, ACS Catal., 2015, 5, 4783–4789 CrossRef CAS.
- F. W. Zhang, C. Zhao, S. Chen, H. Li, H. Q. Yang and X. M. Zhang, J. Catal., 2017, 348, 212–222 CrossRef CAS.
- H. G. Huang, X. C. Liang, X. G. Wang, Y. Sheng, C. J. Chen, X. J. Zou and X. G. Lu, Appl. Catal., A, 2018, 559, 127–137 CrossRef CAS.
- W. C. Cheong, W. J. Yang, J. Zhang, Y. Li, D. Zhao, S. J. Liu, K. L. Wu, Q. G. Liu, C. Zhang, D. S. Wang, Q. Peng, C. Chen and Y. D. Li, ACS Appl. Mater. Interfaces, 2019, 11, 33819–33824 CrossRef CAS PubMed.
- W. She, T. Q. J. Qi, M. X. Cui, P. F. Yan, S. W. Ng, W. Z. Li and G. M. Li, ACS Appl. Mater. Interfaces, 2018, 10, 14698–14707 CrossRef CAS PubMed.
- G. Hahn, J. K. Ewert, C. Denner, D. Tilgner and R. Kempe, ChemCatChem, 2016, 8, 2461–2465 CrossRef CAS.
- M. Y. Li, V. Bacic, I. A. Popov, A. I. Boldyrev, T. Heine, T. Frauenheim and E. Ganz, J. Am. Chem. Soc., 2015, 46, 2757–2762 Search PubMed.
- J. H. Liu, L. M. Yang and E. Ganz, J. Mater. Chem. A, 2019, 7, 11944–11952 RSC.
- J. H. Liu, L. M. Yang and E. D. Ganz, J. Mater. Chem. A, 2019, 7, 3805–3814 RSC.
- J. H. Liu, L. M. Yang and E. Ganz, Energy Environ. Sci., 2019, 2, 193–200 CAS.
- P. Zhao, Y. D. Ma, X. S. Lv, M. M. Li, B. B. Huang and Y. Dai, Nano Energy, 2018, 51, 533–538 CrossRef CAS.
- J. R. Morse, J. F. Callejas, A. J. Darling and R. E. Schaak, Chem. Commun., 2017, 53, 4807–4810 RSC.
- Y. N. Zhang, X. H. Li, Y. Y. Cai, L. H. Gong, K. X. Wang and J. S. Chen, RSC Adv., 2014, 4, 60873–60877 RSC.
- B. Ma, X. L. Tong, C. X. Guo, X. N. Guo, X. Y. Guo and F. J. Keil, RSC Adv., 2016, 6, 55220–55224 RSC.
- B. Ma, Y. Y. Wang, X. L. Tong, X. N. Guo, Z. F. Zheng and X. Y. Guo, Catal. Sci. Technol., 2017, 7, 2805–2812 RSC.
- Z. Z. Wei, S. J. Mao, F. F. Sun, J. Wang, B. B. Mei, Y. Q. Chen, H. R. Li and Y. Wang, Green Chem., 2018, 20, 671–679 RSC.
- Y. N. Duan, X. S. Dong, T. Song, Z. Z. Wang, J. L. Xiao, Y. Z. Yuan and Y. Yang, ChemSusChem, 2019, 12, 4636–4644 CrossRef CAS PubMed.
- S. Garcia-Dali, J. I. Paredes, J. M. Munuera, S. Villar-Rodil, A. Adawy, A. Martinez-Alonso and J. M. D. Tascon, ACS Appl. Mater. Interfaces, 2019, 11, 36991–37003 CrossRef CAS PubMed.
- N. Saha, A. Sarkar, A. B. Ghosh, A. K. Dutta, G. R. Bhadu, P. Paul and B. Adhikary, RSC Adv., 2015, 5, 88848–88856 RSC.
- Z. C. Li, D. L. Zhang, J. J. Ma, D. B. Wang and C. X. Xie, Mater. Lett., 2018, 213, 350–353 CrossRef CAS.
- L. Huang, P. F. Luo, M. Xiong, R. Z. Chen, Y. Wang, W. H. Xing and J. Huang, Chin. J. Chem., 2013, 31, 987–991 CrossRef CAS.
- C. F. Zhang, X. Wang, M. R. Li, Z. X. Zhang, Y. H. Wang, R. Si and F. Wang, Chin. J. Catal., 2016, 37, 1569–1578 CrossRef CAS.
- C. F. Zhang, Z. X. Zhang, X. Wang, M. R. Li, J. M. Lu, R. Si and F. Wang, Appl. Catal., A, 2016, 525, 85–93 CrossRef CAS.
- J. Wang, Y. J. Zhang, J. Y. Diao, J. Y. Zhang, H. Y. Liu and D. S. Su, Chin. J. Catal., 2018, 39, 79–87 CrossRef CAS.
- H. Topsoe, B. S. Clausen, R. Candia, C. Wivel and S. Morup, J. Catal., 1981, 68, 433–452 CrossRef.
- Y. L. Jia, Z. H. Wang, L. Y. Wang, Y. Ma, G. N. Wang, Y. H. Lin, X. Hu and K. Zhang, ChemSusChem, 2019, 12, 3336–3342 CrossRef CAS PubMed.
- I. Sorribes, L. C. Liu and A. Corma, ACS Catal., 2017, 7, 2698–2708 CrossRef CAS.
- C. Nethravathi, J. Prabhu, S. Lakshmipriya and M. Rajamathi, ACS Omega, 2017, 2, 5891–5897 CrossRef CAS PubMed.
- G. Shi, W. Han, P. Yuan, Y. Fan and X. J. Bao, Chin. J. Catal., 2013, 34, 659–666 CrossRef CAS.
- S. Texier, G. Berhault, G. Perot, V. Harle and F. Diehl, J. Catal., 2004, 223, 404–418 CrossRef CAS.
- P. Zheng, T. S. Li, K. B. Chi, C. K. Xiao, J. Y. Fan, X. L. Wang and A. J. Duan, Appl. Catal., B, 2019, 257, 11 CrossRef.
- F. Caron, M. Rivallan, S. Humbert, A. Daudin, S. Bordiga and P. Raybaud, J. Catal., 2018, 361, 62–72 CrossRef CAS.
- M. Y. Sun, A. E. Nelson and J. Adjaye, J. Catal., 2005, 233, 411–421 CrossRef CAS.
- A. S. Nagpure, A. K. Venugopal, N. Lucas, M. Manikandan, R. Thirumalaiswamy and S. Chilukuri, Catal. Sci. Technol., 2015, 5, 1463–1472 RSC.
- H. Ge, X.-D. Wen, M. A. Ramos, R. R. Chianelli, S. Wang, J. Wane, Z. Qin, Z. Lyu and X. Li, ACS Catal., 2014, 4, 2556–2565 CrossRef CAS.
- Y. R. Liu, X. Shang, W. K. Gao, B. Dong, J. Q. Chi, X. Li, K. L. Yan, Y. M. Chai, Y. Q. Liu and C. G. Liu, Appl. Surf. Sci., 2017, 412, 138–145 CrossRef CAS.
- S. M. Wang, H. Ge, W. P. Han, Y. J. Li, J. Z. Zhang, X. H. Yu, J. Q. Qin, Z. W. Quan, X. D. Wen, X. K. Li, L. P. Wang, L. L. Daemen, D. W. He and Y. S. Zhao, J. Phys. Chem. C, 2017, 121, 19451–19460 CrossRef CAS.
- P. Liu, J. C. Lu, Z. Z. Xu, F. Liu, D. K. Chen, J. Yu, J. P. Liu, S. F. He, G. P. Wan and Y. M. Luo, Mol. Catal., 2017, 442, 39–48 CrossRef CAS.
- C. F. Zhang, J. M. Lu, M. R. Li, Y. H. Wang, Z. Zhang, H. J. Chen and F. Wang, Green Chem., 2016, 18, 2435–2442 RSC.
- H. U. Blaser, Science, 2006, 313, 312–313 CrossRef CAS PubMed.
- X. C. Meng, H. Y. Cheng, S. Fujita, Y. C. Yu, F. Y. Zhao and M. Arai, Green Chem., 2011, 13, 570–572 RSC.
- A. Mahata, R. K. Rai, I. Choudhuri, S. K. Singh and B. Pathak, Phys. Chem. Chem. Phys., 2014, 16, 26365–26374 RSC.
- R. Milian, L. C. Liu, M. Boronat and A. Corma, J. Catal., 2018, 364, 19–30 CrossRef.
- T. Sheng, Y. J. Qi, X. Lin, P. Hu, S. G. Sun and W. F. Lin, Chem. Eng. J., 2016, 293, 337–344 CrossRef CAS.
- L. Gong, Y. Mu and M. J. Janik, Appl. Catal., B, 2018, 236, 509–517 CrossRef CAS.
Footnote |
| † Electronic supplementary information (ESI) available: Reaction evaluation, catalyst characterization and DFT calculation for NO adsorption on Mo edge. See DOI: 10.1039/d0ra00320d |
| This journal is © The Royal Society of Chemistry 2020 |




![[thin space (1/6-em)]](https://www.rsc.org/images/entities/char_2009.gif)


